INFORMATION PROCESSING N6 TL MOKOENA


7 Slides100.54 KB
INFORMATION PROCESSING N6 TL MOKOENA
FLOW CHARTS Topic 9 Page 168
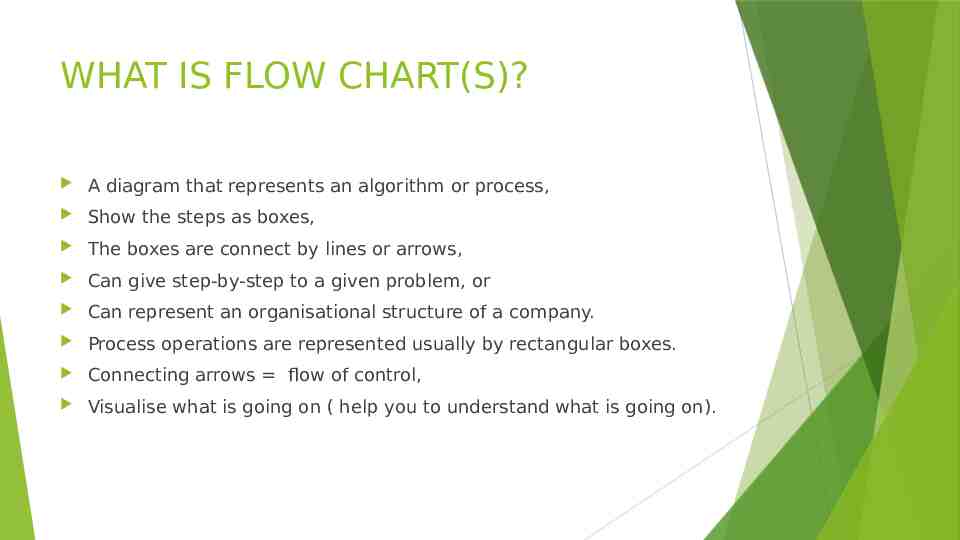
WHAT IS FLOW CHART(S)? A diagram that represents an algorithm or process, Show the steps as boxes, The boxes are connect by lines or arrows, Can give step-by-step to a given problem, or Can represent an organisational structure of a company. Process operations are represented usually by rectangular boxes. Connecting arrows flow of control, Visualise what is going on ( help you to understand what is going on).
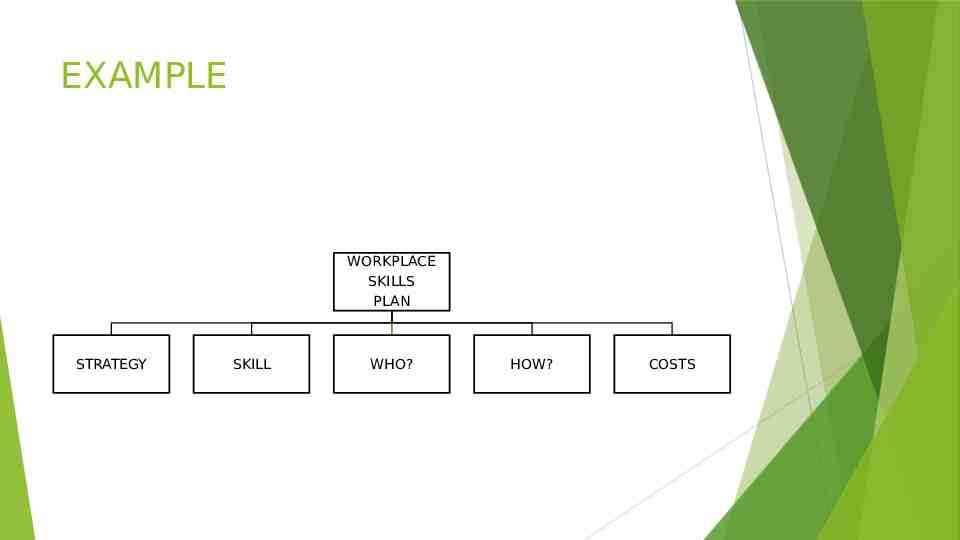
EXAMPLE WORKPLACE SKILLS PLAN STRATEGY SKILL WHO? HOW? COSTS
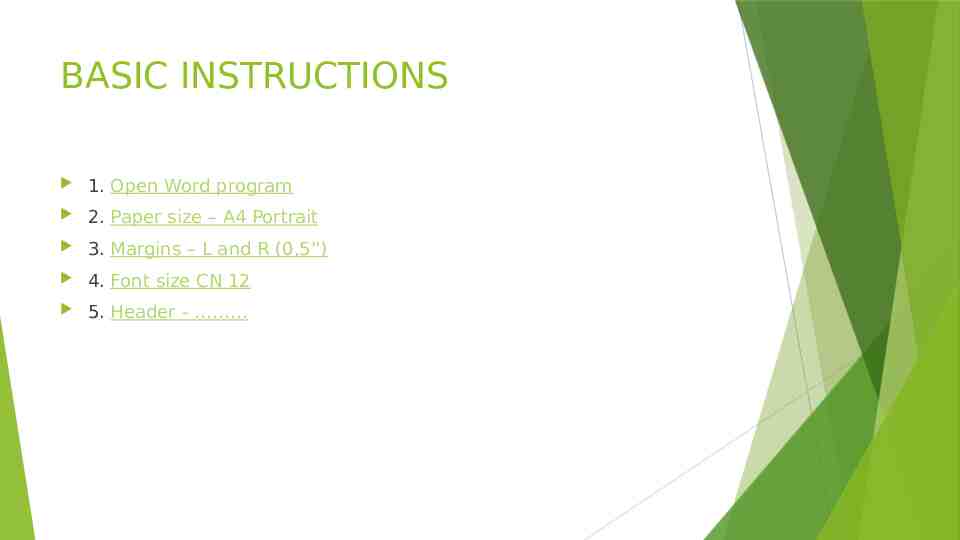
BASIC INSTRUCTIONS 1. Open Word program 2. Paper size – A4 Portrait 3. Margins – L and R (0,5”) 4. Font size CN 12 5. Header -
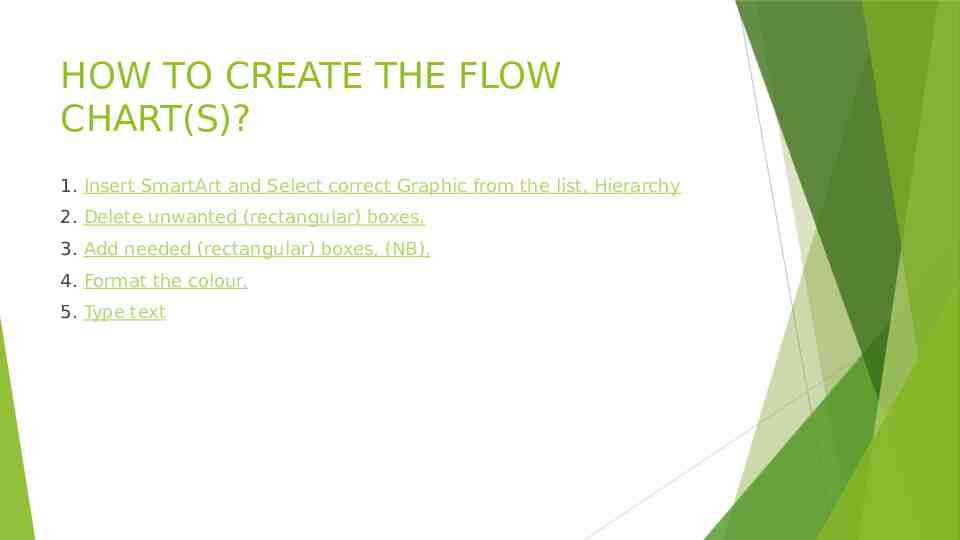
HOW TO CREATE THE FLOW CHART(S)? 1. Insert SmartArt and Select correct Graphic from the list, Hierarchy 2. Delete unwanted (rectangular) boxes. 3. Add needed (rectangular) boxes, (NB). 4. Format the colour. 5. Type text
INFORMATION PROCESSING EXERCISES(TOPIC 9) FLOW CHART(S) Exercise 9.1 p169 Exercise 9.2 p170 Exercise 9.5 p173