The National Survey on Drug Use and Health: 2017 Elinore F.
53 Slides5.54 MB
The National Survey on Drug Use and Health: 2017 Elinore F. McCance-Katz MD, PhD Assistant Secretary for Mental Health and Substance Use Substance Abuse and Mental Health Services Administration U.S. Department of Health and Human Services 1
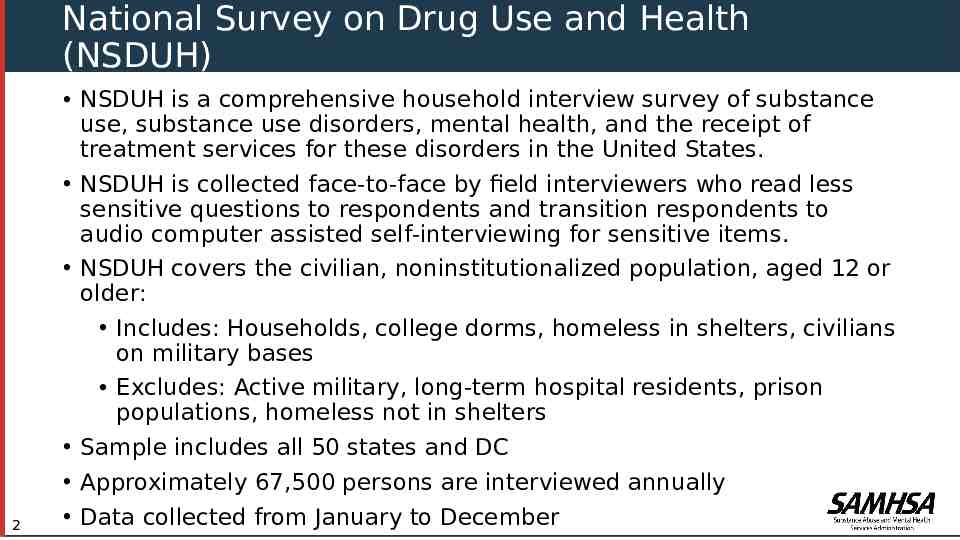
National Survey on Drug Use and Health (NSDUH) NSDUH is a comprehensive household interview survey of substance use, substance use disorders, mental health, and the receipt of treatment services for these disorders in the United States. NSDUH is collected face-to-face by field interviewers who read less sensitive questions to respondents and transition respondents to audio computer assisted self‑interviewing for sensitive items. NSDUH covers the civilian, noninstitutionalized population, aged 12 or older: Includes: Households, college dorms, homeless in shelters, civilians on military bases Excludes: Active military, long-term hospital residents, prison populations, homeless not in shelters Sample includes all 50 states and DC 2 Approximately 67,500 persons are interviewed annually Data collected from January to December
How Do We Use NSDUH? Provides a window into the state of substance use and mental health issues in the United States Helps to guide policy directions: problem substances prevalence of mental illness intersection of substance use and mental health issues provides insights in context of data from other agencies where should resources be directed? 3
NSDUH 2016 Highlights Opioids epidemic: Increasing heroin use in context of continuing prescription opioid misuse (4.4% of Americans over age 12) Disproportionate increase in drug overdose deaths associated with opioids and with heroin use (CDC data) related to synthetic opioids mixed into heroin (e.g.: fentanyl) Increases in serious mental illness, suicidality in transitional age youth Major gaps in treatment received by affected individuals 4
SAMHSA’s Response to NSDUH Findings 2018: Launch of new approach to technical assistance and training Previous focus on technical assistance to grantees expanded to national approach Establishment of Clinical Support System for Serious Mental Illness National practitioner training efforts Focus on appropriate use and monitoring of psychotropic medications Use of clozapine in treatment refractory schizophrenia Assisted outpatient treatment Establishment of national system of Technology Transfer Centers Substance Abuse Prevention Technology Transfer Centers Addiction Technology Transfer Centers Mental Health Technology Transfer Centers Training and technical assistance tailored to needs of HHS regions Native American/Alaska Native, Hispanic/Latino focus centers 5
SAMHSA’s Response to NSDUH Findings New Approaches Simplified grant application process to encourage greater community participation 3,294 applications received to-date compared to total of 1,360 last year Opioids Programs Establishment of STR TA/T program in the states to address opioids crisis training needs Offender Re-entry program: grantees can provide services prior to release Young children mental health services program: now serves children exposed to substances in utero who develop behavioral health issues New Certified Community Behavioral Health Clinics providing emergency care and integrated services 6
SAMHSA’s Response to NSDUH Findings Continue to monitor status of mental health and substance use issues Use of data to make needed adjustments to funding areas and interventions Continue to develop products to serve Americans living with mental and substance use disorders and their families Use of national epidemiologic data to guide policy decisions that will improve outcomes related to mental and substance use disorders in the United States 7
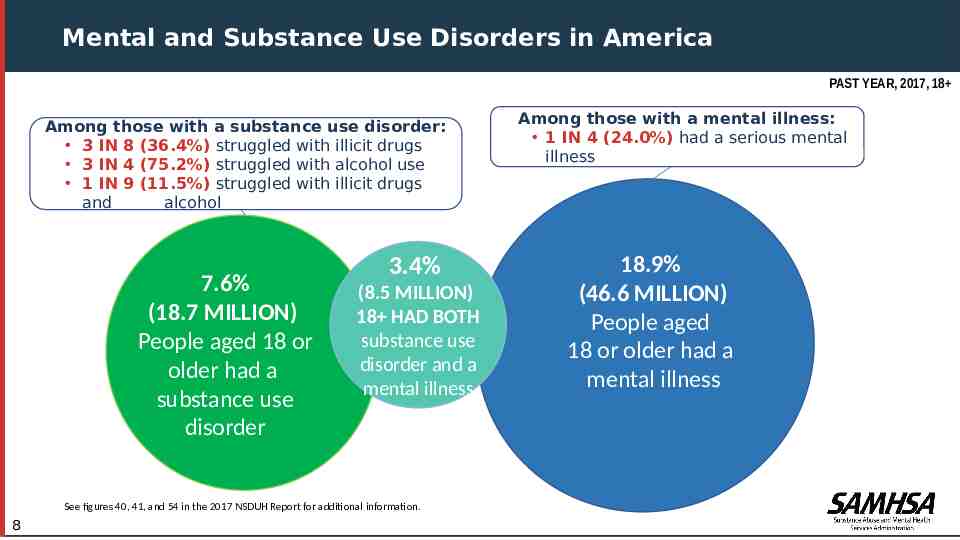
Mental and Substance Use Disorders in America PAST YEAR, 2017, 18 Among those with a substance use disorder: 3 IN 8 (36.4%) struggled with illicit drugs 3 IN 4 (75.2%) struggled with alcohol use 1 IN 9 (11.5%) struggled with illicit drugs and alcohol 7.6% (18.7 MILLION) People aged 18 or older had a substance use disorder 3.4% (8.5 MILLION) 18 HAD BOTH substance use disorder and a mental illness See figures 40, 41, and 54 in the 2017 NSDUH Report for additional information. 8 Among those with a mental illness: 1 IN 4 (24.0%) had a serious mental illness 18.9% (46.6 MILLION) .3% People aged 18 or older had a .2% mental illness .4%
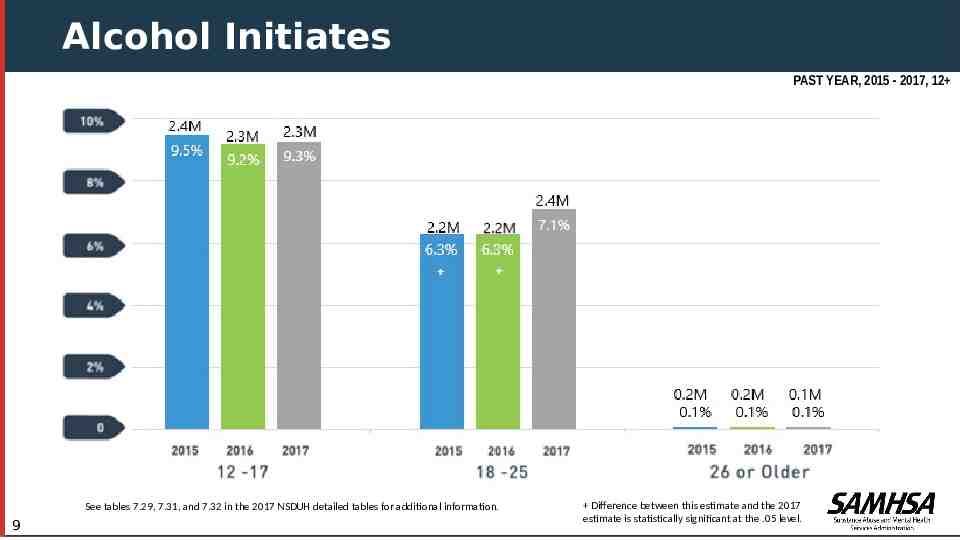
Alcohol Initiates PAST YEAR, 2015 - 2017, 12 See tables 7.29, 7.31, and 7.32 in the 2017 NSDUH detailed tables for additional information. 9 Difference between this estimate and the 2017 estimate is statistically significant at the .05 level.
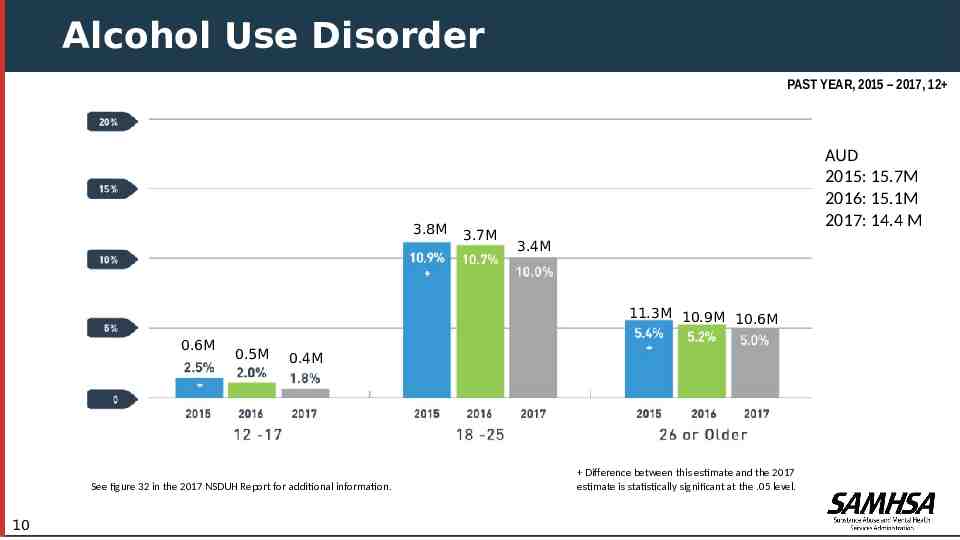
Alcohol Use Disorder PAST YEAR, 2015 – 2017, 12 3.8M 3.7M AUD 2015: 15.7M 2016: 15.1M 2017: 14.4 M 3.4M 11.3M 10.9M 10.6M 0.6M 0.5M 0.4M See figure 32 in the 2017 NSDUH Report for additional information. 10 Difference between this estimate and the 2017 estimate is statistically significant at the .05 level.
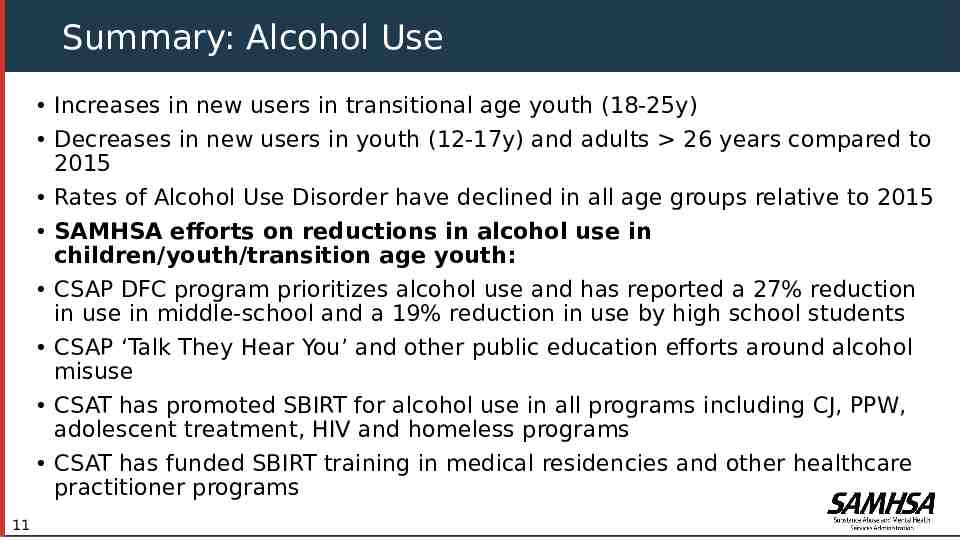
Summary: Alcohol Use Increases in new users in transitional age youth (18-25y) Decreases in new users in youth (12-17y) and adults 26 years compared to 2015 Rates of Alcohol Use Disorder have declined in all age groups relative to 2015 SAMHSA efforts on reductions in alcohol use in children/youth/transition age youth: CSAP DFC program prioritizes alcohol use and has reported a 27% reduction in use in middle-school and a 19% reduction in use by high school students CSAP ‘Talk They Hear You’ and other public education efforts around alcohol misuse CSAT has promoted SBIRT for alcohol use in all programs including CJ, PPW, adolescent treatment, HIV and homeless programs CSAT has funded SBIRT training in medical residencies and other healthcare practitioner programs 11
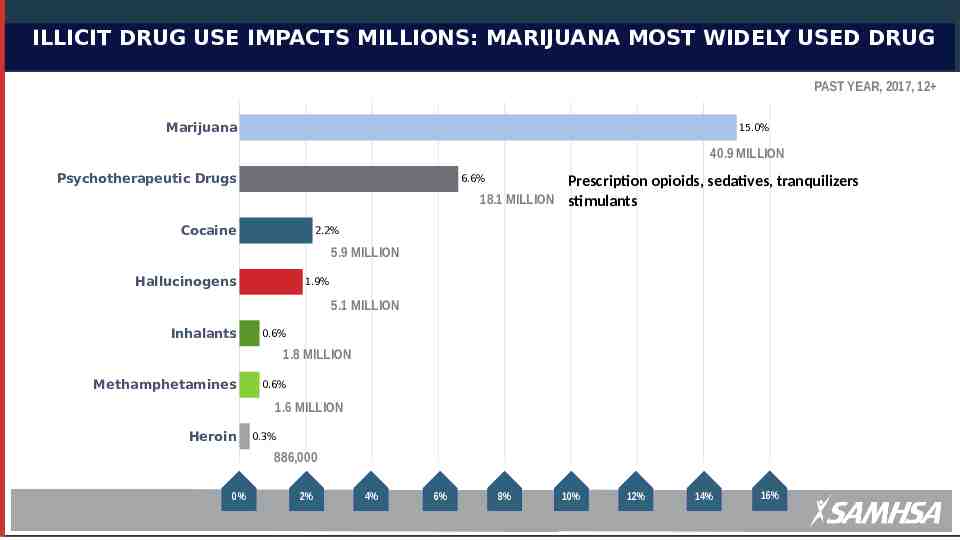
ILLICIT DRUG USE IMPACTS MILLIONS: MARIJUANA MOST WIDELY USED DRUG PAST YEAR, 2017, 12 Marijuana 15.0% 40.9 MILLION Psychotherapeutic Drugs 6.6% Prescription opioids, sedatives, tranquilizers 18.1 MILLION stimulants Cocaine 2.2% 5.9 MILLION 20.1 Hallucinogens MILLION .4% 1.9% .3% 5.1 MILLION People aged 12 or older had a substance 0.6% Inhalants use disorder 1.8 MILLION Methamphetamines .2% 0.6% 1.6 MILLION Heroin 0.3% 886,000 0% 12 2% 4% 6% 8% 10% 12% 14% 16%
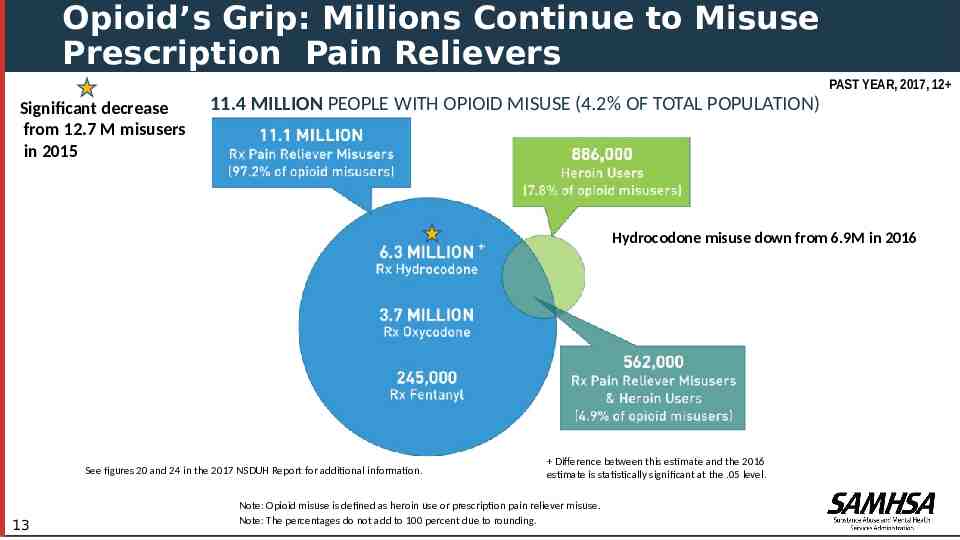
Opioid’s Grip: Millions Continue to Misuse Prescription Pain Relievers PAST YEAR, 2017, 12 Significant decrease from 12.7 M misusers in 2015 11.4 MILLION PEOPLE WITH OPIOID MISUSE (4.2% OF TOTAL POPULATION) Hydrocodone misuse down from 6.9M in 2016 See figures 20 and 24 in the 2017 NSDUH Report for additional information. 13 Difference between this estimate and the 2016 estimate is statistically significant at the .05 level. Note: Opioid misuse is defined as heroin use or prescription pain reliever misuse. Note: The percentages do not add to 100 percent due to rounding.
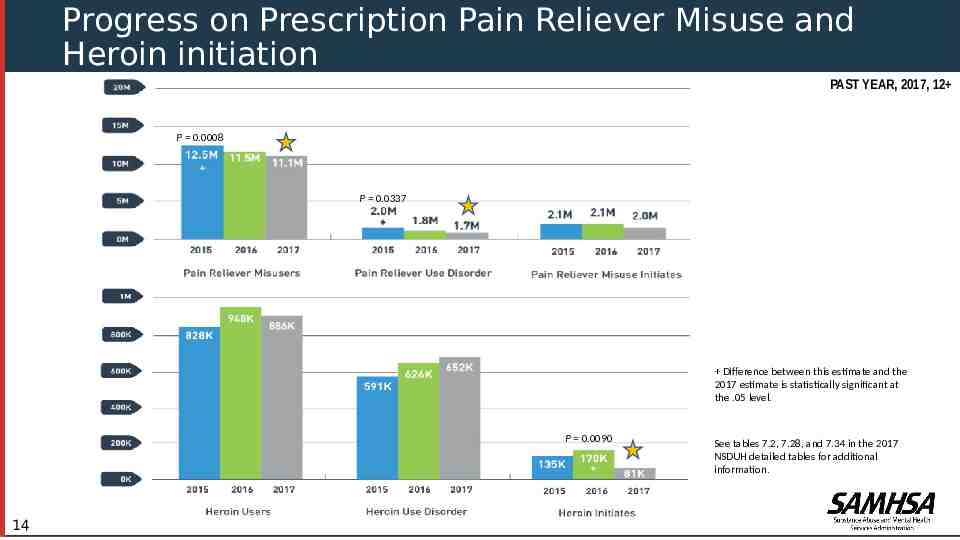
Progress on Prescription Pain Reliever Misuse and Heroin initiation PAST YEAR, 2017, 12 P 0.0008 P 0.0337 Difference between this estimate and the 2017 estimate is statistically significant at the .05 level. P 0.0090 14 See tables 7.2, 7.28, and 7.34 in the 2017 NSDUH detailed tables for additional information.
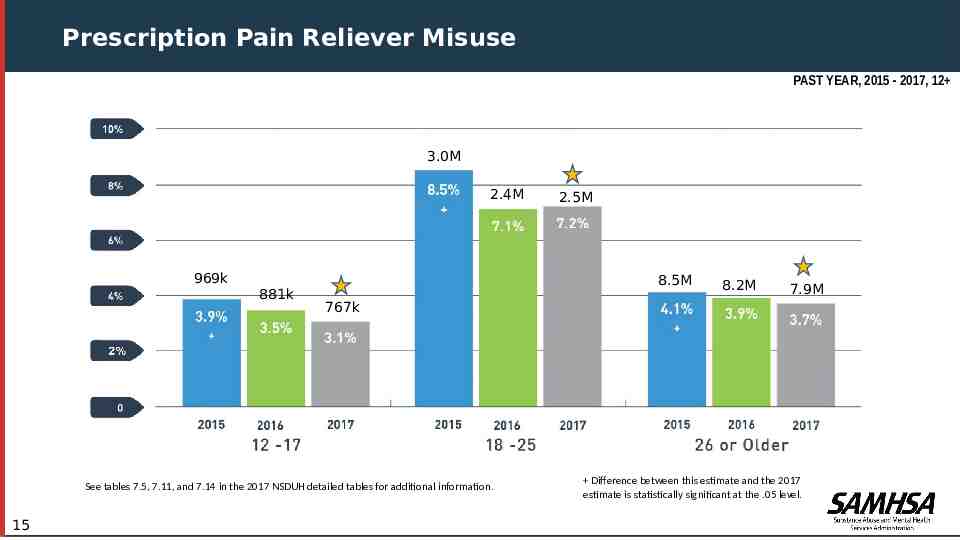
Prescription Pain Reliever Misuse PAST YEAR, 2015 - 2017, 12 3.0M 2.4M 969k 881k 8.5M 8.2M 7.9M 767k See tables 7.5, 7.11, and 7.14 in the 2017 NSDUH detailed tables for additional information. 15 2.5M Difference between this estimate and the 2017 estimate is statistically significant at the .05 level.
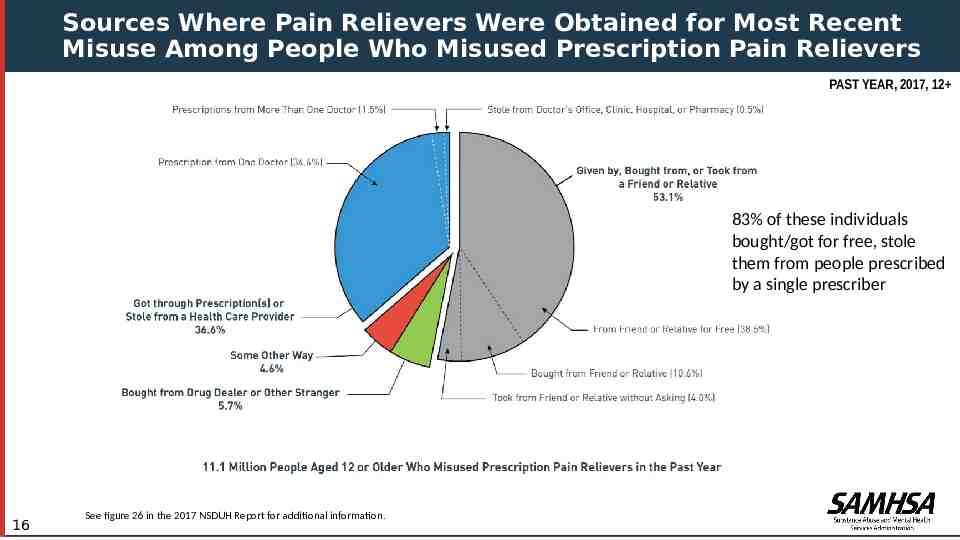
Sources Where Pain Relievers Were Obtained for Most Recent Misuse Among People Who Misused Prescription Pain Relievers PAST YEAR, 2017, 12 83% of these individuals bought/got for free, stole them from people prescribed by a single prescriber 16 See figure 26 in the 2017 NSDUH Report for additional information.
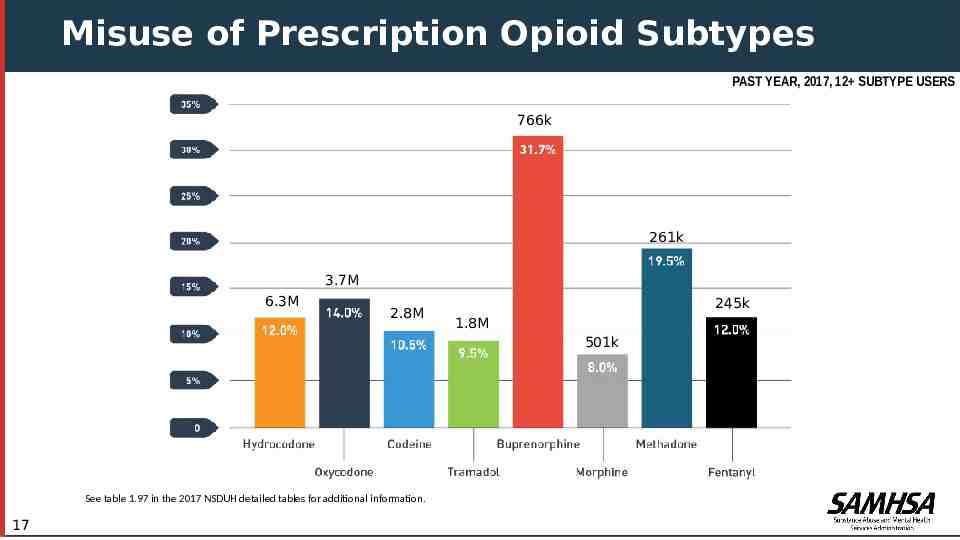
Misuse of Prescription Opioid Subtypes PAST YEAR, 2017, 12 SUBTYPE USERS 766k 261k 3.7M 6.3M 2.8M 245k 1.8M 501k See table 1.97 in the 2017 NSDUH detailed tables for additional information. 17
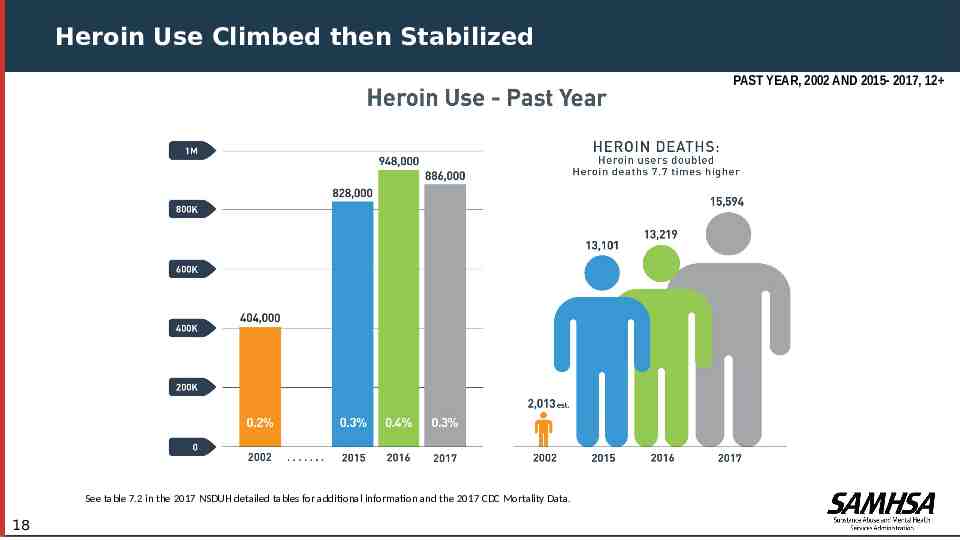
Heroin Use Climbed then Stabilized PAST YEAR, 2002 AND 2015- 2017, 12 See table 7.2 in the 2017 NSDUH detailed tables for additional information and the 2017 CDC Mortality Data. 18
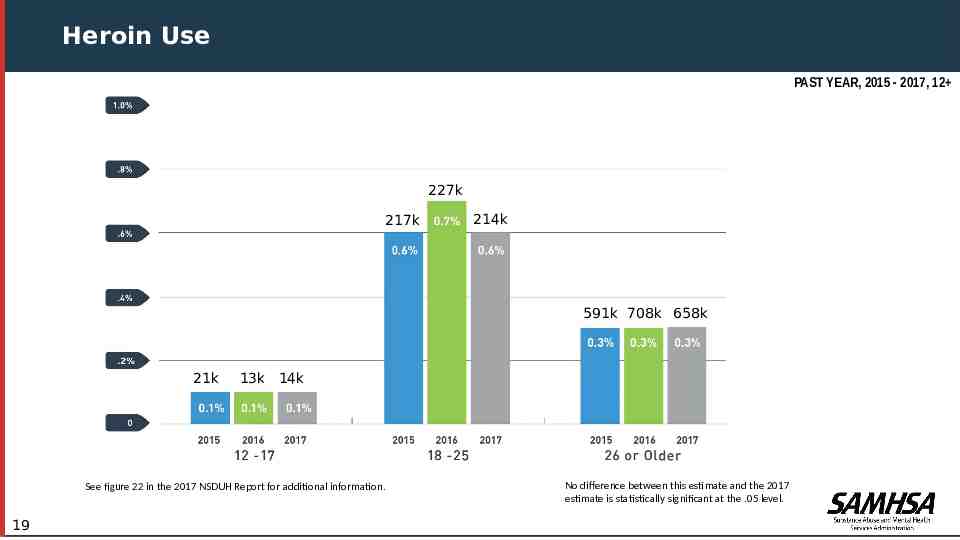
Heroin Use PAST YEAR, 2015 - 2017, 12 227k 217k 214k 591k 708k 658k 21k 13k 14k See figure 22 in the 2017 NSDUH Report for additional information. 19 No difference between this estimate and the 2017 estimate is statistically significant at the .05 level.
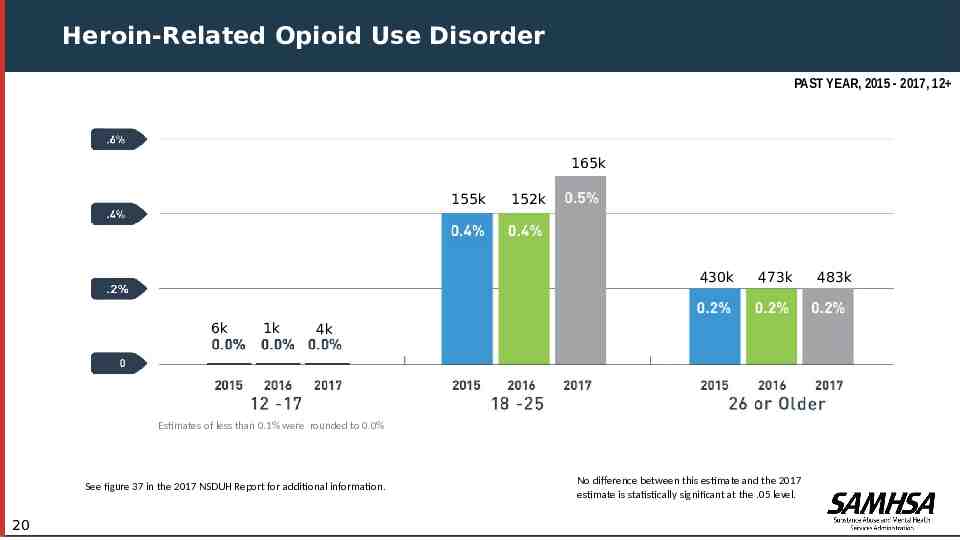
Heroin-Related Opioid Use Disorder PAST YEAR, 2015 - 2017, 12 165k 155k 152k 430k 6k 1k 473k 4k Estimates of less than 0.1% were rounded to 0.0% See figure 37 in the 2017 NSDUH Report for additional information. 20 No difference between this estimate and the 2017 estimate is statistically significant at the .05 level. 483k
Summary Prescription opioids still with high rates of misuse/abuse Obtained from friends/relatives and from healthcare provider/prescriber Significant decrease in prescription opioid abuse from 2015 Buprenorphine has highest rate of misuse New users of heroin decreased dramatically in 2017 Despite modest decline in heroin users continued increase in deaths 21
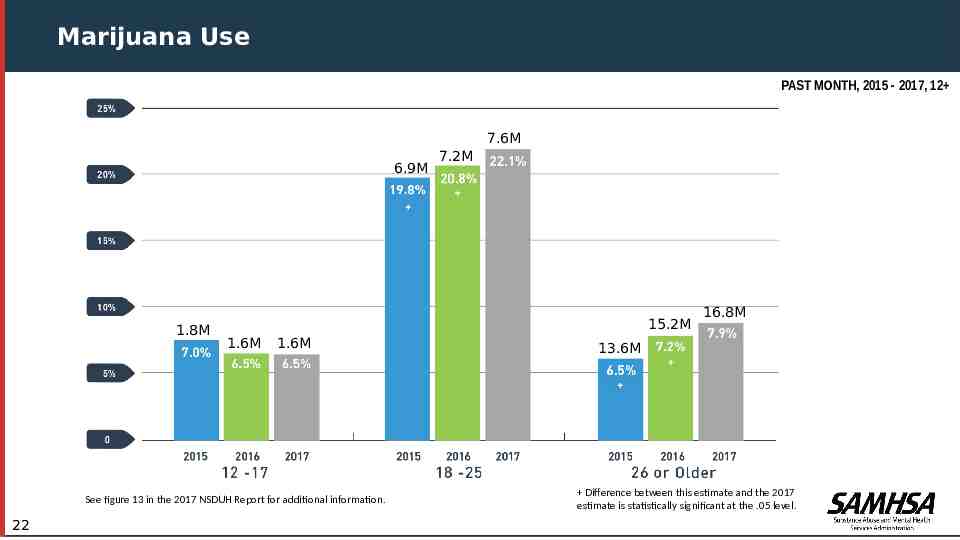
Marijuana Use PAST MONTH, 2015 - 2017, 12 7.6M 6.9M 1.8M 15.2M 1.6M 1.6M See figure 13 in the 2017 NSDUH Report for additional information. 22 7.2M 16.8M 13.6M Difference between this estimate and the 2017 estimate is statistically significant at the .05 level.
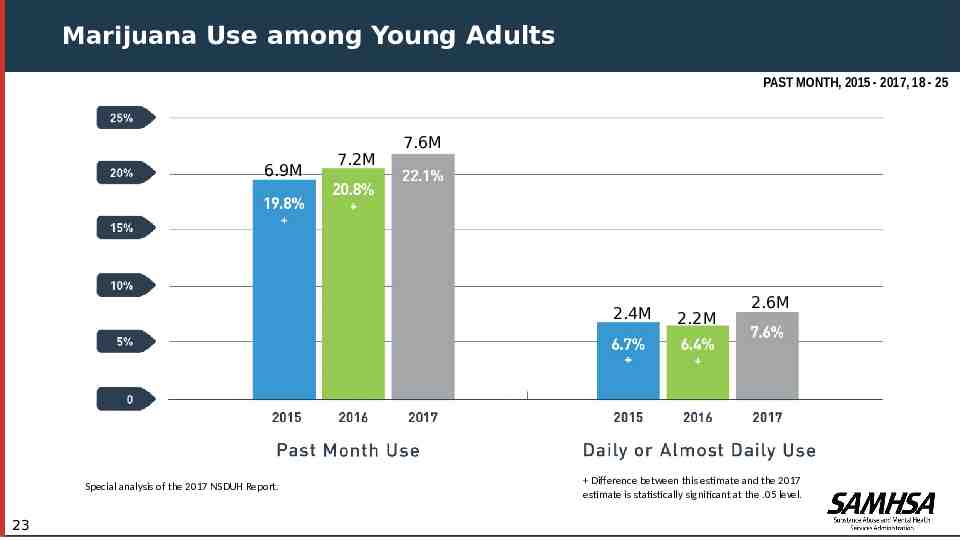
Marijuana Use among Young Adults PAST MONTH, 2015 - 2017, 18 - 25 6.9M 7.2M 7.6M 2.4M 2.2M 2.6M Difference between this Special analysis of the 2017 NSDUH Report. 23 Difference between this estimate and the 2017 estimate is statistically significant at the .05 level. estimate and the 2017 estimate is statistically significant at the .05 level.
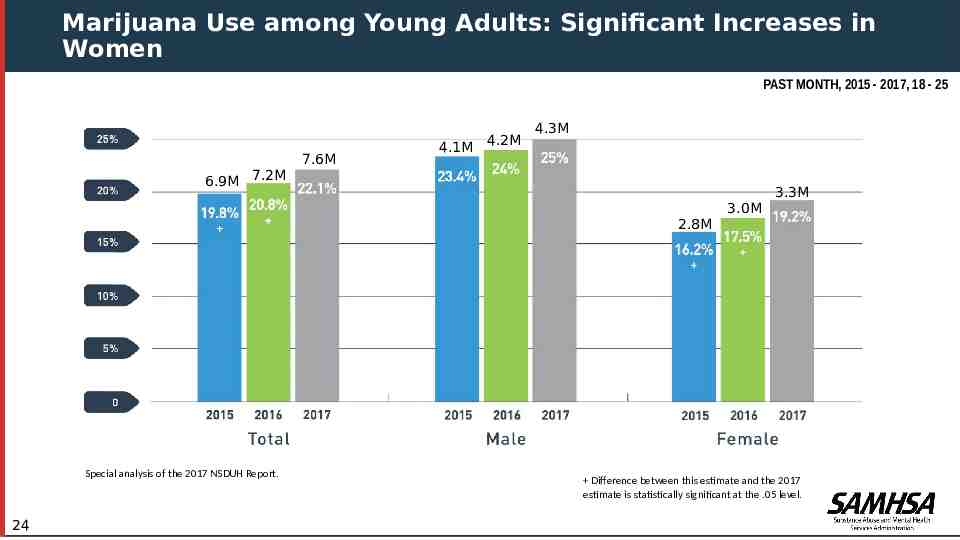
Marijuana Use among Young Adults: Significant Increases in Women PAST MONTH, 2015 - 2017, 18 - 25 6.9M 7.2M 7.6M 4.1M 4.2M 4.3M 3.3M 2.8M 3.0M Difference between this Special analysis of the 2017 NSDUH Report. 24 Difference between this estimate and the 2017 estimate is statistically significant at the .05 level. estimate and the 2017 estimate is statistically significant at the .05 level.
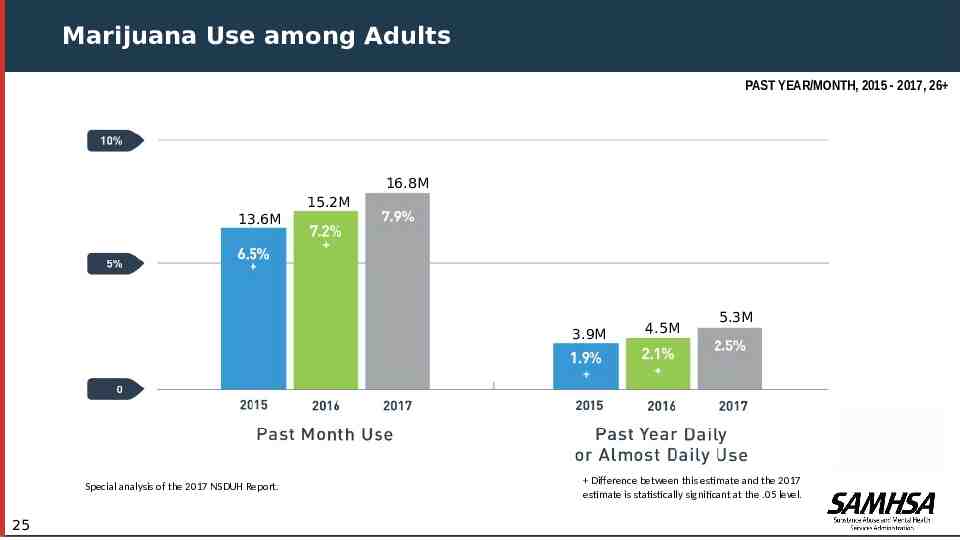
Marijuana Use among Adults PAST YEAR/MONTH, 2015 - 2017, 26 16.8M 15.2M 13.6M 3.9M 4.5M 5.3M Difference between this Special analysis of the 2017 NSDUH Report. 25 Difference between this estimate and the 2017 estimate is statistically significant at the .05 level. estimate and the 2017 estimate is statistically significant at the .05 level.
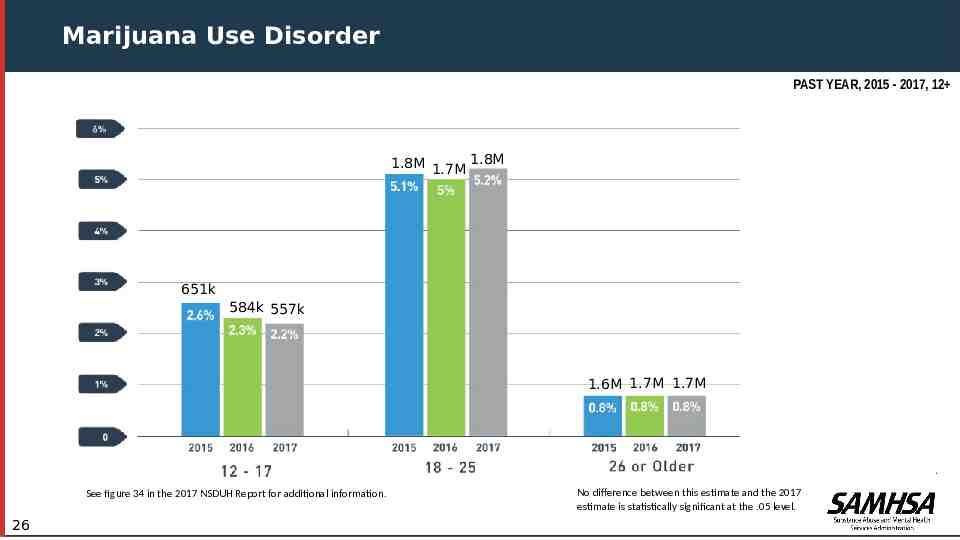
Marijuana Use Disorder PAST YEAR, 2015 - 2017, 12 1.8M 1.7M 1.8M 651k 584k 557k 1.6M 1.7M 1.7M Difference between this estimate and the 2017 estimate is statistically significant at the .05 level. See figure 34 in the 2017 NSDUH Report for additional information . 26 No difference between this estimate and the 2017 estimate is statistically significant at the .05 level.
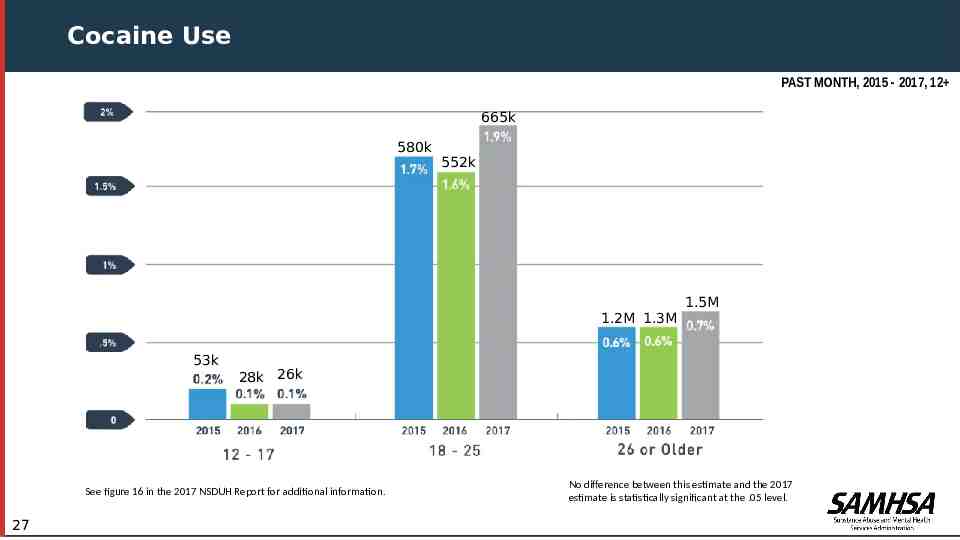
Cocaine Use PAST MONTH, 2015 - 2017, 12 665k 580k 552k 1.2M 1.3M 53k 1.5M 28k 26k Difference between this estimate and the 2017 estimate is statistically significant at the .05 level. See figure 16 in the 2017 NSDUH Report for additional information . 27 No difference between this estimate and the 2017 estimate is statistically significant at the .05 level.
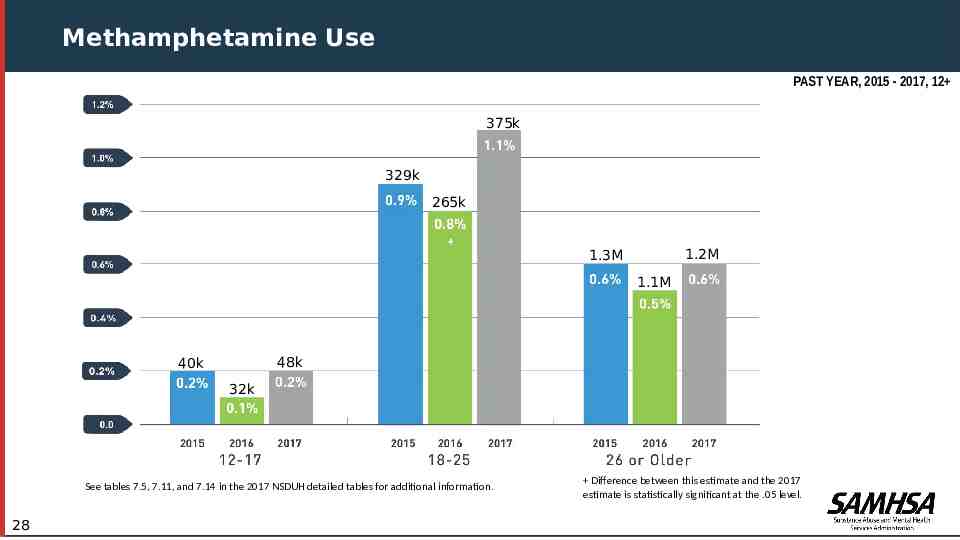
Methamphetamine Use PAST YEAR, 2015 - 2017, 12 375k 329k 265k 1.2M 1.3M 1.1M 48k 40k 32k See tables 7.5, 7.11, and 7.14 in the 2017 NSDUH detailed tables for additional information. 28 Difference between this estimate and the 2017 estimate is statistically significant at the .05 level.
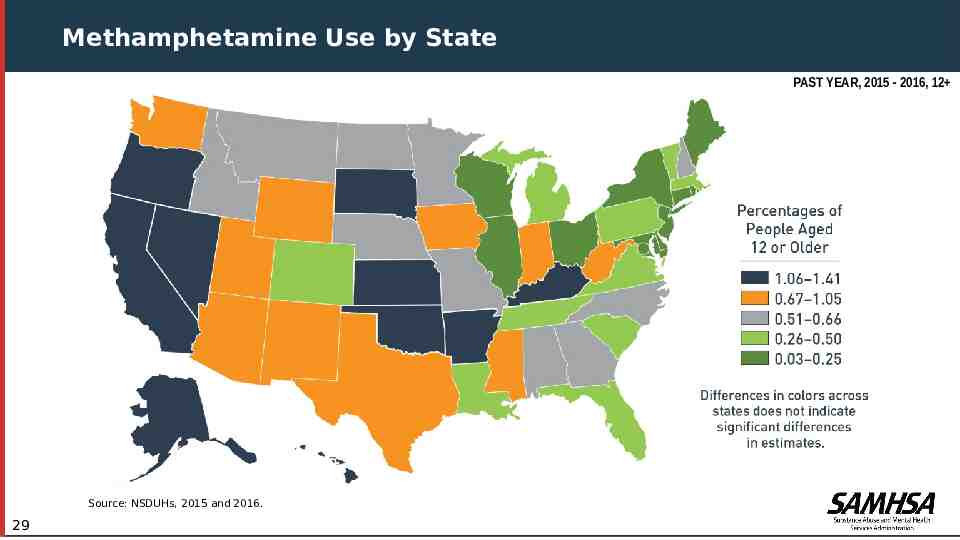
Methamphetamine Use by State PAST YEAR, 2015 - 2016, 12 Source: NSDUHs, 2015 and 2016. 29
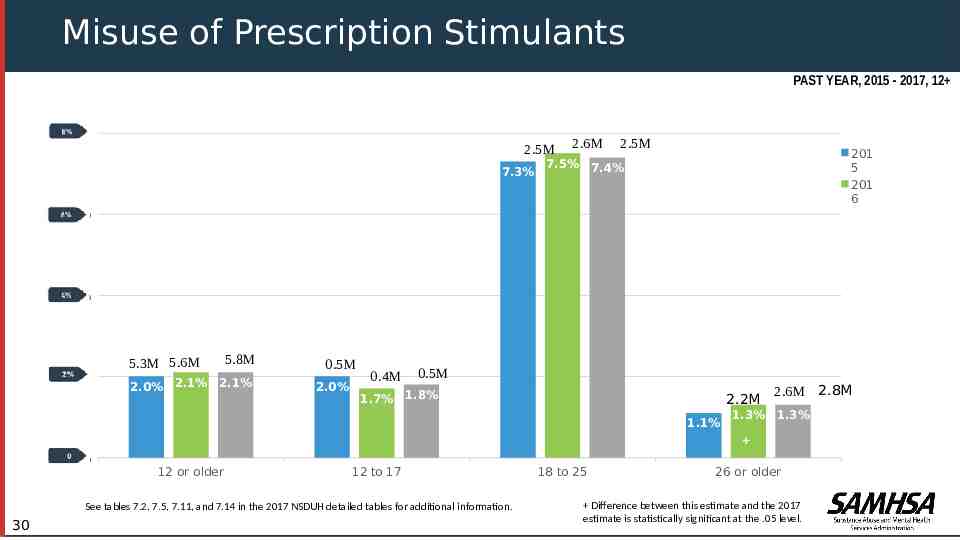
Misuse of Prescription Stimulants PAST YEAR, 2015 - 2017, 12 8% 2.5M 2.6M 2.5M 201 5 201 6 7.5% 7.4% 7.3% 6% 4% 2% 5.3M 5.6M 5.8M 2.0% 2.1% 2.1% 0.5M 2.0% 0.4M 0.5M 1.7% 1.8% 2.2M 1.1% 2.6M 2.8M 1.3% 1.3% 0% 12 or older 12 to 17 See tables 7.2, 7.5, 7.11, and 7.14 in the 2017 NSDUH detailed tables for additional information. 30 18 to 25 26 or older Difference between this estimate and the 2017 estimate is statistically significant at the .05 level.
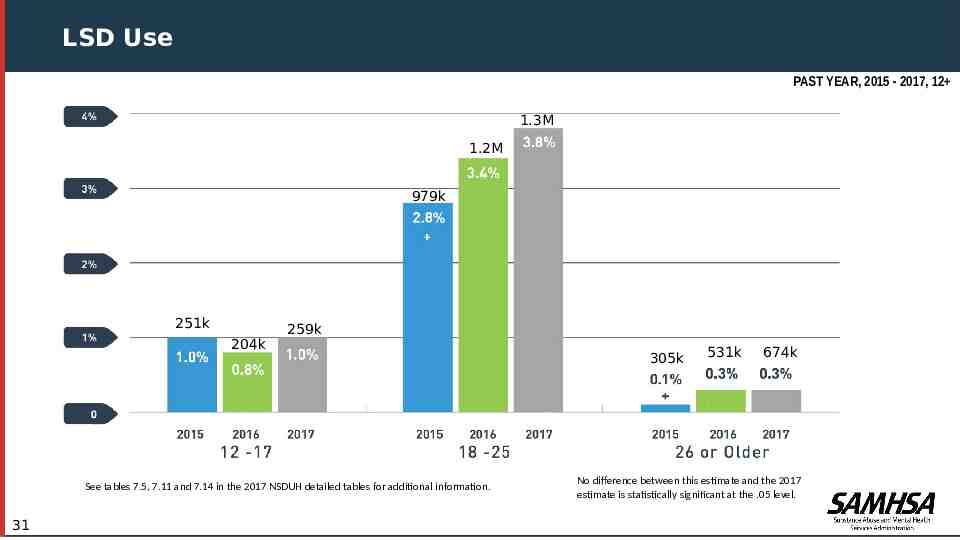
LSD Use PAST YEAR, 2015 - 2017, 12 1.3M 1.2M 979k 251k 204k 259k See tables 7.5, 7.11 and 7.14 in the 2017 NSDUH detailed tables for additional information. 31 305k 531k 674k No difference between this estimate and the 2017 estimate is statistically significant at the .05 level.
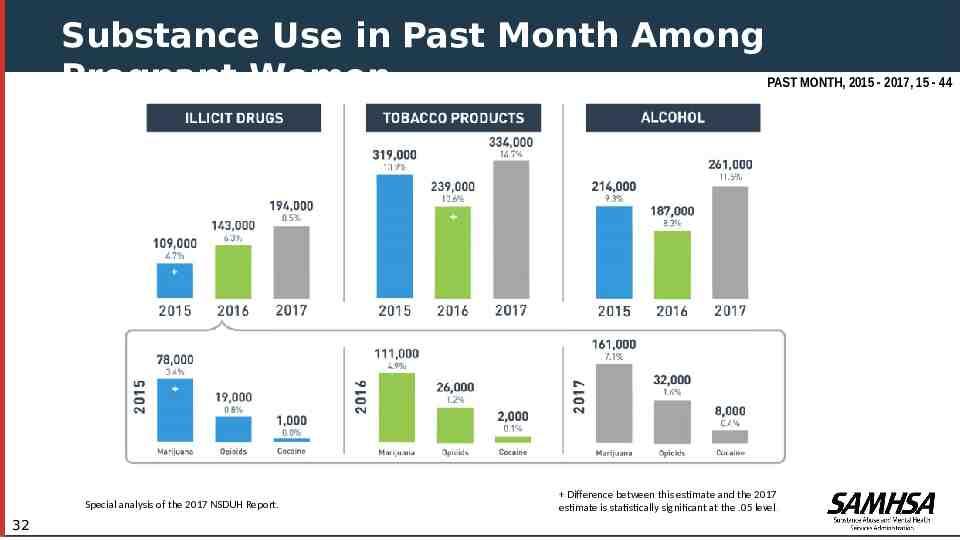
Substance Use in Past Month Among PAST MONTH, 2015 - 2017, 15 - 44 Pregnant Women Special analysis of the 2017 NSDUH Report. 32 Difference between this estimate and the 2017 estimate is statistically significant at the .05 level.
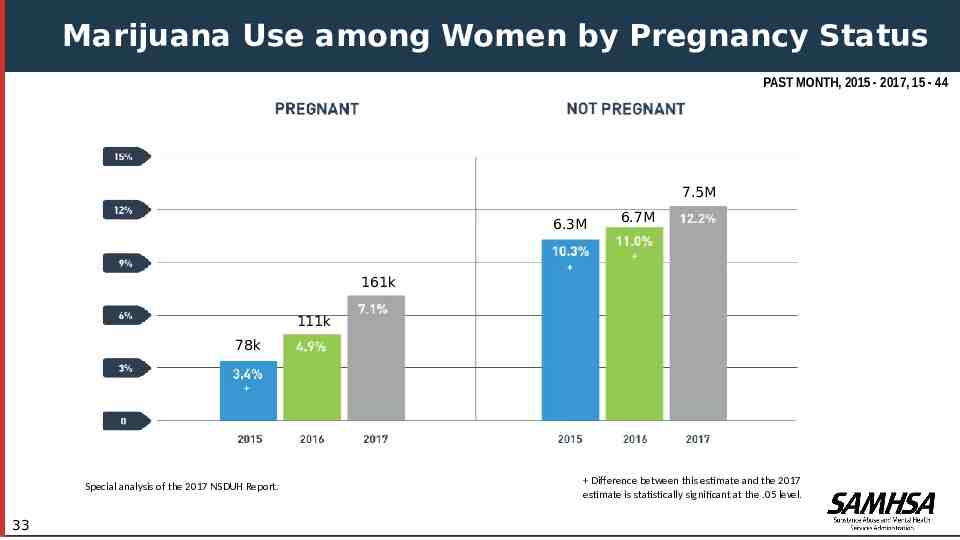
Marijuana Use among Women by Pregnancy Status PAST MONTH, 2015 - 2017, 15 - 44 7.5M 6.3M 6.7M 161k 111k 78k Special analysis of the 2017 NSDUH Report. 33 Difference between this estimate and the 2017 estimate is statistically significant at the .05 level.
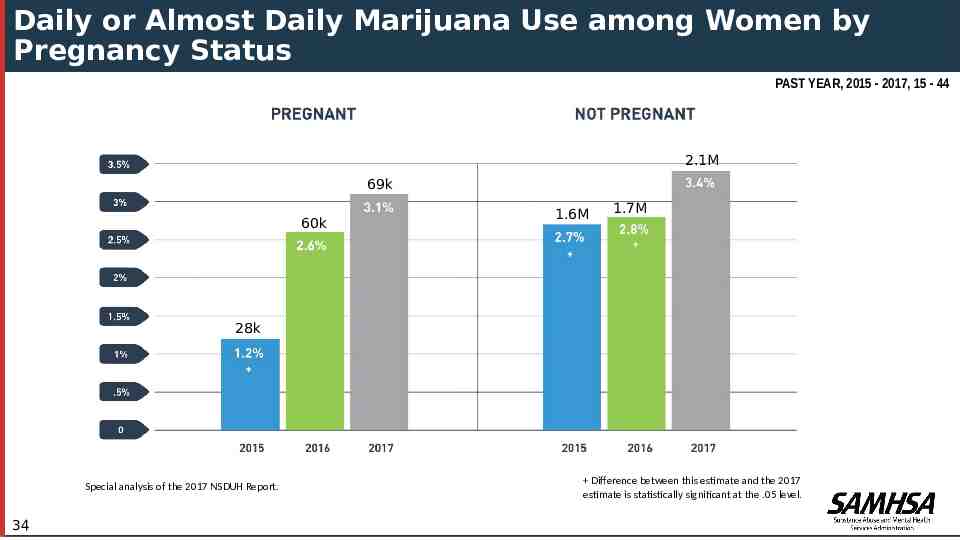
Daily or Almost Daily Marijuana Use among Women by Pregnancy Status PAST YEAR, 2015 - 2017, 15 - 44 2.1M 69k 60k 1.6M 1.7M 28k Special analysis of the 2017 NSDUH Report. 34 Difference between this estimate and the 2017 estimate is statistically significant at the .05 level.
Why is this Data Important? Marijuana and Pregnancy: may be associated with fetal growth restriction, stillbirth, and preterm birth; may cause problems with neurological development, resulting in hyperactivity, poor cognitive function (Metz TD and Stickrath EH, 2015) Adverse outcomes linked to marijuana use by youth: Poor school performance and increased drop out rates Chronic use in adolescence has been linked to decline in IQ that doesn’t recover with cessation (Meier et al. 2012) Marijuana use in adolescence is associated with an increased risk for later psychotic disorder in adulthood (D’Souza, et al. 2016) Marijuana use linked to earlier onset of psychosis in youth known to be at risk for schizophrenia (McHugh, et al. 2017) 35
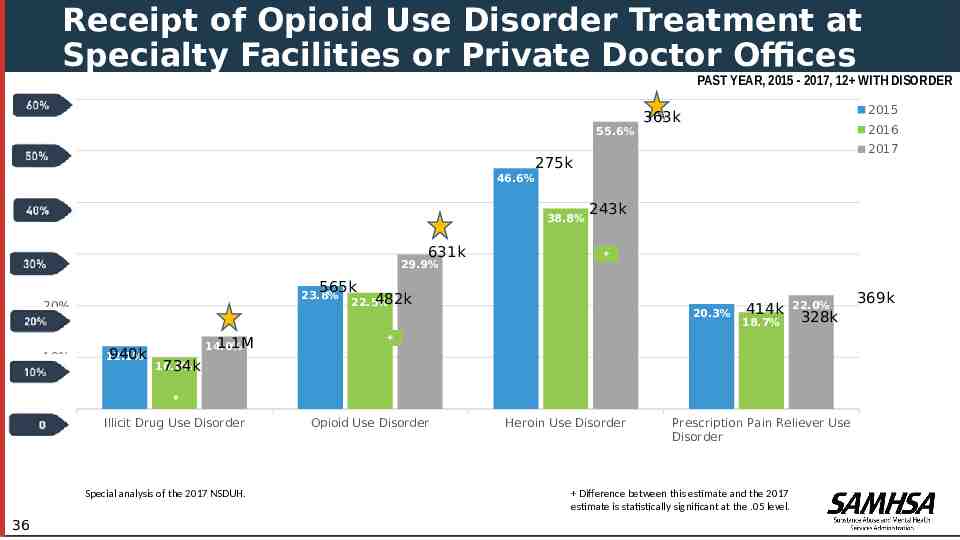
Receipt of Opioid Use Disorder Treatment at Specialty Facilities or Private Doctor Offices PAST YEAR, 2015 - 2017, 12 WITH DISORDER 60% 55.6% 50% 46.6% 2015 363k 2016 2017 275k 40% 38.8% 243k 631k 30% 29.9% 565k 23.8% 20% 10% 940k 12.1% 482k 22.5% 20.3% 414k 18.7% 22.0% 328k 1.1M 14.0% 10.0% 734k 0% Illicit Drug Use Disorder Special analysis of the 2017 NSDUH. 36 Opioid Use Disorder Heroin Use Disorder Prescription Pain Reliever Use Disorder Difference between this estimate and the 2017 estimate is statistically significant at the .05 level. 369k
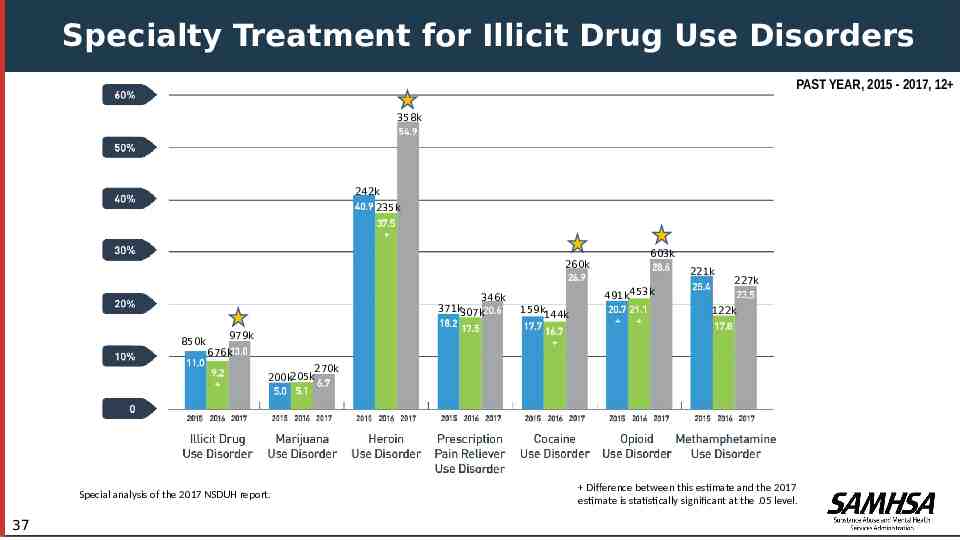
Specialty Treatment for Illicit Drug Use Disorders PAST YEAR, 2015 - 2017, 12 358k 242k 235k 260k 346k 371k307k 850k 603k 221k 491k453k 159k144k 227k 122k 979k 676k 270k 200k205k Special analysis of the 2017 NSDUH report. 37 Difference between this estimate and the 2017 estimate is statistically significant at the .05 level.
Summary Marijuana use increasing in adults with greatest increases seen in 18-25 year old women Significant increases in numbers of adults using marijuana daily or almost daily Pregnant women using substances in greater numbers including significant increases in daily or near daily marijuana use Cocaine use: numbers stable Methamphetamine use increasing in 18-25 year olds; state differences significant Significant increases in misuse of prescription stimulants accounted for mainly in age 26 , but continuing substantial misuse of prescription stimulants in 18-25 year olds LSD use increasing in adults with greatest use in 18-25 year olds Significant increases in numbers receiving treatment for substance use 38 disorders
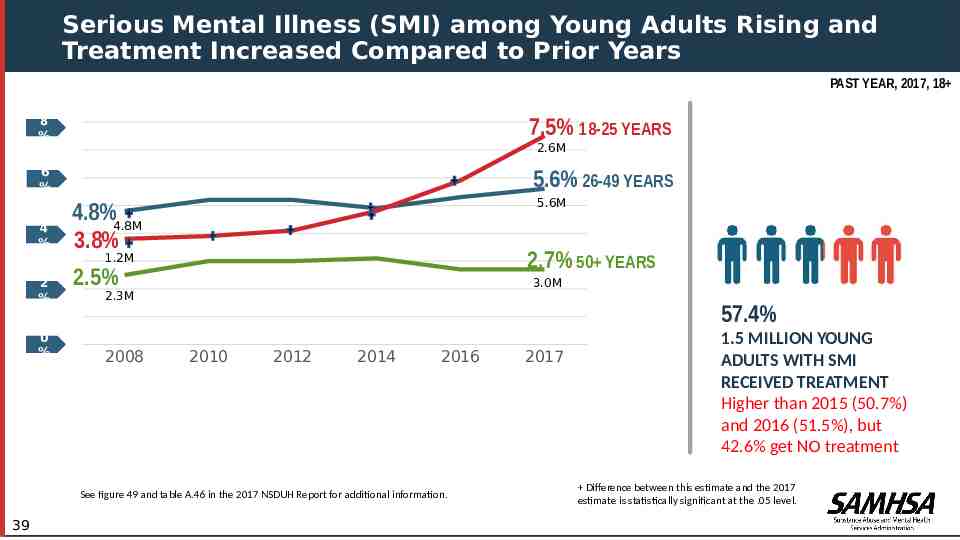
Serious Mental Illness (SMI) among Young Adults Rising and Treatment Increased Compared to Prior Years PAST YEAR, 2017, 18 8 % 7.5% 18-25 YEARS 6 % 5.6% 26-49 YEARS 4 % 2.6M 5.6M 4.8%4.8M 3.8% 2.7% 50 YEARS 1.2M 2 % 0 % 2.5% .3% 2008 2010 2012 2014 2016 2017 .2% See figure 49 and table A.46 in the 2017 NSDUH Report for additional information. 39 .4% 3.0M 2.3M 57.4% 1.5 MILLION YOUNG ADULTS WITH SMI RECEIVED TREATMENT Higher than 2015 (50.7%) and 2016 (51.5%), but 42.6% get NO treatment Difference between this estimate and the 2017 estimate is statistically significant at the .05 level.
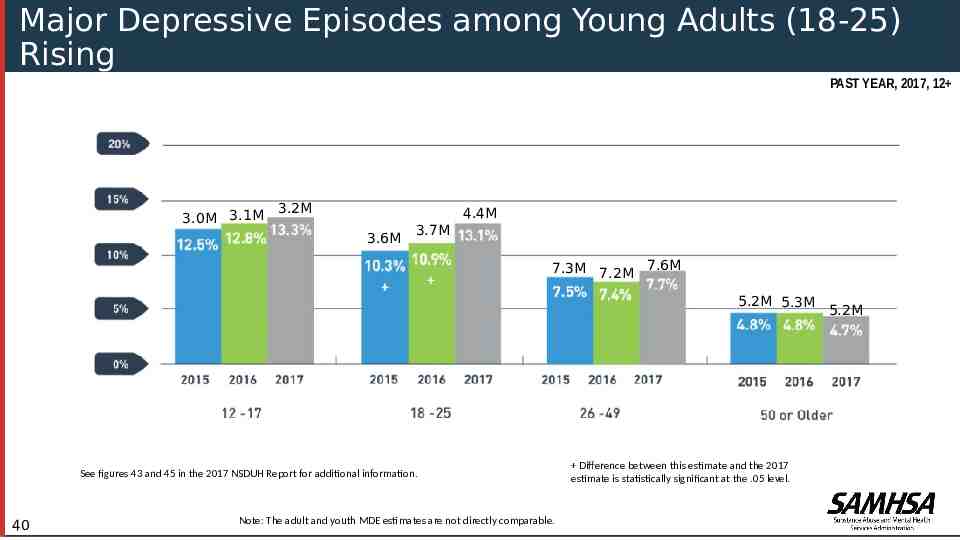
Major Depressive Episodes among Young Adults (18-25) Rising PAST YEAR, 2017, 12 3.0M 3.1M 3.2M 4.4M 3.6M 3.7M 7.3M 7.2M 7.6M 5.2M 5.3M See figures 43 and 45 in the 2017 NSDUH Report for additional information. 40 Note: The adult and youth MDE estimates are not directly comparable. Difference between this estimate and the 2017 estimate is statistically significant at the .05 level. 5.2M
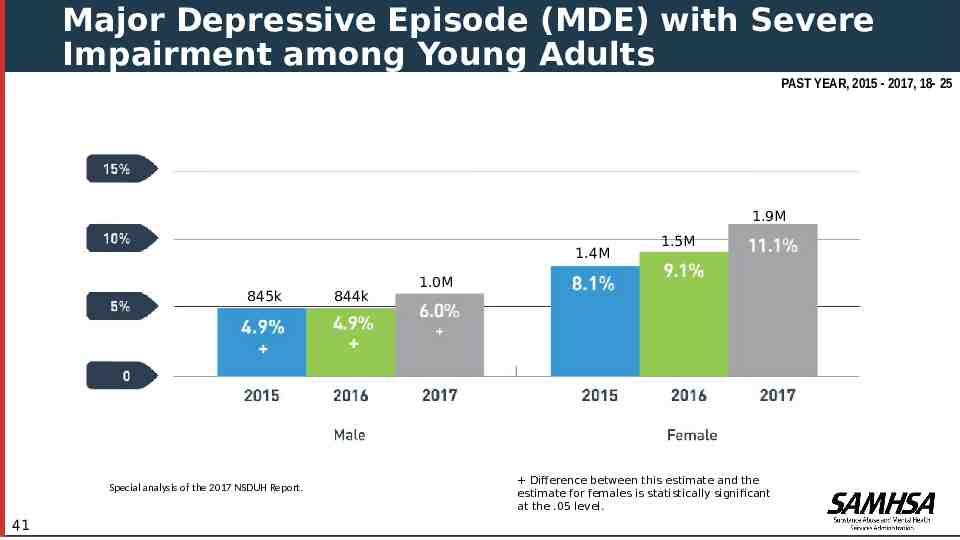
Major Depressive Episode (MDE) with Severe Impairment among Young Adults PAST YEAR, 2015 - 2017, 18- 25 1.9M 1.4M 845k Special analysis of the 2017 NSDUH Report. 41 844k 1.5M 1.0M Difference between this estimate and the estimate for females is statistically significant at the .05 level.
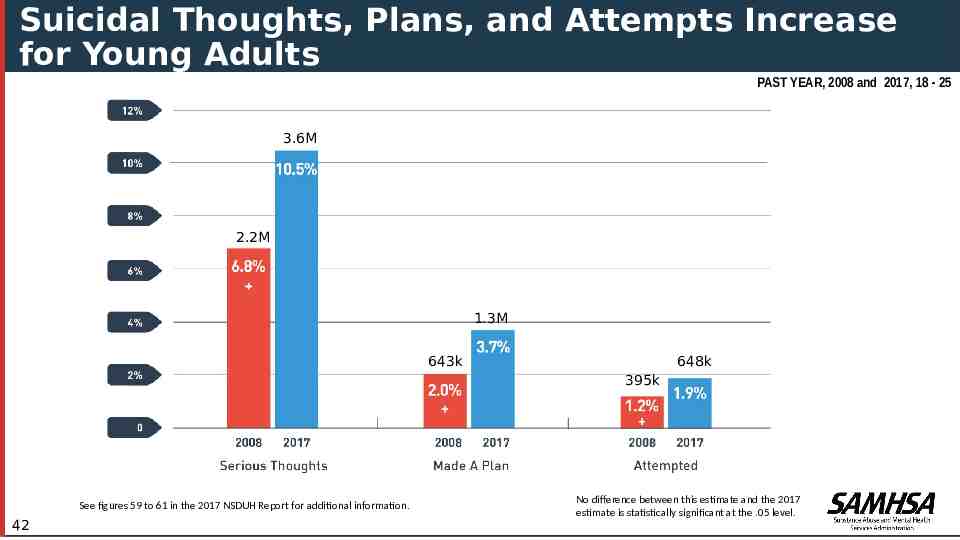
Suicidal Thoughts, Plans, and Attempts Increase for Young Adults PAST YEAR, 2008 and 2017, 18 - 25 3.6M 2.2M 1.3M 643k 648k 395k See figures 59 to 61 in the 2017 NSDUH Report for additional information. 42 No difference between this estimate and the 2017 estimate is statistically significant at the .05 level.
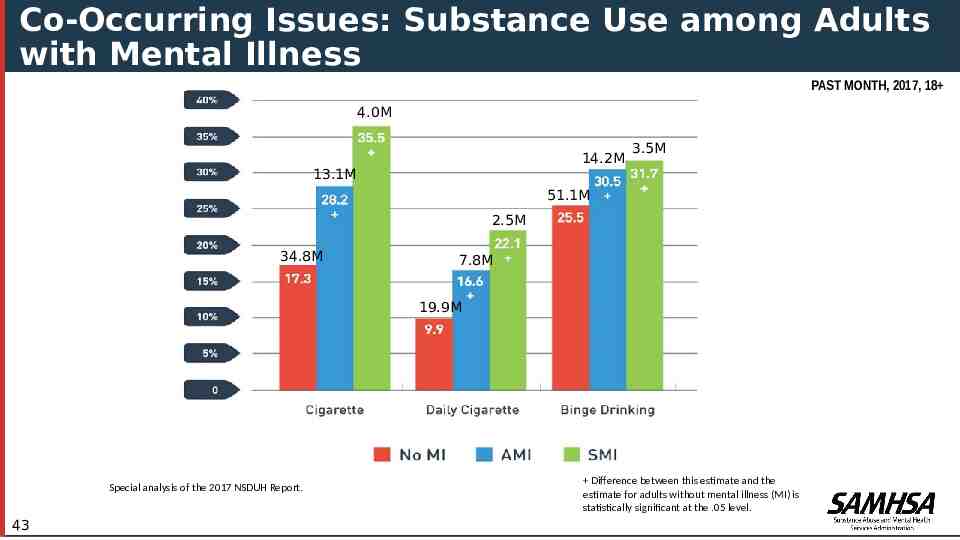
Co-Occurring Issues: Substance Use among Adults with Mental Illness PAST MONTH, 2017, 18 4.0M 14.2M 3.5M 13.1M 51.1M 2.5M 34.8M 7.8M 19.9M Special analysis of the 2017 NSDUH Report. 43 Difference between this estimate and the estimate for adults without mental illness (MI) is statistically significant at the .05 level.
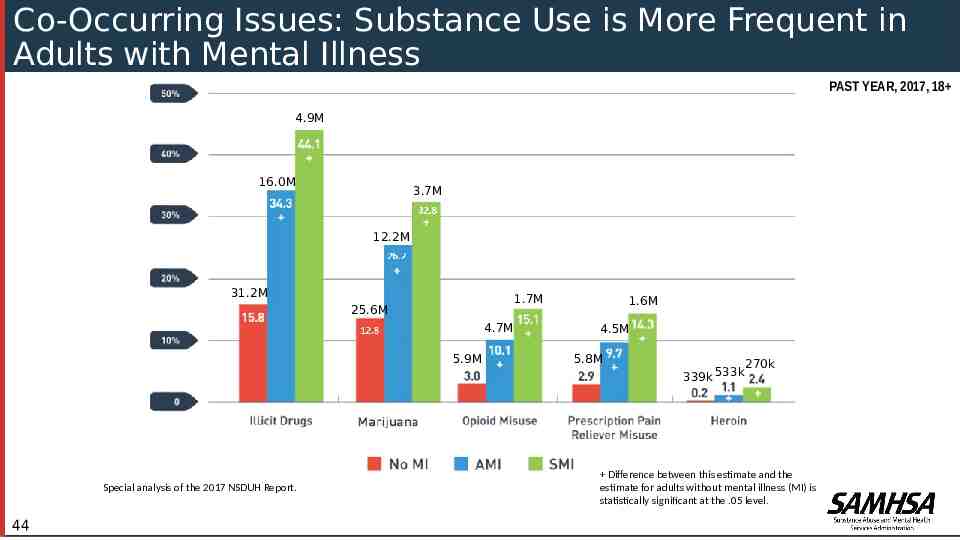
Co-Occurring Issues: Substance Use is More Frequent in Adults with Mental Illness PAST YEAR, 2017, 18 4.9M 16.0M 3.7M 12.2M 31.2M 1.7M 25.6M 4.7M 5.9M Special analysis of the 2017 NSDUH Report. 44 1.6M 4.5M 5.8M 339k 533k 270k Difference between this estimate and the estimate for adults without mental illness (MI) is statistically significant at the .05 level.
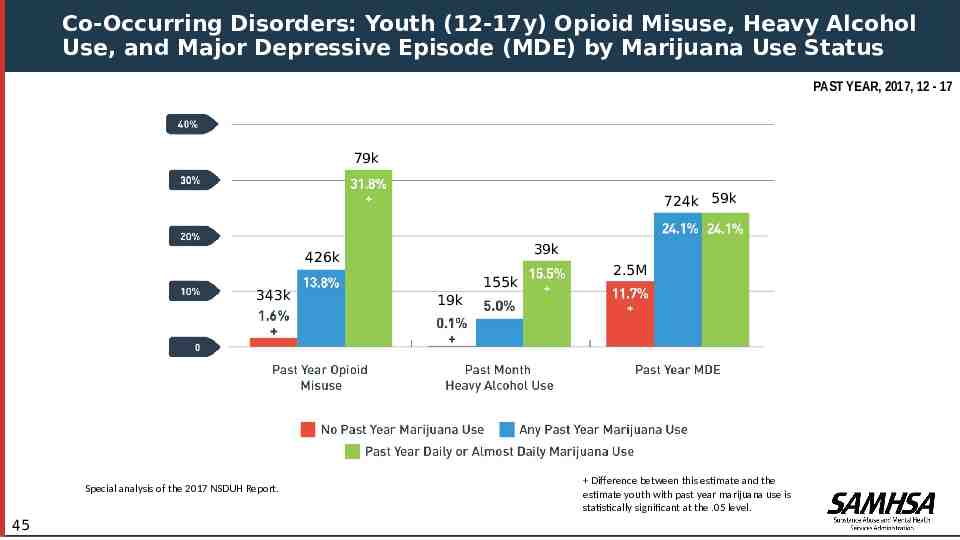
Co-Occurring Disorders: Youth (12-17y) Opioid Misuse, Heavy Alcohol Use, and Major Depressive Episode (MDE) by Marijuana Use Status PAST YEAR, 2017, 12 - 17 79k 724k 59k 39k 426k 343k Special analysis of the 2017 NSDUH Report. 45 155k 2.5M 19k Difference between this estimate and the estimate youth with past year marijuana use is statistically significant at the .05 level.
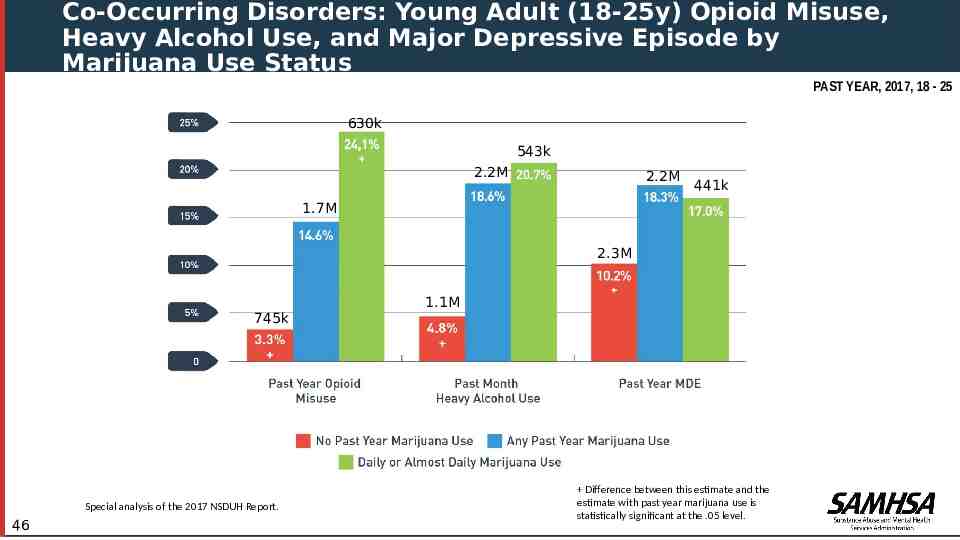
Co-Occurring Disorders: Young Adult (18-25y) Opioid Misuse, Heavy Alcohol Use, and Major Depressive Episode by Marijuana Use Status PAST YEAR, 2017, 18 - 25 630k 543k 2.2M 2.2M 441k 1.7M 2.3M 745k Special analysis of the 2017 NSDUH Report. 46 1.1M Difference between this estimate and the estimate with past year marijuana use is statistically significant at the .05 level.
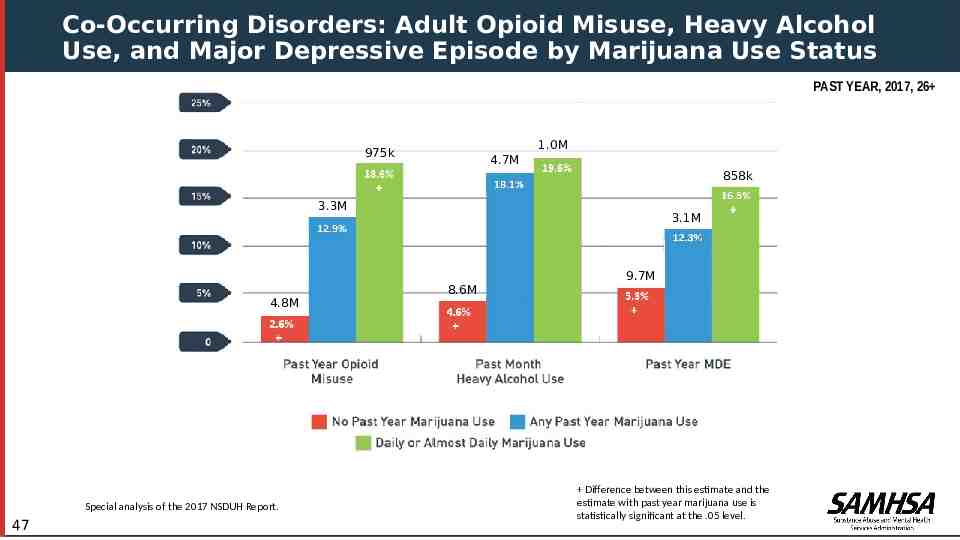
Co-Occurring Disorders: Adult Opioid Misuse, Heavy Alcohol Use, and Major Depressive Episode by Marijuana Use Status PAST YEAR, 2017, 26 1.0M 975k 4.7M 858k 3.3M 3.1M 9.7M 4.8M Special analysis of the 2017 NSDUH Report. 47 8.6M Difference between this estimate and the estimate with past year marijuana use is statistically significant at the .05 level.
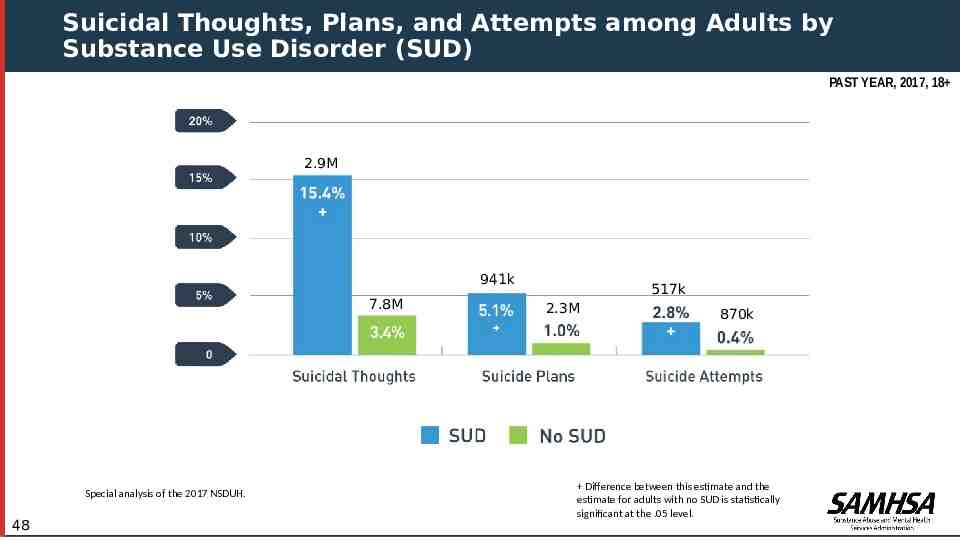
Suicidal Thoughts, Plans, and Attempts among Adults by Substance Use Disorder (SUD) PAST YEAR, 2017, 18 2.9M 941k 7.8M Special analysis of the 2017 NSDUH. 48 517k 2.3M 870k Difference between this estimate and the estimate for adults with no SUD is statistically significant at the .05 level.
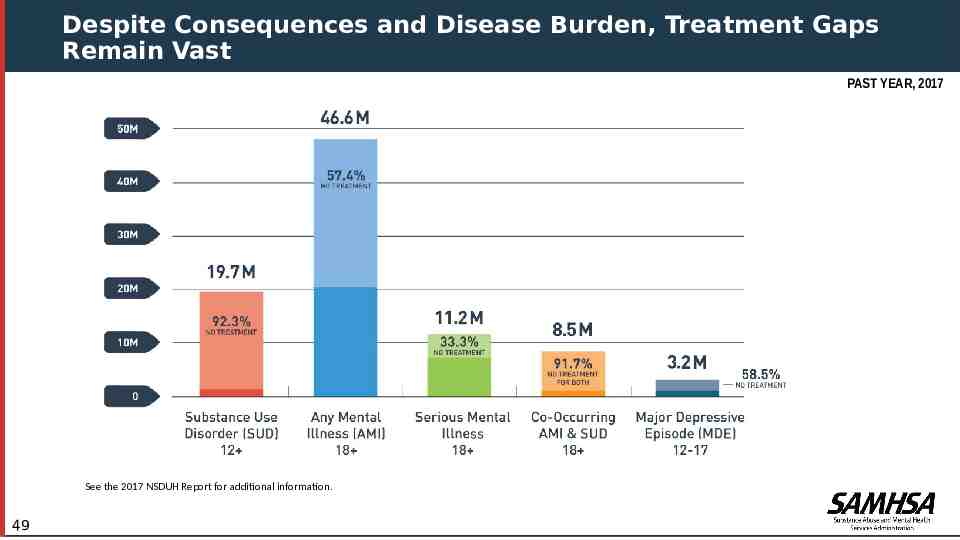
Despite Consequences and Disease Burden, Treatment Gaps Remain Vast PAST YEAR, 2017 See the 2017 NSDUH Report for additional information. 49
Summary Transitional age youth (18-25 y) have increasing rates of serious mental illness, major depression, and suicidality. Co-occurring substance use and mental disorders are common. Frequent marijuana use is associated with opioid misuse, heavy alcohol use, and depression in youth 12-17 and young adults 1825. Substance use disorders may be associated with suicidality. While we have made some progress on getting more people with SUDs to treatment; there remains a large gap in treatment need vs. treatment access. 50
Conclusion Opioids Epidemic Some evidence for progress: Number of new users of heroin decreased from 170,000 in 2016 to 81,000 in 2017 Significant increases in those with SUDs receiving treatment in specialty settings and physician office settings NSDUH reveals areas where we need to focus resources: Transitional aged youth: mental illness and substance use disorders Addressing co-occurring mental and substance use disorders (8.3% in need received treatment) Women, and particularly, pregnant women with increasing use of substances 51
SAMHSA’s Response Addressing the need for clinicians to be prepared to address mental health issues and substance issues: Continue with implementation of training and technical assistance programs already launched to help with workforce preparation and expansion to address mental illness and substance use disorders Opioids Continue work with states to address opioids crisis needs in terms of prevention, treatment, and community recovery resources STR/SOR/TOR grants Block grants Discretionary grants Drug Free Communities grants Collaboration with HHS partners and other federal departments to expand resources to communities Connecting with the public: Develop products for individuals and their families to inform about mental and substance use disorders and availability of treatment approaches with a record of success Monitoring outcomes: Through continuation of NSDUH, DAWN, and SAMHSA grant program evaluation Making policy modifications as indicated 52
2017 NSDUH REPORT AMERICA’S BEHAVIORAL HEALTH CHANGES & CHALLENGES WWW.SAMHSA.GOV/DATA 53