Report to the Legislature Financial Addendum June 9, 2021


99 Slides2.71 MB
Report to the Legislature Financial Addendum June 9, 2021
Table of Contents Introduction Appendices Key Takeaways FY22 Tuition & Mandatory Fees A&F Roadmap 3.5 Ratios Enrollment, Admissions & Occupancy FY22 Revenue & Expense Details FY23-27 Preliminary Forecast Trends Campus Details FY22 Budget Overview 2
Key Takeaways Campuses returning to normal academic & student life activities; campus housing is open Staffing levels growing consistent with campuses being open Applications are up, expecting enrollment to be stable Uncertainty remains but real-time monitoring will continue Federal stimulus funds are critical and allow the University to avoid deficits Absent federal stimulus the University has a structural gap Long term financial planning is required Financial forecast delivered in December to demonstrate structural balance and a return to positive operating margins Accountability framework guides our approach to long term financial sustainability 3
UMass Framework for Financial Accountability Goal 1: Ensure financial sustainability & mitigate Independent & objective assurance that analyzes data, processes, policies & controls Standard processes to provide reasonable assurance regarding achievement of objectives risk Financial Sustainability Capital Strategy Risk Management Tax Compliance Goal 2: Deliver efficient operations to ensure access andShared Services Operations affordability for students ACCOUNTABILITY Goal 3: Improve our capacity to deliver financial, Analysis Reliable, timely information that is accessible & understandable Systematic approach to identifying, assessing & managing risks across the organization administrative & our customers Human Resourc other es service Financial Reporting objectives 4 to
A&F Roadmap 3.5 Progress Underway Coordination of University's COVID Response Nearly 685,000 tests conducted - positivity rate of 0.49% Advisory Working Group on Financial Planning Strengthen University budget/forecasting UPST Implementation Proactive sourcing opportunities More analytics and better cycle times 29.9 million in cost savings Restructure cash management plan Executed line of credit in May Analyze financial aid data and trends Upcoming Intersections Enhance University-wide ERM Program Update assessment tools and risk mitigation methodology Coordinate efforts to develop consistency in travel authorization Streamline procurement contracts and optimize procurement processes Implement phase 1 of payroll shared services Improve production of valuable financial reporting Implement standard for lease accounting (GASB 87) Implement additional UMPO diversity, equity & inclusion initiatives Design future of work for UMPO 5
Enrollment, Admissions & Occupancy 6
Change in Student Behavior Post-COVID Historical trends may no longer be accurate predictors of student behavior. Retention of existing students: to date registrations tracking to budget assumptions New students: to date tracking to budget assumptions: New freshmen: assessing impacts of a declining high school population Key Dates: April 5th: Registration Opens (returning students) May 1st: Deposit Deadline June-August: Orientations for New Freshman Classes Begin: September 1st: Amherst, Dartmouth, Lowell September 7th: Boston September 15th: Add/drop ends Transfers: Community college enrollment effect on transfers; 31.2% decline since 2009; average decline of 3.3% a year Carefully monitoring: Changes in student residency mix International Demand for on campus housing 7
FY22 Fall Enrollment Assumptions (as of 6/7/21) 5-year average growth rate of 0.9%; 10-year average growth rate of 1.7%; Total Enrollment (FTE): 65,609 FTEs 0.7% Undergraduate New: 469 or Undergraduate Continuing: 3.4% 5 Students FTEs Amherst Boston Dartmouth Lowell Subtotal % Growth Medical School University % Growth Budget FY2022 % Change 29,723 0.1% 13,486 -0.6% 6,353 -5.3% 14,795 -0.4% 64,357 -0.7% FY2017 28,340 13,101 7,558 13,910 62,909 FY2018 28,712 13,036 7,286 14,422 63,456 FY2019 29,051 13,213 7,330 14,601 64,195 FY2020 29,808 13,241 6,971 14,790 64,810 FY2021 29,693 13,571 6,709 14,855 64,828 1.0% 0.9% 1.2% 1.0% 0.0% -0.7% 1,070 1,074 63,979 64,530 1,153 65,348 1,195 66,005 1,242 66,070 1,252 65,609 1.3% 1.0% 0.1% -0.7% 1.0% 0.9% 0.8% -0.7% or 0.0% FY2022 FY2021 YTD YTD % YTD 18,714 63% 63% 6,814 51% 52% 3,705 58% 61% 9,013 61% 56% 38,246 59% 59% (1) During this period, due to COVID, groups of students were electronically enrolled resulting in higher FY21 YTD. 8
FY22 Fall Admissions Tracking (as of 6/7/21) New freshmen acceptances & deposits are below compared to same time last year; Transfers above. New (Freshmen): New (Transfers): Deposits (headcount) Deposits (headcount) 816 or 7% 367 or 14% New Freshmen Amherst Boston Dartmouth Lowell Total Transfers Amherst Boston Dartmouth Lowell Total Applicants 42,421 16,275 7,885 12,401 78,982 Fall YTD Accepted Deposits % Deposited 27,709 5,146 19% 12,791 2,166 17% 7,239 1,305 18% 10,486 1,980 19% 58,225 10,597 18% Applicants 3,570 2,347 686 917 7,520 Fall YTD Accepted Deposits % Deposited 2,400 1,473 61% 1,571 759 48% 611 369 60% 804 392 49% 5,386 2,993 56% Applicants 40,256 14,027 7,463 12,884 74,630 Prior YTD Prior Actual Accepted Deposits % Deposited Enrolled(1) 26,260 5,754 22% 5,036 10,885 2,113 19% 2,229 6,566 1,405 21% 1,282 9,716 2,141 22% 2,030 53,427 11,413 21% 10,577 Applicants 3,640 1,507 641 1,010 6,798 Prior YTD Prior Actual Accepted Deposits % Deposited Enrolled(1) 2,284 1,276 56% 1,424 1,248 571 46% 1,181 549 311 57% 456 897 468 52% 856 4,978 2,626 53% 3,917 Source: Fall admissions tracking from A&F Dashboard & Amherst campus; (1) Prior year actual enrollment from Student Profile 9
Housing Occupancy Assumptions Campuses are open, occupancy budgeted near normal and being monitored. Campus Amherst Dartmouth Lowell Fall Occupancy Comparison FY22 Estimates FY21 Actuals Total Beds % # % # 13,500 94% 12,650 8% 1,069 2,812 64% 1,800 18%* 704 4,600 61% 2,802 15% 690 P3 Beds Boston Dartmouth Total Beds 1,077 1,206 % 100% 82% # 1,077 989 % 27% * # 290 Spring Occupancy Comparison FY22 Estimates FY21 Actuals % # % # 85% 11,450 39% 5,218 60% 1,687 21%* 858 61% 2,802 24% 1,087 % 100% 82% # 1,077 989 % 32% * # 346 *For FY21, did not report break out campus vs P3 beds 10
Select Sensitivity Analysis for FY22 Assumptions made for enrollment and housing occupancy vary by campus Real time tracking of deposits for new students, registrations for continuing students and commitments for housing underway Revenue impact of /- each 100 student FTEs: in Thousands Average Impact ( /-) 100 Students Enrollment 1,900 Occupancy 1,300 Per Campus Total 3,200 University Total 11,500 Campus Amherst Boston Dartmouth Lowell Total ( /-) 3.2M % of Revenue 0.2% 0.4% 1.2% 0.6% 0.4% ( /-) 100 FTEs % of Enrollment 0.3% 0.7% 1.6% 0.7% 0.2% ( /-) 100 Beds % Occupancy 0.7% N/A 3.6% 2.1% N/A 11
FY22 Budget Overview 12
FY22: Quarterly Reporting Board Meeting: September 15th Initial reporting on enrollment Classes Begin(planned on-campus): Amherst, Dartmouth, Lowell: September 1 st Boston: September 7th Add/Drop Ends: by September 15th July-Sept. Oct. – Dec. Board Meeting: December 15th Refresh five-year Forecast Q1 Report completed: November 2021; Impact of Fall enrollment & management of FY22 Board Meeting: March/April 2022 Begin tracking Fall 22 (FY23) admission data Spring Classes Begin: Amherst, Boston: January 25th Lowell, Dartmouth: January 18th Q2 Report completed: February 2022 Jan. - March Apr. – Jun. Board Meeting: June 2022 Tracking enrollment & admissions for Fall 2022 FY23 budget development & scenario planning Q3 Report completed: May 2022 13
FY22 Budget: Assumptions Tuition & Fees: In State student tuition freeze In State: 0%; second year in a row O ut of State: 0% Boston, Dartmouth, Lowell; Amherst 1.5% Enrollment: 65,609 FTEs; -0.7% Fall Operations: On campus; occupancy assumptions vary Staffing: Increasing consistent with campus operating plans Stimulus: 138.4 million Student Aid Institutional Aid State: Appropriation increase Collective bargaining 68.8 million 69.6 million Level funding collective bargaining 11 million FY21: 1.5% one-time; FY22 2%; FY23 2% Cost 41 million; State support 17 million 14
University Revenue Sources FY22 Total Revenue 3.7B FY21 Total Revenue 3.4B 15
University Staffing FY22 budgeted staffing levels are consistent with campus operating plans. *Actuals as of 9/30 each year 16
Combined Operating Margin (FY21 FY22): Without Stimulus FY21: Q3 Projection FY22: Budget FY21 FY22 OM (Without Stimulus) (Without Stimulus) (Without Stimulus) ( in Thousands) Total Total Campus Revenue Expenses OM OM% Amherst 1,194,522 1,206,261 (11,739) -1.0% Boston 434,889 426,375 8,513 2.0% Dartmouth 221,029 230,524 (9,495) -4.3% Lowell 457,577 455,821 1,756 0.4% Subtotal 2,308,017 2,318,982 (10,964) -0.5% Medical School 976,771 952,166 24,606 2.5% President's Offi ce 108,756 100,094 8,662 8.0% Total 3,311,887 3,289,584 22,303 0.7% Total Total Revenue Expenses 1,360,230 1,375,405 443,731 455,577 243,965 254,666 480,578 504,849 2,528,504 2,590,497 980,118 960,489 105,067 101,641 3,532,032 3,570,969 OM OM% (15,175) -1.1% (11,846) -2.7% (10,701) -4.4% (24,271) -5.1% (61,993) -2.5% 19,629 2.0% 3,426 3.3% (38,938) -1.1% OM OM% (26,914) -1.0% (3,333) -0.4% (20,196) -4.0% (22,515) -2.3% (72,957) -1.4% 44,235 2.3% 12,088 5.8% (16,635) -0.2% *Does not include impacts of GASB 68 & 75 17
University: Revenue & Expenses ( in Thousands) Revenues Gross Tuition & Fees Tuition Discounts Discount Rate Net Tuition & Fees Grants Sales & Service, Educational Auxiliary Enterprises Other Operating State appropriations Other NonOperating Independent Business Lines Total Revenues % Growth Expenses Salaries & Fringe Non-personnel Scholarships and fellowships Depreciation Interest Total Expenses % Growth Actual FY2016 FY2017 FY2018 FY2019 FY2020 1,070,841 1,136,540 1,185,826 1,223,734 1,260,906 (244,025) (288,708) (311,947) (328,830) (343,030) 22.8% 25.4% 26.3% 26.9% 27.2% 826,816 847,832 874,825 894,904 917,876 528,352 560,081 560,990 593,086 581,849 27,500 28,910 30,591 34,984 31,248 383,281 400,822 416,733 441,795 378,314 307,286 233,717 311,119 222,076 236,123 669,748 720,817 751,894 780,222 810,518 162,741 195,089 197,142 231,504 222,128 330,259 371,618 274,555 266,509 280,620 3,235,982 3,358,886 3,417,849 3,465,080 3,458,676 12.3% 3.8% 1.8% 1.4% -0.2% FY2021 Budget Q3 Proj 1,230,609 1,268,901 (338,615) (342,990) 27.5% 27.0% 891,994 925,912 596,624 668,760 19,555 25,621 291,009 160,882 231,214 209,941 738,016 829,406 204,198 313,458 298,710 277,918 3,271,319 3,411,898 -5.4% -1.4% FY2022 Budget 1,279,182 (371,518) 29.0% 907,664 631,956 33,087 392,819 240,548 840,544 346,557 285,240 3,678,416 7.8% Variance (to FY21 Q3) % 10,282 0.8% (28,528) 8.3% Actual FY2016 FY2017 FY2018 FY2019 FY2020 1,788,018 1,847,346 1,901,896 1,970,869 2,096,087 1,067,226 1,018,600 1,088,019 943,685 987,219 44,645 47,706 50,402 49,507 65,469 240,864 249,669 261,417 276,638 288,667 105,276 110,069 115,851 116,217 109,186 3,211,563 3,237,351 3,337,511 3,356,916 3,546,628 11.4% 0.8% 3.1% 0.6% 5.7% FY2021 Budget Q3 Proj 1,939,933 1,944,284 872,854 884,837 55,250 84,616 294,522 297,746 108,829 108,783 3,271,389 3,320,266 -7.8% -6.4% FY2022 Budget 2,079,739 1,014,610 124,442 308,185 113,103 3,640,079 9.6% Variance (to FY21 Q3) % 135,455 7.0% 129,773 14.7% 39,826 47.1% 10,440 3.5% 4,319 4.0% 319,813 9.6% (18,247) (36,804) 7,466 231,938 30,607 11,138 33,099 7,322 266,519 Increasing -2.0% -5.5% 29.1% 144.2% 14.6% 1.3% 10.6% 2.6% 7.8% Note: Total revenue includes unrealized gains/losses that are excluded from the operating margin calculation; 18 total expenses excludes the impact of GASB 68&75 consistent with the operating margin calculation
Federal Stimulus Overview Student Aid: 113.5M across multiple rounds Emergency grants to students Prioritize “exceptional need”; includes but not restricted to students receiving Pell grants Not conditioned on continued enrollment Can satisfy outstanding balances with consent Not considered financial aid or taxable income Institutional Allocation: TOTAL STIMULUS (by legislation) Student Institutional Aid Allocation Total ( in Thousands) CARES & GEER 23,009 26,047 49,056 HEERF II 23,009 52,916 75,925 HEERF III 67,530 66,060 133,590 Total 113,548 145,023 258,571 145M across multiple rounds Recovers a portion of lost revenue due to the pandemic Bridge to a post-COVID environment including but not limited to: One-time operating and/or infrastructure investments Strategic investments that grow revenue (enrollment and retention; programmatic and research) 19
Student Emergency Aid Grants University students will directly receive 113.5 million of emergency aid. Grants to students: Campuses have provided emergency grants: FY20 14.7 million FY21 30.1 million All campuses plan to provide the remaining 68.8 million in FY22 Understanding revenue and expense impacts: Student grant revenue and expense are recognized in the year which they are provided to students; no operating margin impact Awarding student grants trigger recognizing institutional revenue regardless of when the funds are spent; skewing operating margin TOTAL STUDENT AID ( in Thousands) FY20 FY21 FY22 Student Campus Actual Projection Budget Total Amherst 8,882 9,454 25,256 43,592 Boston 2,527 9,657 18,561 30,745 Dartmouth 460 5,065 9,995 15,520 Lowell 2,690 5,323 14,970 22,983 Medical School 122 586 708 Total 14,681 30,085 68,782 113,548 *Based on best estimates included in FY22 plan; actuals may vary 20
Institutional Stimulus Aid Revenue must be recognized as student aid is distributed, skewing campus operating margins CARES, HEERF II & III Institutional Awards: INSTITUTIONAL AID FY20 – revenue recognized to cover actual ( in Thousands) COVID related costs FY20 FY21 FY22 Institutional FY21 & FY22 – revenue recognized based on Campus Actual Projection Budget Total use of student funds Amherst 8,882 20,318 24,940 54,140 Understanding revenue and expense Boston 1,734 20,537 18,330 40,601 impacts: 558 8,632 10,702 19,892 Institutional Aid revenue must be recognized Dartmouth 2,726 11,165 15,667 29,558 when (in the year) student aid is distributed Lowell 833 833 Revenue will increase regardless of when the Medical School Total 13,899 61,485 69,640 145,023 institutional funds are spent; skewing operating margin *Based on best estimates included in FY22 plan; actuals may vary Individually, FY21& 22 operating margins are skewed; must look at a 2-year operating margin view Funds will be spent over multiple years as some will be used for capital investments 21
Stimulus Helps Bridge Undergraduate Revenue Loss 11% “Normal” campus operations FY2223 4% 10% 0% 0% -4% -8% (1) 230M housing & dining impact % Growth FY19-23 FY14-18 Average Annual 1.4% 3.5% Total 4.7% 14.1% Stimulus used as a bridge while campus operations transition back to ‘normal’ Increased housing occupancy and stable enrollment trends will drive revenue growth (1,2) (1) Total revenue for Amherst, Boston, Dartmouth, Lowell; excludes Medical School & President’s Office 22 (2) Includes CARES, HEERF II & HEERF III; Assumes near pre-COVID occupancy in fall FY22; normal thereafter
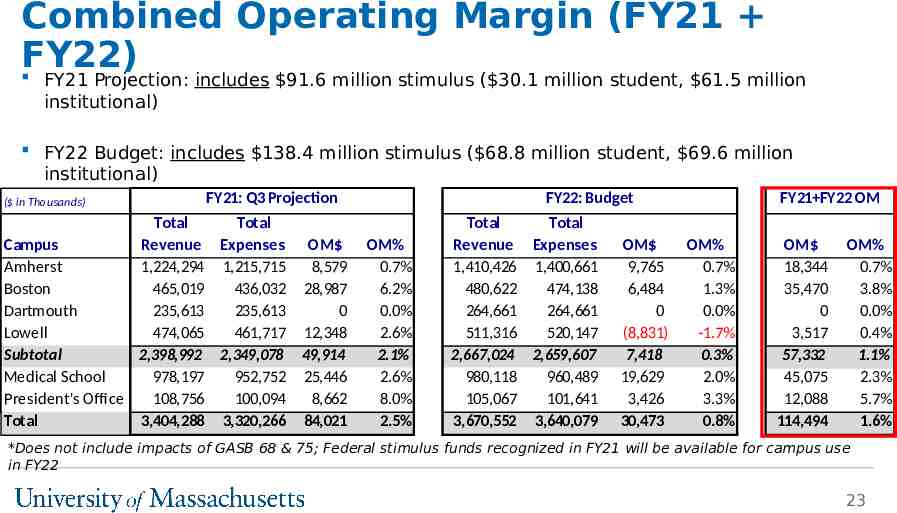
Combined Operating Margin (FY21 FY22) FY21 Projection: includes 91.6 million stimulus ( 30.1 million student, 61.5 million institutional) FY22 Budget: includes 138.4 million stimulus ( 68.8 million student, 69.6 million institutional) ( in Thousands) FY21: Q3 Projection Total Total Campus Revenue Expenses OM Amherst 1,224,294 1,215,715 8,579 Boston 465,019 436,032 28,987 Dartmouth 235,613 235,613 0 Lowell 474,065 461,717 12,348 Subtotal 2,398,992 2,349,078 49,914 Medical School 978,197 952,752 25,446 President's Offi ce 108,756 100,094 8,662 Total 3,404,288 3,320,266 84,021 FY22: Budget OM% 0.7% 6.2% 0.0% 2.6% 2.1% 2.6% 8.0% 2.5% Total Total Revenue Expenses 1,410,426 1,400,661 480,622 474,138 264,661 264,661 511,316 520,147 2,667,024 2,659,607 980,118 960,489 105,067 101,641 3,670,552 3,640,079 OM 9,765 6,484 0 (8,831) 7,418 19,629 3,426 30,473 FY21 FY22 OM OM% 0.7% 1.3% 0.0% -1.7% 0.3% 2.0% 3.3% 0.8% OM 18,344 35,470 0 3,517 57,332 45,075 12,088 114,494 OM% 0.7% 3.8% 0.0% 0.4% 1.1% 2.3% 5.7% 1.6% *Does not include impacts of GASB 68 & 75; Federal stimulus funds recognized in FY21 will be available for campus use in FY22 23
Key Takeaways Enrollment is stable, return to normal academic & student life activities & campus housing is open; there is uncertainty but real-time monitoring will continue (65,609 FTEs; -0.7%) Staffing levels growing consistent with campuses being open (15,130 FTEs; 6%) Federal stimulus funds critical & allow the University to avoid deficits ( 145 million in FY20-22) Over FY21 & FY22 the budgets are balanced utilizing available stimulus funds; a 2-year view of operating margin is more informative ( 1.6%) State budget process nearing completion; continue to monitor appropriation and collective bargaining support Long term financial planning is required - financial forecast delivered in December - to demonstrate structural balance and a return to positive operating margins 24
Budget Related Action Items Approval of the University’s FY22 Operating Budget, Doc. T21-018 Approval of Mandatory Student Charges – Changes to Student Activity Fees, UMass Boston and UMass Amherst, Doc. T21-019 Authorization to Allocate the FY22 State Appropriation, Doc. T21020 25
Appendices: FY22 Tuition & Mandatory Fees (voted in April) Ratios FY22 Revenue & Expenses Campus Details 26
FY22 Tuition & Mandatory Fees Voted: April 14, 2021
Tuition Undergraduate Tuition: In State FY21 FY22 Graduate Tuition: In State Change % Change FY21 FY22 Change % Change Amherst 15,791 15,791 0 0.0% Amherst 14,778 14,778 0 0.0% Boston 14,187 14,187 0 0.0% Boston 18,433 18,433 0 0.0% Dartmouth 13,833 13,833 0 0.0% Dartmouth 16,390 16,390 0 0.0% Lowell 15,078 15,078 0 0.0% Lowell 14,590 14,590 0 0.0% Undergraduate Tuition: Out of State FY21 FY22 Graduate Tuition: Out of State Change % Change FY21 FY22 Change % Change Amherst 35,779 36,316 537 1.5% Amherst 33,040 33,536 496 1.5% Boston 34,649 34,649 0 0.0% Boston 35,980 35,980 0 0.0% Dartmouth 29,578 29,578 0 0.0% Dartmouth 29,578 29,578 0 0.0% Lowell 33,004 33,004 0 0.0% Lowell 26,370 26,370 0 0.0% 28
Room & Board: Rates Based on Standard Room & Dining Plan Room Amherst Dartmouth Lowell Boston (P3) FY21 7,462 10,094 FY22 Change % Change 7,611 149 2.0% 10,397 303 3.0% 8,820 8,500 - 320 -3.6% 10,024 10,525 501 5.0% Boston: P3 room rates are set by P3 Governing Board and are not subject to Board approval. Dartmouth: Board Amherst Boston Dartmouth Lowell FY21 FY22 Change % Change 5,867 5,717 5,984 5,830 117 2.0% 114 2.0% 5,233 5,428 195 3.7% 5,070 5,070 0 0.0% Change % Change Total R&B FY21 FY22 Amherst Dartmouth Lowell 13,329 13,595 266 2.0% 15,327 15,825 498 3.3% 13,890 13,570 - 320 -2.3% Boston 15,741 16,355 615 3.9% P3 room rates are set by P3 Governing Board and are not subject to Board approval; standard P3 room is 10,107. Remaining room rates set by campus; rate included is a standard room. Lowell: A major restructuring of housing and dining options, plans and rates was undertaken to align with peers and drive increased occupancy. (w/ P3 Room) 29
Tuition & Mandatory Fees: Medical School In State FY21 FY22 Change % Change In State Tuition 36,570 37,120 550 1.5% Mandatory Fees 2,091 2,130 39 1.9% In State Tuition 14,275 14,490 215 1.5% Graduate Entry Program In State Tuition 44,512 45,180 668 1.5% 1,390 1,410 20 1.4% In State Tuition 14,724 14,946 222 1.5% Mandatory Fees 1,056 1,072 16 1.5% Out of State FY21 FY22 62,889 63,832 943 1.5% 2,091 2,130 39 1.9% Out of State Tuition 19,518 19,812 294 1.5% Graduate Entry Program Out of State Tuition 57,246 58,106 860 1.5% 1,390 1,410 20 1.4% 32,340 32,826 486 1.5% 1,056 1,072 16 1.5% Medical School Graduate School of Nursing Mandatory Fees Graduate School of Biomedical Science Change % Change Medical School Out of State Tuition Mandatory Fees Graduate School of Nursing Mandatory Fees Graduate School of Biomedical Science Out of State Tuition Mandatory Fees 30
Tuition & Fee Vote Summary Tuition: In State Undergraduate and Graduate: Amherst, Boston, Dartmouth, Lowell 0% Out of State Undergraduate and Graduate: Amherst 1.5%; Boston, Dartmouth, Lowell 0% Medical School: 1.5% Mandatory Fees: Technology Fee: no change; 400 annual per campus Student Activities Fee: no change; varies by campus with changes voted/supported by students Medical School: 16-39 increases; varies by program Room & Board: standard room and board plans at each campus; detailed schedules of rates by building, room type approved by the President Non-Mandatory Fees: delegates authority to the President to review and approve; 31 vary by campus and include fees for specific programs, equipment and labs, among
Ratios 32
Key Financial Ratios Defined Operating cash flow margin – Measures net income (before non-cash expenses) relative to operating revenue to support investments Operating margin – Indicates the excess margin (or deficit) by which annual revenues cover annual expenses (excluding unrealized gains or losses) Debt burden – Compares the relative cost of borrowing to overall expenditures Debt service coverage – Measures the ability to make debt service payments from annual operations Spendable Cash & Investments to expenses – Measures the extent to which the University can rely on wealth that can be accessed over time or for a specific purpose to operate (Total revenues – total expenses) depreciation interest Total revenues Total revenues – total expenses Total revenues Debt service (P&I) Total expenses (Total revenues – total expenses) depreciation interest Debt service (P&I) (Cash & investments – debt service reserve funds permanently restricted pledges receivable – permanently restricted Net Assets) Total expenses Financial Leverage Ratio– Measures the ability to repay bondholders from wealth that can be accessed over time or for a specific purpose Spendable Cash & Investments Total Debt Moody’s will be changing it’s rating scorecard and moving to Total Cash & Investments to Operating Expenses Moody’s will be changing its rating scorecard and moving to Total Cash & Investments to Total Adjusted Debt 33
Operating Cash Flow Margin Actual Q3 Projection Budget FY2016 FY2017 FY2018 FY2019 FY2020 FY2021 FY2022 Amherst 15.6% 14.8% 14.8% 14.6% 12.9% 14.3% 13.8% Boston 5.4% 7.1% 9.0% 11.2% 13.3% 19.4% 20.0% Dartmouth 12.1% 13.9% 10.6% 12.8% 12.2% 13.1% 11.5% Lowell 12.8% 14.6% 14.3% 14.7% 13.1% 15.8% 8.3% Medical 8.7% 12.8% 11.5% 13.7% 12.6% 11.2% 10.8% Central 17.0% 17.7% 17.5% 12.0% 12.2% 12.1% 7.4% University 12.0% 13.7% 13.2% 14.0% 13.1% 16.5% 15.1% Excludes impact of GASB 68 & 75 34
Operating Margin *Moody’s OM calculation which uses normalized investment income Amherst Boston Dartmouth Lowell Medical Central University FY2016 FY2017 4.1% 3.0% -1.3% -0.7% 3.1% 3.4% 0.2% 2.2% -1.1% 3.2% 0.7% 6.4% 1.3% 2.7% Actual Q3 Projection Budget FY2018 FY2019 FY2020 FY2021 FY2022 2.6% 2.7% 0.2% 0.7% 0.7% 0.6% 0.9% 1.1% 6.2% 1.3% 1.1% 1.4% 0.0% 0.0% 0.0% 1.5% 1.3% -0.6% 2.6% -1.7% 2.2% 3.5% 3.0% 2.6% 2.0% 10.4% 8.9% 4.1% 8.0% 3.3% 2.3% 2.7% 1.1% 2.5% 0.8% FY2021 FY2022 0.7% 3.8% 0.0% 0.4% 2.3% 5.7% 1.6% Excludes impact of GASB 68 & 75 35
Debt Service Burden Amherst Boston Dartmouth Lowell Medical Central University FY2016 FY2017 6.4% 6.6% 4.9% 5.9% 8.4% 7.8% 7.5% 7.3% 5.2% 6.0% 3.7% 3.4% 6.2% 6.6% Actual Q3 Projection Budget FY2018 FY2019 FY2020 FY2021 FY2022 6.8% 6.5% 6.4% 4.0% 5.9% 6.3% 6.9% 7.5% 4.4% 6.7% 7.6% 7.8% 7.7% 4.1% 6.5% 7.4% 7.3% 6.8% 5.1% 6.5% 5.1% 5.5% 4.9% 2.3% 5.2% 2.8% 4.5% 4.4% 5.1% 5.0% 6.5% 6.6% 6.4% 3.8% 6.1% Excludes impact of GASB 68 & 75 36
Debt Service Coverage Amherst Boston Dartmouth Lowell Medical Central University FY2016 FY2017 2.5 2.3 1.0 1.1 1.4 1.8 1.7 2.0 1.7 2.2 4.6 5.6 1.9 2.1 Actual Q3 Projection Budget FY2018 FY2019 FY2020 FY2021 FY2022 2.2 2.3 2.0 3.6 2.3 1.4 1.6 1.7 4.5 3.0 1.3 1.6 1.5 3.0 1.7 1.9 2.0 1.9 3.0 1.1 2.3 2.6 2.7 5.1 2.1 7.0 2.8 3.0 2.6 1.5 2.1 2.1 2.0 4.4 2.5 Excludes impact of GASB 68 & 75; 37
Spendable Cash & Investments Amherst Boston Dartmouth Lowell Medical Central University FY2016 FY2017 0.42 0.46 0.20 0.19 0.17 0.20 0.34 0.31 0.23 0.30 1.44 1.74 0.35 0.40 Actual Q3 Projection Budget FY2018 FY2019 FY2020 FY2021 FY2022 0.46 0.46 0.45 0.48 0.42 0.19 0.24 0.27 0.28 0.26 0.24 0.27 0.27 0.30 0.27 0.29 0.29 0.30 0.32 0.29 0.43 0.50 0.48 0.48 0.51 1.95 2.10 2.06 2.29 2.29 0.44 0.48 0.45 0.50 0.46 Excludes impact of GASB 68 & 75 Note: Moody’s will be changing it’s rating scorecard and moving to Total Cash & Investments to Operating Expenses 38
Financial Leverage Amherst Boston Dartmouth Lowell Medical Central University FY2016 FY2017 0.48 0.48 0.15 0.12 0.20 0.21 0.27 0.25 0.34 0.42 1.95 2.35 0.39 0.41 Actual Q3 Projection Budget FY2018 FY2019 FY2020 FY2021 FY2022 0.49 0.54 0.49 0.48 0.48 0.12 0.16 0.19 0.19 0.19 0.28 0.19 0.20 0.20 0.20 0.24 0.24 0.26 0.27 0.26 0.64 0.72 0.64 0.71 0.65 2.46 2.72 2.64 2.64 2.64 0.47 0.48 0.43 0.47 0.46 Excludes impact of GASB 68 & 75 Note: Moody’s will be changing its rating scorecard and moving to Total Cash & Investments to Total Adjusted Debt 39
FY22 Revenue & Expenses 40
University Revenue 3.7 billion; an increase of 7.8% Category Campu s 41
Student Emergency Aid Grants: by Legislation STUDENT: CARES ACT STUDENT: HEERF III ( in Thousands) FY20 FY21 Campus Actual Projection Amherst 8,882 286 Boston 2,527 3,565 Dartmouth 460 2,684 Lowell 2,690 1,760 Medical School 122 33 Total 14,681 8,328 ( in Thousands) % N/A N/A N/A N/A N/A FY22 Budget - STUDENT: HEERF II FY20 FY21 FY22 Campus Actual Projection % Budget Amherst 9,168 100% Boston 6,092 100% Dartmouth 2,381 76% 763 Lowell 3,563 80% 887 Medical School 155 100% Total 21,359 1,650 % N/A N/A N/A N/A N/A Student Total 9,168 6,092 3,144 4,450 155 23,009 ( in Thousands) FY20 FY21 Campus Actual Projection Amherst Boston Dartmouth Lowell Medical School 398 Total 398 ( in Thousands) % 0% 0% 24% 20% 0% Student Total 9,168 6,092 3,144 4,450 155 23,009 FY20 Campus Actual Amherst 8,882 Boston 2,527 Dartmouth 460 Lowell 2,690 Medical School 122 Total 14,681 % 0% 0% 0% 0% 100% FY22 Budget 25,256 18,561 9,232 14,083 67,132 TOTAL STUDENT FY21 FY22 Projection % Budget 9,454 N/A 25,256 9,657 N/A 18,561 5,065 N/A 9,995 5,323 N/A 14,970 586 N/A 30,085 68,782 % 100% 100% 100% 100% 0% % N/A N/A N/A N/A N/A Student Total 25,256 18,561 9,232 14,083 398 67,530 Student Total 43,592 30,745 15,520 22,983 708 113,548 42
Accounting for Institutional Stimulus: by Legislation INSTITUTIONAL: CARES ACT (including 3M GEER) ( in Thousands) FY20 FY21 Campus Actual Projection Amherst 8,882 1,334 Boston 1,734 5,248 Dartmouth 558 3,078 Lowell 2,726 2,333 Medical School 155 Total 13,899 12,148 % N/A N/A N/A N/A N/A FY22 Budget - % N/A N/A N/A N/A N/A Student Total 10,216 6,982 3,636 5,059 155 26,047 INSTITUTIONAL: HEERF II FY20 FY21 FY22 Student Campus Actual Projection % Budget % Total Amherst 18,984 100% 18,984 0% Boston 15,289 100% 15,289 0% Dartmouth 5,554 76% 1,780 24% 7,333 Lowell 8,832 80% 2,199 20% 11,031 Medical School 280 100% 280 0% Total 48,939 3,978 52,917 ( in Thousands) INSTITUTIONAL: HEERF III FY20 FY21 FY22 Student Campus Actual Projection % Budget % Total Amherst 24,940 0% 24,940 100% Boston 18,330 0% 18,330 100% Dartmouth 8,923 100% 8,923 0% Lowell 13,469 0% 13,469 100% Medical School 398 100% 398 0% Total 398 65,661 66,059 ( in Thousands) ( in Thousands) FY20 Campus Actual Amherst 8,882 Boston 1,734 Dartmouth 558 Lowell 2,726 Medical School Total 13,899 TOTAL INSTITUTIONAL FY21 FY22 Projection % Budget 20,318 N/A 24,940 20,537 N/A 18,330 8,632 N/A 10,702 11,165 N/A 15,667 833 N/A 61,485 69,640 % N/A N/A N/A N/A N/A Student Total 54,140 40,601 19,892 29,558 833 145,023 43
University Revenue: by Revenue Category in Thousands Gross Tuition & Fees Gross Tuition & Fees Growth Tuition Discounts Tuition Discounts Growth Net Tuition & Fees Net Tuition & Fees Growth Grants Grants Growth Sales & Service, Educational Sales & Service, Educational Growth Auxiliary Enterprises Auxiliary Growth Other Operating Other Operating Growth State State Growth Other Non Operating Other Non-Operating Growth Independent Business Lines (Med) Independent Business Lines Growth Total Total Growth Actual FY2016 FY2017 FY2018 FY2019 FY2020 1,070,841 1,136,540 1,185,826 1,223,734 1,260,906 8.5% 6.1% 4.3% 3.2% 3.0% FY2021 Budget Q3 Proj 1,230,609 1,268,901 -2.4% 0.6% FY2022 Variance (to FY21 Q3) Budget % 1,279,182 10,282 0.8% 0.8% (244,025) (288,708) (311,000) (328,830) (343,030) 9.8% 18.3% 7.7% 5.7% 4.3% (338,615) (342,990) -1.3% 0.0% (371,518) 8.3% 826,816 8.0% 847,832 2.5% 874,825 3.2% 894,904 2.3% 917,876 2.6% 891,994 -2.8% 925,912 0.9% 907,664 -2.0% (18,247) -2.0% 528,352 3.4% 560,081 6.0% 560,990 0.2% 593,086 5.7% 581,849 -1.9% 596,624 2.5% 668,760 14.9% 631,956 -5.5% (36,804) -5.5% 27,500 7.4% 28,910 5.1% 30,591 5.8% 34,984 14.4% 31,248 -10.7% 19,555 -37.4% 25,621 -18.0% 33,087 29.1% 7,466 29.1% 383,281 5.8% 400,822 4.6% 416,733 4.0% 441,795 6.0% 378,314 -14.4% 291,009 -23.1% 160,882 -57.5% 392,819 144.2% 231,938 144.2% 307,286 124.4% 233,717 -23.9% 311,119 33.1% 222,076 -28.6% 236,123 6.3% 231,214 -2.1% 209,941 -11.1% 240,548 14.6% 30,607 14.6% 669,748 7.8% 720,817 7.6% 751,894 4.3% 780,222 3.8% 810,518 3.9% 738,016 -8.9% 829,406 2.3% 840,544 1.3% 11,138 1.3% 162,741 12.3% 195,089 19.9% 197,142 1.1% 231,504 17.4% 222,128 -4.1% 204,198 -8.1% 313,458 41.1% 346,557 10.6% 33,099 10.6% 330,259 5.8% 371,618 12.5% 274,555 -26.1% 266,509 -2.9% 280,620 5.3% 298,710 6.4% 277,918 -1.0% 285,240 2.6% 7,322 2.6% 3,271,319 3,411,898 -5.4% -1.4% 3,678,416 7.8% 266,519 7.8% 3,235,982 3,358,886 3,417,849 3,465,080 3,458,676 12.4% 3.8% 1.8% 1.4% -0.2% Note: Total revenue includes unrealized gains/losses that are excluded from the operating margin calculation 44
Revenue: by Campus in Thousands Amherst Amherst Growth Boston Boston Growth Dartmouth Dartmouth Growth Lowell Lowell Growth President's Offi ce President's Office Growth Subtotal Subtotal Growth Medical School Medical School Growth Total Total Growth FY2016 1,174,441 8.5% FY2017 1,216,054 3.5% Actual FY2018 1,276,643 5.0% 406,402 8.1% 423,334 4.2% 426,589 0.8% 436,467 2.3% 443,615 1.6% 406,953 -8.3% 465,019 4.8% 480,622 3.4% 15,603 3.4% 241,281 4.1% 248,385 2.9% 250,628 0.9% 256,592 2.4% 251,446 -2.0% 224,285 -10.8% 235,613 -6.3% 264,661 12.3% 29,048 12.3% 418,400 7.2% 439,843 5.1% 459,042 4.4% 484,770 5.6% 480,120 -1.0% 431,228 -10.2% 474,065 -1.3% 511,316 7.9% 37,250 7.9% 107,621 7.8% 117,659 9.3% 119,219 1.3% 124,478 4.4% 115,679 -7.1% 121,566 5.1% 108,756 -6.0% 105,067 -3.4% (3,689) -3.4% 2,348,145 7.1% 963,663 24.5% 2,445,275 4.0% 991,957 2.9% 2,532,121 3.4% 965,654 -2.7% 2,643,359 4.2% 903,378 -6.4% 2,619,771 -0.9% 921,572 2.0% 2,430,583 -7.8% 922,393 0.1% 2,513,398 -4.1% 980,157 6.4% 2,777,741 10.5% 982,332 0.2% 264,344 10.5% 2,175 0.2% 3,235,982 12.4% 3,358,886 3.8% 3,417,849 1.8% 3,465,080 1.4% 3,458,676 -0.2% 3,271,319 -5.4% 3,411,898 -1.4% 3,678,416 7.8% 266,519 7.8% FY2019 1,341,052 5.0% FY2020 1,328,911 -0.9% FY2021 Budget Q3 Proj 1,246,552 1,229,944 -6.2% -7.4% FY2022 Variance (to FY21 Q3) Budget % 1,416,076 186,132 15.1% 15.1% Note: Total revenue includes unrealized gains/losses that are excluded from the operating margin calculation 45
University Expenses 3.6 billion; an increase of 9.6% Category Campu s 46
University Expenses: by Expense Category in Thousands Salaries & Fringe Salaries & Fringe Growth Non-personnel Non-personnel Growth Scholarships&fellowships Scholarships & fellowships Growth Depreciation Depreciation Growth Interest Interest Growth Total Total Growth FY2016 FY2017 Actual FY2018 1,788,018 7.8% 1,847,346 3.3% 1,901,896 3.0% 1,970,869 3.6% 2,096,087 6.4% 1,939,933 -7.4% 1,944,284 -7.2% 2,079,739 7.0% 135,455 7.0% 1,067,226 25.1% 1,018,600 -4.6% 1,088,019 6.8% 943,685 -13.3% 987,219 4.6% 872,854 -11.6% 884,837 -10.4% 1,014,610 14.7% 129,773 14.7% 44,645 -9.4% 47,706 6.9% 50,402 5.7% 49,507 -1.8% 65,469 32.2% 55,250 -15.6% 84,616 29.2% 124,442 47.1% 39,826 47.1% 240,864 9.0% 249,669 3.7% 261,417 4.7% 276,638 5.8% 288,667 4.3% 294,522 2.0% 297,746 3.1% 308,185 3.5% 10,440 3.5% 105,276 4.9% 110,069 4.6% 115,851 5.3% 116,217 0.3% 109,186 -6.0% 108,829 -0.3% 108,783 -0.4% 113,103 4.0% 4,319 4.0% 3,211,563 11.4% 3,237,351 0.8% 3,336,260 3.1% 3,356,916 0.6% 3,483,937 3.8% 3,271,389 -6.1% 3,320,266 -4.7% 3,640,079 9.6% 319,813 9.6% FY2019 FY2020 FY2021 Budget Q3 Proj FY2022 Budget Variance (to FY21 Q3) % Note: Total expenses excludes the impact of GASB 68&75 consistent with the operating margin calculation 47
Expenses: by Campus Note: Total expenses excludes the impact of GASB 68&75 consistent with the operating margin calculation 48
FY23-27 Preliminary Forecast Trends 49
FY23-27 Preliminary Forecast: Assumptions & Take Aways Assumptions: Key Take Aways: Revenue: average growth 2.5% annually; 11.8% over forecast Uncertainty continues to exist; using history as a predictor of future performance may not always work Preliminary assumptions reflect return to steady 2.5% revenue growth; previous forecast closer to 3% Enrollment relatively flat annually impacted by pandemic and overall demographic shift Expense reductions will be needed annually to achieve a balanced budget; operating margin growth must be assessed Refined forecast to be completed for December Board meeting Tuition & Fees - 2.5% increase Enrollment – average growth 0.4% annually; 1.2% over forecast; varies by campus Housing occupancy – normal operations Expenses: average growth 2.5% annually; 11.3% over forecast Collective Bargaining - 2% Requires expense reductions to achieve balance 50
University: Preliminary Forecast 51
Campus Details 52
University 53
University: Revenue & Expenses ( in Thousands) Revenues Gross Tuition & Fees Tuition Discounts Discount Rate Net Tuition & Fees Grants Sales & Service, Educational Auxiliary Enterprises Other Operating State appropriations Other NonOperating Independent Business Lines Total Revenues % Growth Expenses Salaries & Fringe Non-personnel Scholarships and fellowships Depreciation Interest Total Expenses % Growth Actual FY2016 FY2017 FY2018 FY2019 FY2020 1,070,841 1,136,540 1,185,826 1,223,734 1,260,906 (244,025) (288,708) (311,947) (328,830) (343,030) 22.8% 25.4% 26.3% 26.9% 27.2% 826,816 847,832 874,825 894,904 917,876 528,352 560,081 560,990 593,086 581,849 27,500 28,910 30,591 34,984 31,248 383,281 400,822 416,733 441,795 378,314 307,286 233,717 311,119 222,076 236,123 669,748 720,817 751,894 780,222 810,518 162,741 195,089 197,142 231,504 222,128 330,259 371,618 274,555 266,509 280,620 3,235,982 3,358,886 3,417,849 3,465,080 3,458,676 12.3% 3.8% 1.8% 1.4% -0.2% FY2021 Budget Q3 Proj 1,230,609 1,268,901 (338,615) (342,990) 27.5% 27.0% 891,994 925,912 596,624 668,760 19,555 25,621 291,009 160,882 231,214 209,941 738,016 829,406 204,198 313,458 298,710 277,918 3,271,319 3,411,898 -5.4% -1.4% FY2022 Budget 1,279,182 (371,518) 29.0% 907,664 631,956 33,087 392,819 240,548 840,544 346,557 285,240 3,678,416 7.8% Variance (to FY21 Q3) % 10,282 0.8% (28,528) 8.3% Actual FY2016 FY2017 FY2018 FY2019 FY2020 1,788,018 1,847,346 1,901,896 1,970,869 2,096,087 1,067,226 1,018,600 1,088,019 943,685 987,219 44,645 47,706 50,402 49,507 65,469 240,864 249,669 261,417 276,638 288,667 105,276 110,069 115,851 116,217 109,186 3,211,563 3,237,351 3,337,511 3,356,916 3,546,628 11.4% 0.8% 3.1% 0.6% 5.7% FY2021 Budget Q3 Proj 1,939,933 1,944,284 872,854 884,837 55,250 84,616 294,522 297,746 108,829 108,783 3,271,389 3,320,266 -7.8% -6.4% FY2022 Budget 2,079,739 1,014,610 124,442 308,185 113,103 3,640,079 9.6% Variance (to FY21 Q3) % 135,455 7.0% 129,773 14.7% 39,826 47.1% 10,440 3.5% 4,319 4.0% 319,813 9.6% (18,247) (36,804) 7,466 231,938 30,607 11,138 33,099 7,322 266,519 -2.0% -5.5% 29.1% 144.2% 14.6% 1.3% 10.6% 2.6% 7.8% Note: Total revenue includes unrealized gains/losses that are excluded from the operating margin calculation; 54 total expenses excludes the impact of GASB 68&75 consistent with the operating margin calculation
FY22 Undergraduate Revenue & Expense ChangesRevenue increase 268.0M Expense increase 310.5M FY21 Surplus Revenue - Expenses FY22 Surplus 34.8M 227.7M 11.6M 13.2M 106.1M 49.9M 268.0M 310.5M 7.4M 49.9M 152.0M - 19.3M 7.4M 40.4M 11.9M Emergency student aid expenses reflected in scholarships & fellowships; institutional aid expenses including in salaries & fringe and non-personnel 55
University: Enrollment Trend Students FTEs Amherst Boston Dartmouth Lowell Subtotal Medical School University % Growth FY2011 FY2012 FY2013 FY2014 FY2015 FY2016 FY2017 FY2018 26,328 26,637 26,747 27,008 27,098 27,696 28,340 28,712 11,442 11,791 12,001 12,333 12,833 13,195 13,101 13,036 8,263 7,980 7,984 7,866 7,930 7,766 7,558 7,286 11,361 11,867 12,490 13,025 13,369 13,620 13,910 14,422 57,394 58,275 59,222 60,232 61,230 62,277 62,909 63,456 1,170 1,206 1,115 1,104 1,071 1,056 1,070 1,074 58,564 59,481 60,337 61,336 62,301 63,333 63,979 64,530 5.1% 1.6% 1.4% 1.7% 1.6% 1.7% 1.0% 0.9% FY2019 29,051 13,213 7,330 14,601 64,195 1,153 65,348 FY2020 29,808 13,241 6,971 14,790 64,810 1,195 66,005 FY2021 29,693 13,571 6,709 14,855 64,828 1,242 66,070 FY2022 29,723 13,486 6,353 14,795 64,357 1,252 65,609 1.3% 1.0% 0.1% -0.7% Source: Actuals from student profile. 56
Enrollment by CareerAmherst Students (FTEs) University Actual Budget Undergraduate Students (FTEs) Undergraduate FY2020 FY2021 50,014 49,262 FY2022 48,796 % Change Graduate 9,000 8,973 8,988 0.2% 6,746 7,507 7,498 -0.2% 11.3% -0.1% 5,460 6,337 6,518 10.3% 16.1% 2.9% 246 328 327 23.6% 33.2% -0.2% 66,005 66,070 65,609 1.0% 0.1% -0.7% % Change Law School % Change Total -0.9% -0.3% % Change Online Only -1.5% -0.4% % Change Continuing Ed 1.3% % Change Source: Actuals from student profile. Actual Budget FY2020 FY2021 23,680 23,430 Boston FY2022 Students (FTEs) 23,380 Undergraduate 3.2% -1.1% -0.2% Graduate 3,736 3,648 3,648 Graduate % Change -0.9% -2.4% % Change Continuing Ed 313 250 % Change -24.8% -20.1% Online Only 2,079 2,365 % Change Total % Change 3.1% 29,808 29,693 29,723 2.6% -0.4% 0.1% Students (FTEs) Undergraduate FY2020 FY2021 5,261 4,993 Graduate -6.1% Budget -5.1% % Change 2,439 Online Only 13.8% Actual % Change 256 Continuing Ed 2.4% 8.4% Dartmouth % Change 0.0% % Change % Change Total % Change Lowell FY2022 Students (FTEs) 4,636 Undergraduate -7.2% % Change 535 Graduate Actual Budget FY2020 FY2021 10,280 10,342 FY2022 10,447 0.2% 0.6% 1.0% 1,771 1,783 1,783 3.3% 0.7% 0.0% 419 599 392 -41.3% 42.8% -34.5% 769 847 865 45.7% 10.1% 2.1% 13,241 13,571 13,486 0.2% 2.5% -0.6% Actual Budget FY2020 FY2021 10,792 10,497 FY2022 10,334 2.2% -2.7% -1.6% 1,761 1,721 1,770 -2.4% -2.3% 2.9% 536 579 % Change -9.8% 8.1% -7.7% % Change Continuing Ed* 928 809 855 Continuing Ed 274 201 211 % Change -1.0% -12.8% 5.7% % Change -3.9% -26.7% 5.1% 1,963 2,436 2,480 0.3% 24.1% 1.8% 14,790 14,855 14,795 1.3% 0.4% -0.4% Law School 246 328 327 Online Only % Change 23.6% 33.2% -0.2% Total 6,971 6,709 % Change % Change -4.9% -3.8% 6,353 Total -5.3% % Change 57
Enrollment by New vs Continuing Amherst Undergraduate (FTEs) New % Change University Undergraduate (FTEs) New % Change Continuing % Change Undergraduate Total % Change Continuing Actual FY2020 FY2021 15,472 13,873 Budget FY2022 13,404 5.0% -10.3% -3.4% 34,541 35,388 35,393 -0.2% 2.5% 0.0% 50,013 49,260 48,797 1.3% -1.5% -0.9% % Change Undergraduate Total % Change Boston Undergraduate (FTEs) New % Change Continuing % Change Undergraduate Total % Change Dartmouth Undergraduate (FTEs) New % Change Continuing Budget FY2022 6,100 11.5% -11.9% -5.0% 16,396 17,010 17,280 -0.1% 3.7% 1.6% 23,680 23,429 23,380 3.2% -1.1% -0.2% Actual FY2020 FY2021 3,244 3,076 Budget FY2022 3,104 -3.0% -5.2% 0.9% 7,036 7,266 7,343 1.8% 3.3% 1.1% 10,280 10,342 10,447 0.2% 0.6% 1.0% Actual FY2020 FY2021 1,721 1,533 Budget FY2022 1,400 -6.1% -10.9% -8.6% 3,540 3,461 3,236 % Change -6.0% -2.2% -6.5% Undergraduate Total 5,261 4,993 4,636 % Change -6.1% -5.1% -7.2% Lowell Undergraduate (FTEs) New % Change Continuing % Change Source: Actuals from student profile. Actual FY2020 FY2021 7,284 6,419 Undergraduate Total % Change Actual FY2020 FY2021 3,223 2,845 Budget FY2022 2,800 6.4% -11.7% -1.6% 7,569 7,651 7,534 0.6% 1.1% -1.5% 10,792 10,496 10,334 2.2% -2.7% -1.5% 58
Enrollment by Residency Amherst Students (FTEs) In State % Change Out of State University Students (FTEs) In State % Change Out of State % Change Total % Change Actual Budget % Change Total % Change FY2020 FY2021 50,072 50,438 FY2022 50,120 1.4% 0.7% -0.6% 15,934 15,633 15,489 -0.3% -1.9% -0.9% 66,005 66,070 65,609 1.0% 0.1% -0.7% Students (FTEs) In State Budget FY2020 FY2021 20,743 20,843 FY2022 20,767 3.6% 0.5% -0.4% 9,065 8,850 8,956 0.3% -2.4% 1.2% 29,808 29,693 29,723 2.6% -0.4% 0.1% Boston Actual Budget FY2020 FY2021 10,639 11,045 FY2022 11,082 0.6% 3.8% 0.3% Out of State 2,602 2,526 2,404 % Change -1.3% -2.9% -4.8% 13,241 13,571 13,486 0.2% 2.5% -0.6% % Change Total % Change Dartmouth Students (FTEs) In State Actual Budget FY2020 5,820 FY2021 5,599 FY2022 5,305 -6.0% -3.8% -5.2% 1,151 1,111 1,047 1.1% -3.5% -5.7% Total 6,971 6,709 6,353 % Change -4.9% -3.8% -5.3% % Change Out of State % Change Lowell Students (FTEs) In State Actual Budget FY2020 FY2021 12,080 12,138 FY2022 12,145 2.4% 0.5% 0.1% Out of State 2,711 2,717 2,650 % Change -3.5% 0.2% -2.5% 14,790 14,855 14,795 1.3% 0.4% -0.4% % Change Source: Actuals from student profile. Actual Total % Change 59
Expense Drivers: Staffing Employee FTEs Restricted Faculty Staff Total Restricted Actual FY2018 FY2019 FY2020 FY2021 Unrestricted General University Ops Faculty Staff Executive/Admin/Managerial Professional Nonfaculty Secretarial/Clerical Technical/Paraprofessional Skilled Crafts Service Maintenance Workers Unspecified Total General University Ops 313 1,553 1,866 318 1,537 1,854 3,878 6,566 458 3,581 1,119 619 268 521 3,961 6,539 469 3,630 1,087 614 261 479 311 1,543 1,854 318 1,568 1,886 3,990 3,874 6,588 6,208 483 490 3,718 3,609 1,050 923 600 567 257 218 479 402 1 10,444 10,500 10,578 10,082 3,855 6,595 Unrestricted Aux./Independent Business Faculty 15 Staff 2,466 Total Aux./Independent Business 2,481 Total Faculty & Staff # Change 13 2,751 2,764 315 1,597 1,911 Budget FY2022 11 2,291 2,302 10 2,784 2,794 14,792 15,118 15,519 14,238 15,130 327 10 3,020 3,030 10,450 401 (1,281) 892 Note: Historical actuals are as of 9/30 60
University: Key Ratios Key Ratio Operating Margin (%) Operating Margin ( ) FY2016 1.3% 41,017 Actual FY2017 FY2018 FY2019 2.7% 2.3% 2.7% 88,985 79,928 92,781 FY2020 1.1% 37,474 Operating Cash Flow Margin (%) Operating Cash Flow Margin ( ) 12.0% 385,596 13.7% 447,796 13.2% 443,101 14.0% 475,586 13.1% 447,301 13.6% 442,079 16.5% 558,275 15.1% 548,838 Debt Service Burden (%) 6.2% 6.6% 6.5% 6.6% 6.4% 6.9% 3.8% 6.1% Debt Service Coverage (x) 1.9 2.1 2.1 2.1 2.0 2.0 4.4 2.5 0.50 0.47 3,152,981 3,448,893 0.46 3,541,026 Financial Leverage (x) Total Debt ( in thousands) 0.39 0.41 0.47 0.50 0.43 2,858,343 3,056,133 3,067,106 3,119,251 3,687,795 FY2021 Budget Q3 Proj. -0.2% 2.5% (5,248) 84,021 FY2022 Budget 0.8% 30,473 Combined operating margin FY2122 114.5M; 1.6% *Q3 projected debt service reflects restructured FY21 principal resulting in lower total debt service 61
Amherst 62
Amherst: Revenue & Expenses ( in Thousands) Revenues Gross Tuition & Fees Tuition Discounts Discount Rate Net Tuition & Fees Grants Sales & Service, Educational Auxiliary Enterprises Other Operating State appropriations Other NonOperating Total Revenues % Growth FY2016 FY2017 481,072 513,450 (114,881) (139,441) 23.9% 27.2% 366,191 374,009 145,217 148,554 8,935 9,137 241,428 256,110 22,413 16,575 319,541 345,411 70,716 66,258 1,174,441 1,216,054 8.5% 3.5% Actual FY2018 FY2019 FY2020 541,665 562,859 586,915 (150,824) (151,628) (160,429) 27.8% 26.9% 27.3% 390,841 411,231 426,486 153,007 163,645 151,629 9,321 10,795 10,653 268,041 279,545 243,865 16,768 16,439 19,644 360,161 371,781 386,057 78,504 87,616 90,577 1,276,643 1,341,052 1,328,911 5.0% 5.0% -0.9% FY2021 Budget Q3 Proj 586,549 593,400 (164,232) (167,907) 28.0% 28.3% 422,317 425,493 166,354 150,664 3,456 8,428 206,758 102,488 18,936 24,130 352,667 395,792 76,064 122,949 1,246,552 1,229,944 -6.2% -7.4% FY2022 Budget 600,443 (175,856) 29.3% 424,587 159,625 10,696 267,898 19,560 401,707 132,003 1,416,076 15.1% Variance (to FY21 Q3) % 7,043 1.2% (7,949) 4.7% FY2016 FY2017 676,474 712,315 308,850 306,743 14,452 17,378 96,614 100,409 32,417 36,250 1,128,807 1,173,095 6.9% 3.9% Actual FY2018 FY2019 FY2020 744,102 780,545 802,927 326,076 341,923 337,418 18,216 16,581 27,613 109,965 117,086 121,494 43,131 40,706 39,653 1,241,490 1,296,841 1,329,105 5.8% 4.5% 2.5% FY2021 Budget Q3 Proj 771,647 767,463 292,386 251,343 21,255 28,054 126,206 128,570 39,708 40,285 1,251,202 1,215,715 -5.9% -8.5% FY2022 Budget 824,082 351,396 46,256 135,214 43,713 1,400,661 15.2% Variance (to FY21 Q3) % 56,619 7.4% 100,053 39.8% 18,202 64.9% 6,644 5.2% 3,428 8.5% 184,946 15.2% ( in Thousands) Expenses Salaries & Fringe Non-personnel Scholarships and fellowships Depreciation Interest Total Expenses % Growth (906) 8,961 2,268 165,410 (4,570) 5,915 9,054 186,132 -0.2% 5.9% 26.9% 161.4% -18.9% 1.5% 7.4% 15.1% Note: Total revenue includes unrealized gains/losses that are excluded from the operating margin calculation; 63 total expenses excludes the impact of GASB 68&75 consistent with the operating margin calculation
Amherst: Enrollment by Career Amherst Students (FTEs) Undergraduate Actual FY2016 FY2017 22,169 22,588 3,417 464 1,647 27,697 Spring 21,635 1.3% 3.2% -1.1% -0.2% -7.5% 3,496 3,708 3,772 3,736 3,648 3,648 3,648 2.3% 6.1% 1.7% -0.9% -2.4% 0.0% 0.0% 428 1,827 472 1,888 417 1,917 313 2,079 250 2,365 256 2,439 256 2,439 6.8% 4.7% -1.1% 2.5% 9.3% 3.1% 0.0% 28,339 28,711 29,051 29,808 29,693 29,723 27,978 2.3% 1.3% 1.2% 2.6% -0.4% 0.1% -5.9% % Change Total Fall 23,380 0.2% % Change Continuing Ed Online Only FY2018 FY2019 FY2020 FY2021 22,643 22,945 23,680 23,430 1.9% % Change Graduate Budget FY2022 % Change Source: Actuals from student profile. 64
Amherst: Enrollment by New v Continuing Amherst Undergraduate (FTEs) New FY2016 6,100 % Change Continuing 16,069 % Change Undergraduate Total % Change 22,169 Actual FY2017 FY2018 FY2019 FY2020 FY2021 6,184 6,182 6,535 7,284 6,419 Budget FY2022 Fall Spring 6,100 5,795 1.4% 0.0% 5.7% 11.5% -11.9% -5.0% -5.0% 16,404 16,461 16,411 16,396 17,010 17,280 15,840 2.1% 0.3% -0.3% -0.1% 3.7% 1.6% -8.3% 22,588 22,643 22,945 23,680 23,429 23,380 21,635 1.9% 0.2% 1.3% 3.2% -1.1% -0.2% -7.5% Source: Actuals from student profile. 65
Amherst: Enrollment by Residency Amherst Students (FTEs) In State Actual FY2016 FY2017 FY2018 FY2019 FY2020 FY2021 19,142 19,665 19,827 20,016 20,743 20,843 % Change Out of State 8,555 % Change Total % Change Budget FY2022 27,697 Fall 20,767 Spring 19,503 2.7% 0.8% 1.0% 3.6% 0.5% -0.4% -6.1% 8,674 8,884 9,034 9,065 8,850 8,956 8,475 1.4% 2.4% 1.7% 0.3% -2.4% 1.2% -5.4% 28,339 28,711 29,051 29,808 29,693 29,723 27,978 2.3% 1.3% 1.2% 2.6% -0.4% 0.1% -5.9% Source: Actuals from student profile. 66
Amherst: Staffing & Staffing Ratios Employee FTEs Restricted Faculty Staff Total Restricted Unrestricted General University Ops Faculty Staff Executive/Admin/Managerial Professional Nonfaculty Secretarial/Clerical Technical/Paraprofessional Skilled Crafts Service Maintenance Workers Unspecified Total General University Ops Actual FY2018 FY2019 FY2020 FY2021 49 374 423 43 361 404 42 382 425 41 432 474 Budget FY2022 41 432 473 1,508 1,569 1,620 1,605 2,676 2,712 2,762 2,678 125 135 143 159 1,179 1,215 1,257 1,329 588 583 581 519 294 300 293 284 173 177 179 146 317 302 308 240 1,588 2,787 4,183 4,280 4,382 4,283 4,375 Unrestricted Aux./Independent Business Faculty Staff Total Aux./Independent Business 1,023 1,023 1,228 1,228 1,516 1,516 816 816 1,314 1,314 Total Faculty & Staff 5,629 5,912 6,323 5,572 6,162 283 411 (750) 590 # Change Actual FY2017 FY2018 FY2019 FY2020 FY2021 Budget FY2022 28,339 1,550 18.3 28,711 1,556 18.4 29,051 1,611 18.0 29,808 1,663 17.9 29,693 1,647 18.0 29,723 1,629 18.2 Staff - Faculty (All) Staff (FTE) Faculty (FTE) Staff-Faculty Ratio 3,944 1,550 2.5 4,072 1,556 2.6 4,301 1,611 2.7 4,660 1,663 2.8 3,926 1,647 2.4 4,533 1,629 2.8 Staff - Faculty (E&G) Staff (FTE) Faculty (FTE) Staff-Faculty Ratio (E&G) 2,611 1,486 1.8 2,676 1,508 1.8 2,712 1,569 1.7 2,762 1,620 1.7 2,678 1,605 1.7 2,787 1,588 1.8 Student - Faculty Student (FTE) Faculty (FTE) Student-Faculty Ratio Note: Historical actuals are as of 9/30; FY22 staffing includes return to normal operations specifically in housing and dining and filling of some vacant positions. 67
Amherst: Key Ratios Key Ratio Operating Margin (%) Operating Margin ( ) Actual FY2016 FY2017 FY2018 FY2019 FY2020 4.1% 3.0% 2.6% 2.7% 0.2% 48,150 36,052 33,114 36,365 2,539 FY2021 Budget Q3 Proj. -0.8% 0.7% (10,300) 8,579 FY2022 Budget 0.7% 9,765 Operating Cash Flow Margin (%) Operating Cash Flow Margin ( ) 15.6% 181,720 14.8% 176,745 14.8% 186,268 14.6% 192,282 12.9% 168,787 13.2% 161,636 14.3% 172,166 13.8% 192,638 6.4% 6.6% 6.8% 6.5% 6.4% 7.2% 4.0% 5.9% 2.5 2.3 2.2 2.3 2.0 1.8 3.6 2.3 0.51 0.48 1,150,551 1,203,126 0.48 1,203,126 Debt Service Burden (%) Debt Service Coverage (x) Financial Leverage (x) Total Debt ( in thousands) Spendable Cash & Investments to Op Expenses (x) Enrollment Enrollment (% Change) 0.50 0.50 0.54 0.54 0.49 939,847 1,048,407 1,044,216 1,089,240 1,203,126 0.42 0.46 0.46 0.46 0.45 0.48 0.48 0.42 27,697 28,339 2.3% 28,711 1.3% 29,051 1.2% 29,808 2.6% 28,615 -4.0% 29,693 -0.4% 29,723 0.1% *Q3 projected debt service reflects restructured FY21 principal resulting in lower total debt service Combined operating margin FY2122 18.3M; 0.7% 68
Boston 69
Boston: Revenue & Expenses ( in Thousands) Revenues Gross Tuition & Fees Tuition Discounts Discount Rate Net Tuition & Fees Grants Sales & Service, Educational Auxiliary Enterprises Other Operating State appropriations Other NonOperating Total Revenues % Growth FY2016 232,355 (45,471) 19.6% 186,884 53,927 3,709 5,965 2,837 117,987 35,093 406,402 8.1% FY2017 240,235 (53,820) 22.4% 186,415 58,201 3,979 6,167 1,818 130,157 36,597 423,334 4.2% ( in Thousands) Expenses Salaries & Fringe Non-personnel Scholarships and fellowships Depreciation Interest Total Expenses % Growth FY2016 FY2017 266,100 275,330 101,713 98,250 16,047 16,161 18,988 22,246 9,064 12,476 411,912 424,463 9.1% 3.0% Actual FY2018 243,760 (57,790) 23.7% 185,970 56,212 4,072 5,199 1,758 135,605 37,773 426,589 0.8% FY2019 FY2020 245,734 252,603 (64,836) (69,973) 26.4% 27.7% 180,898 182,630 53,536 54,732 4,312 1,744 12,315 10,381 2,218 3,138 140,659 146,284 42,529 44,706 436,467 443,615 2.3% 1.6% FY2021 Budget Q3 Proj. 240,185 254,880 (70,190) (74,969) 29.2% 29.4% 169,995 179,912 49,546 57,721 1,348 1,001 7,556 3,143 1,123 2,150 134,183 149,869 43,203 71,224 406,953 465,019 -8.3% 4.8% FY2022 Variance (to FY21 Q3) Budget % 254,142 (738) -0.3% (79,050) (4,082) 5.4% 31.1% 175,092 (4,820) -2.7% 57,823 102 0.2% 2,100 1,099 109.8% 13,419 10,276 327.0% 2,531 381 17.7% 152,222 2,353 1.6% 77,434 6,210 8.7% 480,622 15,603 3.4% 3.4% Actual FY2018 FY2019 FY2020 269,465 269,723 269,734 98,972 98,428 96,680 17,180 17,983 20,771 24,433 28,010 32,460 14,152 16,823 19,312 424,202 430,967 438,957 -0.1% 1.6% 1.9% FY2021 Budget Q3 Proj. 248,883 261,415 85,130 92,277 17,983 29,865 35,029 33,495 19,927 18,980 406,953 436,032 -7.3% -0.7% FY2022 Variance (to FY21 Q3) Budget % 272,268 10,853 4.2% 111,181 18,904 20.5% 37,405 7,540 25.2% 34,178 683 2.0% 19,106 126 0.7% 474,138 38,106 8.7% 8.7% Note: Total revenue includes unrealized gains/losses that are excluded from the operating margin calculation; 70 total expenses excludes the impact of GASB 68&75 consistent with the operating margin calculation
Boston: Enrollment by Career Boston Students (FTEs) Undergraduate Actual FY2016 FY2017 FY2018 FY2019 FY2020 FY2021 9,657 9,529 9,835 10,256 10,280 10,342 % Change Graduate 1,876 % Change Continuing Ed Online Only 829 833 % Change Total Budget FY2022 13,195 % Change Fall Spring 10,447 9,232 -1.3% 3.2% 4.3% 0.2% 0.6% 1.0% -11.6% 1,816 1,802 1,714 1,771 1,783 1,783 1,667 -3.2% -0.8% -4.9% 3.3% 0.7% 0.0% -6.5% 939 818 697 703 715 528 419 769 599 847 392 865 401 890 5.7% -20.3% -11.2% -4.4% 21.6% -13.1% 2.7% 13,036 13,213 13,241 13,571 13,486 12,190 0.2% 2.5% -0.6% -9.6% 13,101 -0.7% -0.5% 1.4% Source: Actuals from student profile. 71
Boston: Enrollment by New v Continuing Boston Undergraduate (FTEs) New Actual FY2016 FY2017 FY2018 FY2019 FY2020 FY2021 2,695 2,612 2,995 3,344 3,244 3,076 % Change Continuing 6,962 % Change Undergraduate Total 9,657 % Change Budget FY2022 Fall Spring 3,104 2,743 -3.1% 14.7% 11.6% -3.0% -5.2% 0.9% -11.6% 6,917 6,838 6,912 7,036 7,266 7,343 6,489 -0.6% -1.1% 1.1% 1.8% 3.3% 1.1% -11.6% 9,529 9,834 10,256 10,280 10,342 10,447 9,232 0.2% 0.6% 1.0% -11.6% -1.3% 3.2% 4.3% Source: Actuals from student profile. 72
Boston: Enrollment by Residency Boston Students (FTEs) In State Actual FY2016 FY2017 FY2018 FY2019 FY2020 FY2021 10,254 10,155 10,249 10,576 10,639 11,045 % Change Out of State 2,941 % Change Total Budget FY2022 13,195 % Change Fall Spring 11,082 10,016 -1.0% 0.9% 3.2% 0.6% 3.8% 0.3% -9.6% 2,946 2,788 2,637 2,602 2,526 2,404 2,173 0.2% -5.4% -5.4% -1.3% -2.9% -4.8% -9.6% 13,036 13,213 13,241 13,571 13,486 12,190 0.2% 2.5% -0.6% -9.6% 13,101 -0.7% -0.5% 1.4% Source: Actuals from student profile. 73
Boston: Staffing & Staffing Ratios Employee FTEs Restricted Faculty Staff Total Restricted Unrestricted General University Ops Faculty Staff Executive/Admin/Managerial Professional Nonfaculty Secretarial/Clerical Technical/Paraprofessional Skilled Crafts Service Maintenance Workers Unspecified Total General University Ops Unrestricted Aux./Independent Business Faculty Staff Total Aux./Independent Business Total Faculty & Staff # Change Actual FY2018 FY2019 FY2020 FY2021 Budget FY2022 13 153 166 12 135 147 10 132 142 7 126 133 12 146 158 862 983 93 590 167 105 12 16 873 931 89 559 152 105 11 14 864 941 83 574 150 106 11 15 843 869 85 540 133 88 9 13 828 914 1,845 1,804 1,805 1,712 1,742 56 56 40 40 27 27 19 19 22 22 2,067 1,991 1,974 1,863 1,922 (76) (17) (111) Actual FY2018 FY2019 FY2020 FY2021 Student - Faculty Student (FTE) Faculty (FTE) Student-Faculty Ratio Staff - Faculty (All) Staff (FTE) Faculty (FTE) Staff-Faculty Ratio Staff - Faculty (E&G) Staff (FTE) Faculty (FTE) Staff-Faculty Ratio (E&G) 13,036 875 14.9 13,213 885 14.9 13,241 874 15.2 13,571 850 16.0 Budget FY2022 13,486 840 16.1 1,192 875 1.4 1,106 885 1.2 1,100 874 1.3 1,013 850 1.2 1,082 840 1.3 983 862 1.1 931 873 1.1 941 864 1.1 869 843 1.0 914 828 1.1 58 Note: Historical actuals are as of 9/30; FY22 staffing reflects average staffing as of 9/30 which includes filling some vacant positions. 74
Boston: Key Ratios Key Ratio Operating Margin (%) Operating Margin ( ) Operating Cash Flow Margin (%) Operating Cash Flow Margin ( ) FY2016 -1.3% (5,369) Actual FY2017 FY2018 FY2019 -0.7% 0.6% 0.9% (3,001) 2,387 3,896 FY2020 1.1% 4,658 FY2021 Budget Q3 Proj. 0.0% 6.2% (0) 28,987 Budget FY2022 1.3% 6,484 5.4% 21,192 7.1% 28,684 9.0% 36,282 11.2% 46,650 13.3% 56,042 14.4% 56,214 19.4% 85,138 20.0% 96,084 Debt Service Burden (%) 4.9% 5.9% 6.3% 6.9% 7.5% 8.0% 4.4% 6.7% Debt Service Coverage (x) 1.0 1.1 1.4 1.6 1.7 1.7 4.5 3.0 0.16 505,552 0.12 622,941 0.12 611,819 0.16 616,132 0.19 606,847 0.19 0.19 586,689 606,847 0.19 606,847 0.20 0.19 0.19 0.24 0.27 0.29 0.28 0.26 13,195 2.8% 13,101 -0.7% 13,036 -0.5% 13,213 1.4% 13,241 0.2% 12,854 -2.9% 13,571 2.5% 13,486 -0.6% Financial Leverage (x) Total Debt ( in thousands) Spendable Cash & Investments to Op Expenses (x) Enrollment Enrollment (% Change) Combined operating margin FY2122 35.5M; 3.8% *Q3 projected debt service reflects restructured FY21 principal resulting in lower total debt service; FY20 Debt Burden excludes Bayside principal pre-payment. 75
Dartmouth 76
Dartmouth: Revenue & Expenses ( in Thousands) Revenues Gross Tuition & Fees Tuition Discounts Discount Rate Net Tuition & Fees Grants Sales & Service, Educational Auxiliary Enterprises Other Operating State appropriations Other NonOperating Total Revenues % Growth FY2016 FY2017 112,467 115,421 (35,987) (38,179) 32.0% 33.1% 76,480 77,242 18,511 19,534 71 45 48,835 48,349 5,016 6,237 75,971 80,436 16,397 16,542 241,281 248,385 4.1% 2.9% Actual FY2018 FY2019 116,766 121,340 (38,795) (42,762) 33.2% 35.2% 77,971 78,578 18,925 18,918 96 164 47,666 49,451 4,438 2,955 83,740 86,385 17,792 20,141 250,628 256,592 0.9% 2.4% FY2016 FY2017 142,174 142,247 63,166 64,262 5,001 4,821 17,904 18,647 7,968 8,786 236,213 238,763 4.8% 1.1% Actual FY2018 FY2019 150,061 151,746 65,795 66,939 5,023 5,302 20,481 21,665 8,910 9,466 250,270 255,118 4.8% 1.9% ( in Thousands) Expenses Salaries & Fringe Non-personnel Scholarships and fellowships Depreciation Interest Total Expenses % Growth FY2020 120,535 (39,858) 33.1% 80,677 18,677 154 35,932 2,312 92,731 20,963 251,446 -2.0% FY2021 Budget Q3 Proj 113,511 114,453 (36,854) (35,026) 32.5% 30.6% 76,657 79,428 18,196 18,739 157 40 21,586 10,084 3,933 2,000 81,923 94,267 21,833 31,055 224,285 235,613 -10.8% -6.3% FY2022 Budget 116,002 (43,645) 37.6% 72,357 20,254 75 35,006 2,945 95,658 38,366 264,661 12.3% Variance (to FY21 Q3) % 1,549 1.4% (8,619) 24.6% FY2022 Budget 153,049 65,080 15,255 22,642 8,635 264,661 12.3% Variance (to FY21 Q3) FY2020 152,040 62,457 5,641 22,187 9,125 251,450 -1.4% FY2021 Budget Q3 Proj 137,029 140,728 53,103 53,345 5,562 10,656 22,265 22,314 8,758 8,570 226,717 235,613 -9.8% -6.3% (7,071) 1,515 35 24,922 945 1,391 7,311 29,048 12,321 11,735 4,599 328 65 29,048 -8.9% 8.1% 87.5% 247.1% 47.2% 1.5% 23.5% 12.3% % 8.8% 22.0% 43.2% 1.5% 0.8% 12.3% Note: Total revenue includes unrealized gains/losses that are excluded from the operating margin calculation; 77 total expenses excludes the impact of GASB 68&75 consistent with the operating margin calculation
Dartmouth: Enrollment by Career By Career Actual Students (FTEs) Undergraduate FY2016 FY2017 FY2018 FY2019 FY2020 FY2021 6,149 5,861 5,582 5,600 5,261 4,993 -4.7% % Change Graduate 755 % Change Continuing Ed* 693 % Change Law School 170 % Change Total % Change 7,766 -4.8% Budget FY2022 0.3% -6.1% -5.1% Fall Spring 4,636 4,214 -7.2% -9.1% 763 698 594 536 579 535 510 1.1% -8.5% -14.9% -9.8% 8.1% -7.7% -4.7% 776 823 937 928 809 855 777 12.1% 6.0% 13.9% -1.0% -12.8% 5.7% -9.1% 157 184 199 246 328 327 305 -7.6% 16.7% 8.4% 23.6% 33.2% -0.2% -6.6% 7,558 7,286 7,330 6,971 6,709 6,353 5,806 -2.7% -3.6% 0.6% -4.9% -3.8% -5.3% -8.6% *Continuing Ed includes Online Only FTEs Source: Actuals from student profile. 78
Dartmouth: Enrollment by New v Continuing Dartmouth Undergraduate (FTEs) New Actual FY2016 FY2017 FY2018 FY2019 FY2020 FY2021 1,774 1,663 1,647 1,833 1,721 1,533 % Change Continuing 4,375 % Change Undergraduate Total % Change 6,149 Budget FY2022 Fall Spring 1,400 1,273 -6.2% -1.0% 11.3% -6.1% -10.9% -8.6% -9.1% 4,198 3,934 3,767 3,540 3,461 3,236 2,942 -4.0% -6.3% -4.3% -6.0% -2.2% -6.5% -9.1% 5,861 5,582 5,600 5,261 4,993 4,636 4,214 -4.7% -4.8% 0.3% -6.1% -5.1% -7.2% -9.1% Source: Actuals from student profile. 79
Dartmouth: Enrollment by Residency Dartmouth Students (FTEs) In State Actual FY2016 FY2017 FY2018 FY2019 FY2020 6,705 6,410 6,211 6,191 5,820 % Change Out of State 1,061 % Change Total Budget FY2022 7,766 % Change FY2021 5,599 Fall 5,305 Spring 4,840 -4.4% -3.1% -0.3% -6.0% -3.8% -5.2% -8.8% 1,148 1,075 1,139 1,151 1,111 1,047 966 8.2% -6.3% 5.9% 1.1% -3.5% -5.7% -7.7% 7,558 7,286 7,330 6,971 6,709 6,353 5,806 -2.7% -3.6% 0.6% -4.9% -3.8% -5.3% -8.6% Source: Actuals from student profile. 80
Dartmouth: Staffing & Staffing Ratios Employee FTEs Restricted Faculty Staff Total Restricted Unrestricted General University Ops Faculty Staff Executive/Admin/Managerial Professional Nonfaculty Secretarial/Clerical Technical/Paraprofessional Skilled Crafts Service Maintenance Workers Unspecified Total General University Ops Unrestricted Aux./Independent Business Faculty Staff Total Aux./Independent Business Total Faculty & Staff # Change Actuals FY2018 FY2019 FY2020 FY2021 Budget FY2022 FY2018 6 30 36 5 31 36 5 30 36 6 32 38 3 34 37 464 597 51 274 158 46 19 48 466 595 51 282 157 41 18 46 457 577 49 278 150 44 15 41 436 530 46 254 133 43 15 39 405 585 1,061 1,061 1,034 966 990 106 106 107 107 91 91 77 77 76 76 1,203 1,203 1,161 1,081 1,103 (42) (80) 22 - Student - Faculty Student (FTE) Faculty (FTE) Student-Faculty Ratio 7,286 470 15.5 Actual FY2019 FY2020 7,330 471 15.6 6,971 463 15.1 FY2021 Budget FY2022 6,709 442 15.2 6,353 408 15.6 Staff - Faculty (All) Staff (FTE) Faculty (FTE) Staff-Faculty Ratio 733 470 1.6 733 471 1.6 698 463 1.5 639 442 1.4 695 408 1.7 Staff - Faculty (E&G) Staff (FTE) Faculty (FTE) Staff-Faculty Ratio (E&G) 597 464 1.3 595 466 1.3 577 457 1.3 530 436 1.2 585 405 1.4 Note: Historical actuals are as of 9/30; FY22 staffing reflects plan to fill vacant positions including 17 faculty, 54 staff and 3 auxiliary 81
Dartmouth: Key Ratios Key Ratio Operating Margin (%) Operating Margin ( ) Operating Cash Flow Margin (%) Operating Cash Flow Margin ( ) Actual FY2016 FY2017 FY2018 FY2019 FY2020 3.1% 3.4% 1.1% 1.4% 0.0% 7,434 8,442 2,801 3,658 81 FY2021 Budget Q3 Proj. 0.0% 0.0% 0 0 FY2022 Budget 0.0% 0 12.1% 28,208 13.9% 33,475 10.6% 25,525 12.8% 32,192 12.2% 29,670 11.5% 24,758 13.1% 29,169 11.5% 28,470 Debt Service Burden (%) 8.4% 7.8% 7.6% 7.8% 7.7% 8.6% 4.1% 6.5% Debt Service Coverage (x) 1.4 1.8 1.3 1.6 1.5 1.3 3.0 1.7 0.20 0.20 338,643 338,643 0.20 338,643 Financial Leverage (x) Total Debt ( in thousands) Spendable Cash & Investments to Op Expenses (x) Enrollment Enrollment (% Change) 0.20 0.21 0.28 0.19 0.20 201,118 215,530 205,513 351,883 338,643 0.17 0.20 0.24 0.27 0.27 7,766 -2.1% 7,558 -2.7% 7,286 -3.6% 7,330 0.6% 6,971 -4.9% *Q3 projected debt service reflects restructured FY21 principal resulting in lower total debt service TBD 0.30 0.27 6,259 -10.2% 6,709 -3.8% 6,353 -5.3% Combined operating margin FY2122 0; 0% 82
Lowell 83
Lowell: Revenue & Expenses ( in Thousands) Revenues Gross Tuition & Fees Tuition Discounts Discount Rate Net Tuition & Fees Grants Sales & Service, Educational Auxiliary Enterprises Other Operating State appropriations Other NonOperating Total Revenues % Growth FY2016 224,065 (45,417) 20.3% 178,648 41,346 89 57,782 7,984 104,725 27,826 418,400 7.2% FY2017 243,228 (54,517) 22.4% 188,711 42,190 767 60,570 7,008 111,859 28,738 439,843 5.1% ( in Thousands) Expenses Salaries & Fringe Non-personnel Scholarships and fellowships Depreciation Interest Total Expenses % Growth Actual FY2018 256,002 (61,218) 23.9% 194,784 44,875 925 65,030 7,438 117,668 28,322 459,042 4.4% FY2019 FY2020 259,130 263,115 (65,369) (67,631) 25.2% 25.7% 193,761 195,484 53,613 57,639 1,436 1,481 68,923 55,461 8,129 6,629 122,802 127,688 36,106 35,738 484,770 480,120 5.6% -1.0% Actual FY2016 239,536 114,923 9,134 32,985 21,272 417,850 7.9% FY2017 249,312 116,761 9,316 34,127 18,790 428,306 2.5% FY2018 262,133 121,734 9,983 37,806 19,896 451,552 5.4% FY2019 FY2020 274,695 284,516 128,938 123,928 9,641 11,439 42,147 44,482 21,231 18,879 476,652 483,244 5.6% 1.4% FY2021 Budget Q3 Proj. 252,603 268,112 (62,274) (60,000) 24.7% 22.4% 190,329 208,112 59,113 63,421 1,766 1,518 22,558 14,128 6,508 5,100 117,497 132,171 33,457 49,615 431,228 474,065 -10.2% -1.3% FY2022 Variance (to FY21 Q3) Budget % 268,595 483 0.2% (67,000) (7,000) 11.7% 24.9% 201,595 (6,517) -3.1% 66,221 2,800 4.4% 2,058 540 35.6% 41,242 27,114 191.9% 3,969 (1,131) -22.2% 134,090 1,919 1.5% 62,141 12,526 25.2% 511,316 37,250 7.9% 7.9% FY2021 FY2022 Variance (to FY21 Q3) Budget Q3 Proj. 260,270 268,936 99,096 110,260 10,450 15,455 44,841 47,498 16,571 19,568 431,228 461,717 -10.8% -4.5% Budget 295,289 131,609 25,526 48,536 19,187 520,147 12.7% 26,353 21,349 10,071 1,038 (381) 58,430 % 9.8% 19.4% 65.2% 2.2% -1.9% 12.7% Note: Total revenue includes unrealized gains/losses that are excluded from the operating margin calculation; 84 total expenses excludes the impact of GASB 68&75 consistent with the operating margin calculation
Lowell: Enrollment by Career Lowell Students (FTEs) Undergraduate Actual FY2016 FY2017 FY2018 FY2019 FY2020 FY2021 9,550 9,742 10,239 10,555 10,792 10,497 % Change Graduate 1,757 % Change Continuing Ed Online Only 614 1,699 % Change Total Budget FY2022 13,620 % Change Fall 10,334 Spring 9,301 2.0% 5.1% 3.1% 2.2% -2.7% -1.6% -10.0% 1,817 1,794 1,804 1,761 1,721 1,770 1,871 3.4% -1.3% 0.6% -2.4% -2.3% 2.9% 5.7% 567 1,784 484 1,906 285 1,957 274 1,963 201 2,436 211 2,480 209 2,530 1.6% 1.7% -6.2% -0.2% 17.9% 2.1% 1.8% 14,423 14,601 14,790 14,855 14,795 13,911 0.4% -0.4% -6.0% 13,910 2.1% 3.7% 1.2% 1.3% Source: Actuals from student profile. 85
Lowell: Enrollment by New v Continuing Lowell Undergraduate (FTEs) New Actual FY2016 FY2017 FY2018 FY2019 FY2020 FY2021 2,704 2,673 2,884 3,029 3,223 2,845 % Change Continuing 6,847 % Change Undergraduate Total % Change 9,551 Budget FY2022 Fall Spring 2,800 2,548 -1.1% 7.9% 5.0% 6.4% -11.7% -1.6% 7,069 7,356 7,526 7,569 7,651 7,534 6,753 3.2% 4.1% 2.3% 0.6% 1.1% -1.5% -10.4% 10,240 10,555 10,792 10,496 10,334 9,301 -2.7% -1.5% -11.4% 9,742 2.0% 5.1% 3.1% 2.2% -9.0% Source: Actuals from student profile. 86
Lowell: Enrollment by Residency Lowell Students (FTEs) In State Actual FY2016 FY2017 FY2018 FY2019 FY2020 FY2021 10,686 10,890 11,465 11,792 12,080 12,138 % Change Out of State 2,935 % Change Total Budget FY2022 13,620 % Change Fall 12,145 Spring 11,249 1.9% 5.3% 2.9% 2.4% 0.5% 0.1% -7.4% 3,020 2,959 2,809 2,711 2,717 2,650 2,662 2.9% -2.0% -5.0% -3.5% 0.2% -2.5% 0.5% 14,423 14,601 14,790 14,855 14,795 13,911 0.4% -0.4% -6.0% 13,910 2.1% 3.7% 1.2% 1.3% Source: Actuals from student profile. 87
Lowell: Staffing & Staffing Ratios Employee FTEs Restricted Faculty Staff Total Restricted Unrestricted General University Ops Faculty Staff Executive/Admin/Managerial Professional Nonfaculty Secretarial/Clerical Technical/Paraprofessional Skilled Crafts Service Maintenance Workers Unspecified Total General University Ops Unrestricted Aux./Independent Business Faculty Staff Total Aux./Independent Business Total Faculty & Staff # Change Actual FY2018 FY2019 FY2020 FY2021 Budget FY2022 7 74 81 8 82 91 15 88 102 16 98 114 16 98 114 825 979 63 658 52 68 52 86 837 974 70 678 50 67 43 65 839 988 74 687 51 67 43 66 767 841 68 576 35 62 38 62 801 975 1,804 1,811 1,827 1,608 1,776 40 40 75 75 71 71 60 60 70 70 1,925 1,976 1,999 1,782 1,960 (217) 177 51 23 Student - Faculty Student (FTE) Faculty (FTE) Student-Faculty Ratio Staff - Faculty (All) Staff (FTE) Faculty (FTE) Staff-Faculty Ratio Staff - Faculty (E&G) Staff (FTE) Faculty (FTE) Staff-Faculty Ratio (E&G) Actual FY2018 FY2019 FY2020 FY2021 Budget FY2022 14,423 14,601 14,790 14,855 832 845 853 783 17.3 17.3 17.3 19.0 14,795 817 18.1 1,093 832 1.3 1,106 845 1.3 1,100 853 1.3 1,013 783 1.3 1,082 817 1.3 979 825 1.2 974 873 1.1 988 864 1.1 841 843 1.0 975 828 1.2 Note: Historical actuals are as of 9/30; FY22 staffing includes 178 vacant positions filled; no new positions proposed 88
Lowell: Key Ratios Key Ratio Operating Margin (%) Operating Margin ( ) Operating Cash Flow Margin (%) Operating Cash Flow Margin ( ) Actual FY2016 FY2017 FY2018 FY2019 FY2020 0.2% 2.2% 1.5% 1.3% -0.6% 696 9,424 6,785 6,134 (2,700) FY2021 Budget Q3 Proj. 0.0% 2.6% 12,348 Budget FY2022 -1.7% (8,831) 12.8% 51,839 14.6% 62,350 14.3% 64,009 14.7% 69,416 13.1% 61,446 14.4% 60,502 15.8% 71,170 8.3% 38,559 Debt Service Burden (%) 7.5% 7.3% 7.4% 7.7% 6.8% 7.9% 5.1% 6.5% Debt Service Coverage (x) 1.7 2.0 1.9 1.9 1.9 1.8 3.0 1.1 0.27 0.27 534,877 534,877 0.26 552,978 Financial Leverage (x) Total Debt ( in thousands) Spendable Cash & Investments to Op Expenses (x) Enrollment Enrollment (% Change) 0.28 0.26 0.25 0.24 0.26 491,078 487,253 500,656 556,087 552,657 0.34 0.31 0.29 0.29 0.30 0.37 0.32 0.29 13,620 6.1% 13,910 2.1% 14,423 3.7% 14,601 1.2% 14,790 1.3% 14,855 0.4% 14,855 0.4% 14,795 -0.4% Combined operating margin FY2122 3.5M; 0.4% *Q3 projected debt service reflects restructured FY21 principal resulting in lower total debt service 89
Medical School 90
Medical: Revenue & Expenses ( in Thousands) Revenues Gross Tuition & Fees Tuition Discounts Discount Rate Net Tuition & Fees Grants Sales & Service, Educational Auxiliary Enterprises Other Operating State appropriations Other NonOperating Independent Business Lines Total Revenues % Growth ( in Thousands) Expenses Salaries & Fringe Non-personnel Scholarships and fellowships Depreciation Interest Total Expenses % Growth FY2020 37,769 (5,139) 13.6% 32,630 280,279 17,190 32,675 194,723 57,396 26,059 280,620 921,572 2.0% FY2021 Budget Q3 Proj. 38,437 38,616 (5,065) (5,089) 29.2% 29.2% 33,372 33,527 284,064 367,241 12,828 14,566 32,551 31,039 188,117 169,473 51,382 56,907 21,369 29,486 298,710 277,918 922,393 980,157 0.1% 6.4% Variance (to FY21 Q3) FY2022 Budget % 40,176 1,560 4.0% (5,967) (878) 17.3% 14.9% 34,209 682 2.0% 331,171 (36,070) -9.8% 18,158 3,592 24.7% 35,254 4,215 13.6% 191,314 21,841 12.9% 56,867 (40) -0.1% 30,119 633 2.1% 285,240 7,322 2.6% 982,332 2,175 0.2% 0.2% Actual FY2016 FY2017 FY2018 FY2019 FY2020 407,159 407,304 416,112 433,752 438,008 484,916 439,960 435,266 343,729 369,200 65,133 64,801 65,013 64,722 65,478 30,658 30,067 26,753 24,830 19,256 987,866 942,132 943,144 867,033 891,942 21.7% -4.6% 0.1% -8.1% 2.9% FY2021 Budget Q3 Proj. 454,402 445,588 377,269 423,878 586 62,601 64,148 21,109 18,551 915,381 952,752 2.6% 6.8% Variance (to FY21 Q3) FY2022 Budget % 476,759 31,171 7.0% 398,028 (25,850) -6.1% (586) -100.0% 65,876 1,728 2.7% 19,826 1,275 6.9% 960,489 7,738 0.8% 0.8% FY2016 20,881 (2,269) 10.9% 18,612 258,499 12,443 29,271 258,246 50,634 5,699 330,259 963,663 24.5% FY2017 24,206 (2,751) 11.4% 21,455 275,662 12,790 29,626 190,611 52,250 37,945 371,618 991,957 2.9% Actual FY2018 28,609 (3,320) 11.6% 25,289 269,721 14,023 30,797 268,909 54,560 27,800 274,555 965,654 -2.7% FY2019 34,681 (4,235) 12.2% 30,446 286,603 15,023 31,561 183,268 57,959 32,008 266,509 903,377 -6.4% Note: Total revenue includes unrealized gains/losses that are excluded from the operating margin calculation; 91 total expenses excludes the impact of GASB 68&75 consistent with the operating margin calculation
Medical: Enrollment by Career Medical School Students (FTEs) Graduate Actual FY2016 FY2017 FY2018 1,056 1,070 1,074 % Change Total 1,056 % Change Budget FY2019 1,153 FY2020 1,195 FY2021 1,242 FY2022 1,252 1.3% 0.4% 7.3% 3.7% 3.9% 0.8% 1,070 1,074 1,153 1,195 1,242 1,252 1.3% 0.4% 7.3% 3.7% 3.9% 0.8% Source: Actuals from student profile. 92
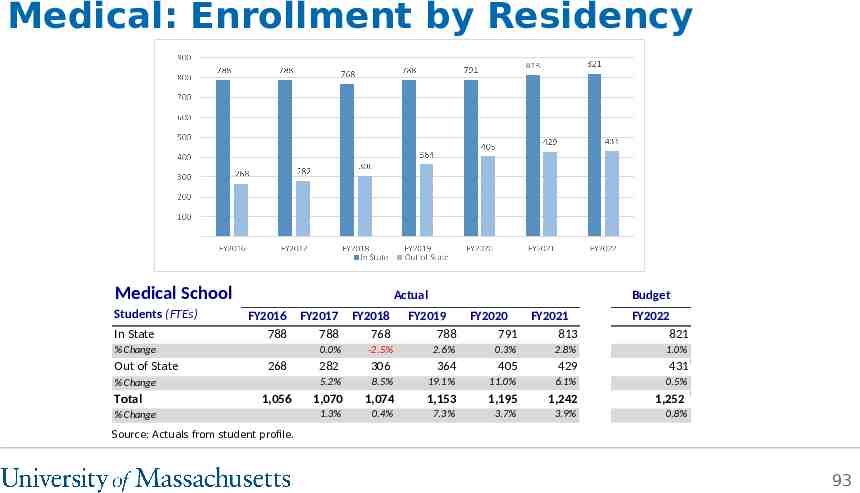
Medical: Enrollment by Residency Medical School Students (FTEs) In State Actual FY2016 FY2017 FY2018 788 788 768 % Change Out of State 268 % Change Total 1,056 % Change Budget FY2019 788 2.6% FY2020 FY2021 791 813 0.3% 2.8% FY2022 821 0.0% -2.5% 1.0% 282 306 364 405 429 431 5.2% 8.5% 19.1% 11.0% 6.1% 0.5% 1,070 1,074 1,153 1,195 1,242 1,252 1.3% 0.4% 7.3% 3.7% 3.9% 0.8% Source: Actuals from student profile. 93
Medical: Staffing & Staffing Ratios Employee FTEs Restricted Faculty Staff Total Restricted Actual FY2018 FY2019 FY2020 FY2021 Budget FY2022 239 852 1,091 250 854 1,104 243 876 1,118 241 855 1,096 246 858 1,104 Unrestricted General University Ops Faculty Staff Executive/Admin/Managerial Professional Nonfaculty Secretarial/Clerical Technical/Paraprofessional Skilled Crafts Service Maintenance Workers Unspecified Total General University Ops 220 1,009 58 666 126 94 12 54 216 1,018 53 691 120 90 12 52 211 1,024 56 727 96 86 9 49 221 996 51 731 69 88 10 47 233 1,003 1,229 1,234 1,234 1,217 1,236 Unrestricted Aux./Independent Business Faculty Staff Total Aux./Independent Business 15 1,241 1,256 13 1,302 1,315 10 1,316 1,326 11 1,320 1,331 10 1,302 1,312 3,576 3,653 3,679 3,644 3,652 76 26 (35) 8 Total Faculty & Staff # Change Actual FY2018 FY2019 FY2020 FY2021 Budget FY2022 Student - Faculty Student (FTE) Faculty (FTE) Student-Faculty Ratio 1,074 473 2.3 1,153 479 2.4 1,195 463 2.6 1,242 473 2.6 1,252 489 2.6 Staff - Faculty (All) Staff (FTE) Faculty (FTE) Staff-Faculty Ratio 3,103 473 6.6 3,174 479 6.6 3,215 463 6.9 3,170 473 6.7 3,163 489 6.5 Staff - Faculty (E&G) Staff (FTE) Faculty (FTE) Staff-Faculty Ratio (E&G) 1,009 220 4.6 1,018 216 4.7 1,024 211 4.9 996 221 4.5 1,003 233 4.3 Note: Historical actuals are as of 9/30 94
Medical: Key Ratios Key Ratio Actual FY2017 FY2018 FY2019 3.2% 2.2% 3.5% 30,671 21,155 31,849 FY2020 3.0% 27,308 8.7% 85,444 12.8% 124,814 11.5% 110,201 13.7% 123,144 12.6% 116,794 10.4% 96,021 11.3% 110,412 10.8% 106,068 Debt Service Burden (%) 5.2% 6.0% 5.1% 5.5% 4.9% 4.7% 2.3% 5.2% Debt Service Coverage (x) 1.7 2.2 2.3 2.6 2.7 2.3 5.1 2.1 0.34 684,484 0.42 661,505 0.64 636,468 0.72 607,744 0.64 668,225 0.68 643,156 0.71 643,156 0.65 751,471 0.23 0.30 0.43 0.50 0.48 0.48 0.48 0.51 1,056 -1.4% 1,070 1.3% 1,074 0.4% 1,153 7.3% 1,195 3.7% 1,204 0.7% 1,242 3.9% 1,252 0.8% Operating Margin (%) Operating Margin ( ) Operating Cash Flow Margin (%) Operating Cash Flow Margin ( ) Financial Leverage (x) Total Debt ( in thousands) Spendable Cash & Investments to Op Expenses (x) Enrollment Enrollment (% Change) FY2016 -1.1% (10,599) FY2021 Budget Q3 Proj. 0.5% 2.6% 5,052 25,446 Budget FY2022 2.0% 19,629 *Q3 projected debt service reflects restructured FY21 principal resulting in lower total debt service 95
President’s Office 96
President’s Office: Revenue & Expenses ( in Thousands) Revenues Gross Tuition & Fees Tuition Discounts Discount Rate Net Tuition & Fees Grants Sales & Service, Educational Auxiliary Enterprises Other Operating State appropriations Other NonOperating Total Revenues % Growth ( in Thousands) Expenses Salaries & Fringe Non-personnel Scholarships and fellowships Depreciation Interest Total Expenses % Growth Actual FY2021 FY2016 FY2017 FY2018 FY2019 FY2020 5,204 6,461 6,144 6,802 6,202 0.0% 0.0% 0.0% 0.0% 0.0% 5,204 6,461 6,144 6,802 6,202 13,848 18,644 20,651 20,019 21,664 2,253 2,192 2,154 3,255 26 78,416 80,649 83,159 80,662 83,339 890 704 160 636 362 7,010 9,009 6,951 13,104 4,086 107,621 117,659 119,219 124,478 115,679 7.8% 9.3% 1.3% 4.4% -7.1% Budget 6,136 0.0% 6,136 22,599 84,194 365 8,272 121,566 5.1% Q3 Proj. 6,252 0.0% 6,252 14,222 68 78,685 400 9,129 108,756 -6.0% Actual FY2016 FY2017 FY2018 FY2019 FY2020 56,575 60,838 60,023 60,409 65,444 35,026 34,936 40,025 45,385 41,612 6 25 9,240 9,439 3,719 3,008 2,566 3,897 3,700 3,009 3,161 2,961 104,744 108,938 106,776 111,963 112,583 7.6% 4.0% -2.0% 4.9% 0.6% FY2021 Budget Q3 Proj. 67,702 60,154 47,528 35,391 3,580 1,720 2,756 2,829 121,566 100,094 8.0% -11.1% FY2022 Budget 6,636 0.0% 6,636 110 91,826 6,494 105,067 -3.4% Variance (to FY21 Q3) 384 - % 6.1% - 384 (14,112) (68) 13,141 (400) (2,635) (3,689) 6.1% -99.2% 16.7% -28.9% -3.4% FY2022 Variance (to FY21 Q3) Budget % 58,292 (1,862) -3.1% 38,974 3,583 10.1% 1,739 19 1.1% 2,635 (194) -6.8% 101,641 1,546 1.5% 1.5% Note: Total revenue includes unrealized gains/losses that are excluded from the operating margin calculation; 97 total expenses excludes the impact of GASB 68&75 consistent with the operating margin calculation
President’s Office: Staffing Employee FTEs Restricted Faculty Staff Total Restricted Unrestricted General University Ops Faculty Staff Executive/Admin/Managerial Professional Nonfaculty Secretarial/Clerical Technical/Paraprofessional Skilled Crafts Service Maintenance Workers Unspecified Total General University Ops Unrestricted Aux./Independent Business Faculty Staff Total Aux./Independent Business Total Faculty & Staff # Change Actual FY2019 FY2020 FY2018 Budget FY2022 FY2021 69 69 73 73 88 88 - - 323 68 214 28 13 323 311 71 205 25 11 311 297 77 195 22 4 297 296 80 179 35 2 296 332 332 - - - - - 392 384 385 296 332 (8) 1 (89) 36 Note: Historical actuals are as of 9/30; FY22 staffing includes 26.5 vacant positions filled; 12 new positions proposed; UMDI included FY2018 through FY2020 98
President’s Office: Key Ratios Key Ratio Operating Margin (%) Operating Margin ( ) Operating Cash Flow Margin (%) Operating Cash Flow Margin ( ) FY2016 0.7% 702 Actual FY2017 FY2018 FY2019 6.4% 10.4% 8.9% 7,470 12,443 10,878 FY2020 4.1% 4,792 FY2021 Budget Q3 Proj. 0.0% 8.0% 0 8,662 Budget FY2022 3.3% 3,426 16.4% 17,916 18.2% 21,256 17.5% 21,177 12.0% 14,473 12.2% 14,812 5.2% 6,336 12.1% 13,210 7.4% 7,801 Debt Service Burden (%) 3.7% 3.4% 2.8% 4.5% 4.4% 4.2% 5.1% 5.0% Debt Service Coverage (x) 4.6 5.7 7.0 2.8 3.0 1.2 2.6 1.5 1.95 77,374 2.35 80,445 2.46 84,734 2.72 86,615 2.64 87,961 2.64 87,961 2.64 87,961 2.64 87,961 1.44 1.74 1.95 2.10 2.06 2.32 2.29 2.29 Financial Leverage (x) Total Debt ( in thousands) Spendable Cash & Investments to Op Expenses (x) 99