The Canopies Algorithm from “Efficient Clustering of High-Dimensional

13 Slides64.00 KB
The Canopies Algorithm from “Efficient Clustering of High-Dimensional Data Sets with Application to Reference Matching” Andrew McCallum, Kamal Nigam, Lyle H. Unger Presented by Danny Wyatt
Record Linkage Methods As classification [Felligi & Sunter] Data point is a pair of records Each pair is classified as “match” or “not match” Post-process with transitive closure As clustering Data point is an individual record All records in a cluster are considered a match No transitive closure if no cluster overlap
Motivation Either way, n2 such evaluations must be performed Evaluations can be expensive Many features to compare Costly metrics (e.g. string edit distance) Non-matches far outnumber matches Can we quickly eliminate obvious non- matches to focus effort?
Canopies A fast comparison groups the data into overlapping “canopies” The expensive comparison for full clustering is only performed for pairs in the same canopy No loss in accuracy if: “For every traditional cluster, there exists a canopy such that all elements of the cluster are in the canopy”
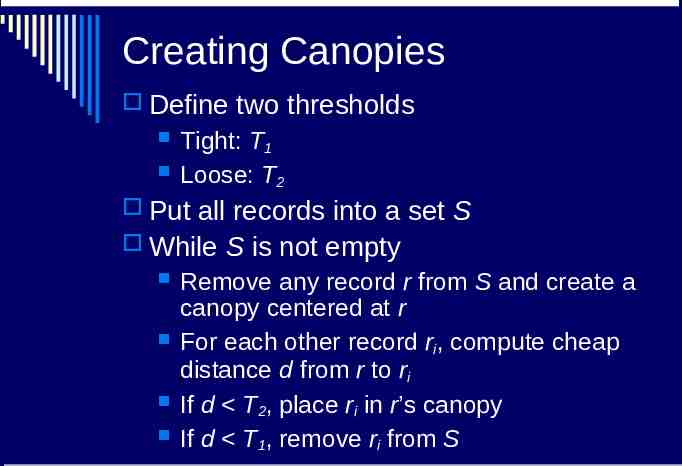
Creating Canopies Define two thresholds Tight: T1 Loose: T2 Put all records into a set S While S is not empty Remove any record r from S and create a canopy centered at r For each other record ri, compute cheap distance d from r to ri If d T2, place ri in r’s canopy If d T1, remove ri from S
Creating Canopies Points can be in more than one canopy Points within the tight threshold will not start a new canopy Final number of canopies depends on threshold values and distance metric Experimental validation suggests that T1 and T2 should be equal
Canopies and GAC Greedy Agglomerative Clustering Make fully connected graph with a node for each data point Edge weights are computed distances Run Kruskal’s MST algorithm, stopping when you have a forest of k trees Each tree is a cluster With Canopies Only create edges between points in the same canopy Run as before
EM Clustering Create k cluster prototypes c1 ck Until convergence Compute distance from each record to each prototype ( O(kn) ) Use that distance to compute probability of each prototype given the data Move the prototypes to maximize their probabilities
Canopies and EM Clustering Method 1 Distances from prototype to data points only computed within a canopies containing the prototype Note that prototypes can cross canopies Method 2 Same as one, but also use all canopy centers to account for outside data points Method 3 Same as 1, but dynamically create and destroy prototypes using existing techniques
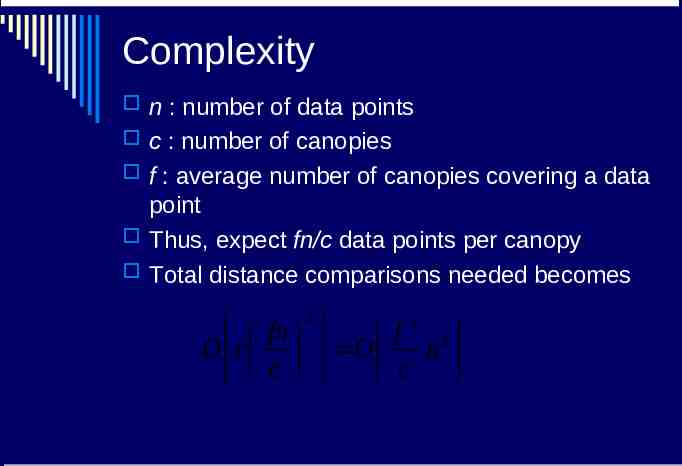
Complexity n : number of data points c : number of canopies f : average number of canopies covering a data point Thus, expect fn/c data points per canopy Total distance comparisons needed becomes 2 fn 2 f 2 O c O n c c
Reference Matching Results Labeled subset of Cora data 1916 citations to 121 distinct papers Cheap metric Based on shared words in citations Inverted index makes finding that fast Expensive metric Customized string edit distance between extracted author, title, date, and venue fields GAC for final clustering
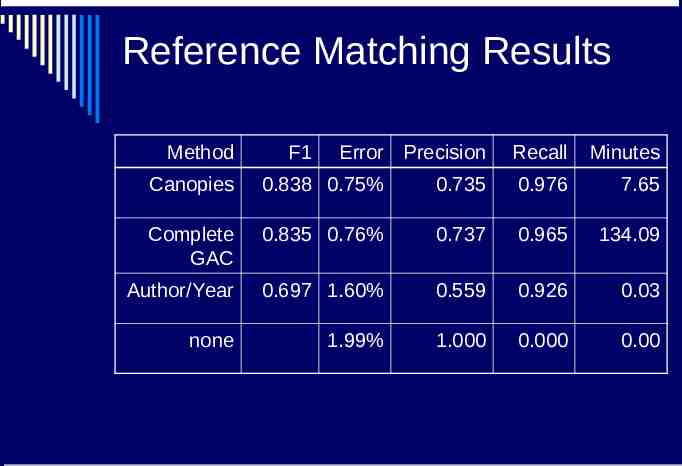
Reference Matching Results Method F1 Error Precision Recall Minutes Canopies 0.838 0.75% 0.735 0.976 7.65 Complete GAC 0.835 0.76% 0.737 0.965 134.09 Author/Year 0.697 1.60% 0.559 0.926 0.03 none 1.99% 1.000 0.000 0.00
Discussion How do cheap and expensive distance metrics interact? Ensure the canopies property Maximize number of canopies Minimize overlap Probabilistic extraction, probabilistic clustering How do the two interact? Canopies and classification-based linkage Only calculate pair data points for records in the same canopy