TEXAS Joanie Rethlake Sridevi Rangineni Elizabeth Thompson January 16,


21 Slides789.83 KB
TEXAS Joanie Rethlake Sridevi Rangineni Elizabeth Thompson January 16, 2013 1
A Comparison of Student Outcomes for Credential and Non-Credential Teachers 2
Research Questions 1. Do students in classes taught by teachers who have a Texas Teacher Credential have greater persistence than students taught by teachers without the Texas Teacher Credential? 2. Do students in classes taught by teachers who have a Texas Teacher Credential have more level completions than students taught by teachers without the Texas Teacher Credential? 3
Texas Teacher Credential Optional Open to teachers of record in AEFLA-funded programs Based upon professional development and critical self-reflection Emphasizes link between current adult education theory and professional practice Participants earn 130 points across six content areas Teachers create professional development plans that address individual needs based on the six content areas 4
Texas Teacher Credential Core Content Areas Principles of Adult Learning Adult Learning Transaction Diverse Learning Styles, Abilities and Cultures Integrating Technology into Adult Learning Accountability and Assessment Contextual Learning 5
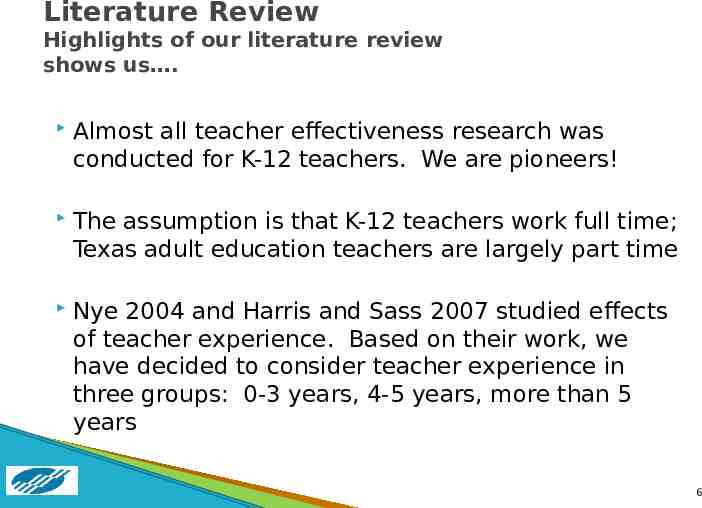
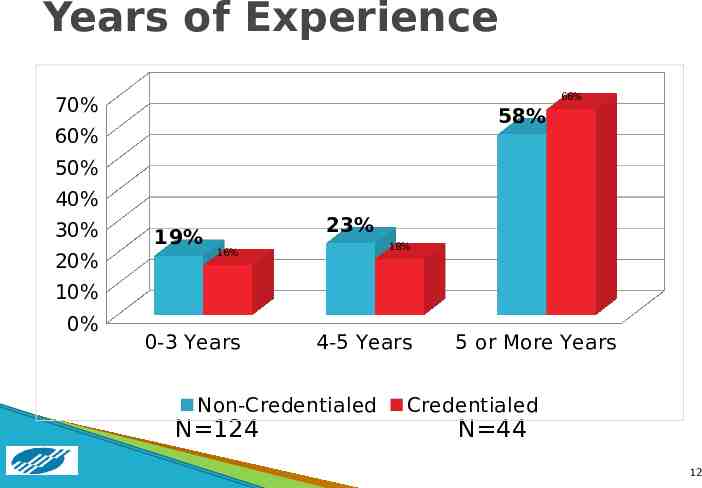
Literature Review Highlights of our literature review shows us . Almost all teacher effectiveness research was conducted for K-12 teachers. We are pioneers! The assumption is that K-12 teachers work full time; Texas adult education teachers are largely part time Nye 2004 and Harris and Sass 2007 studied effects of teacher experience. Based on their work, we have decided to consider teacher experience in three groups: 0-3 years, 4-5 years, more than 5 years 6
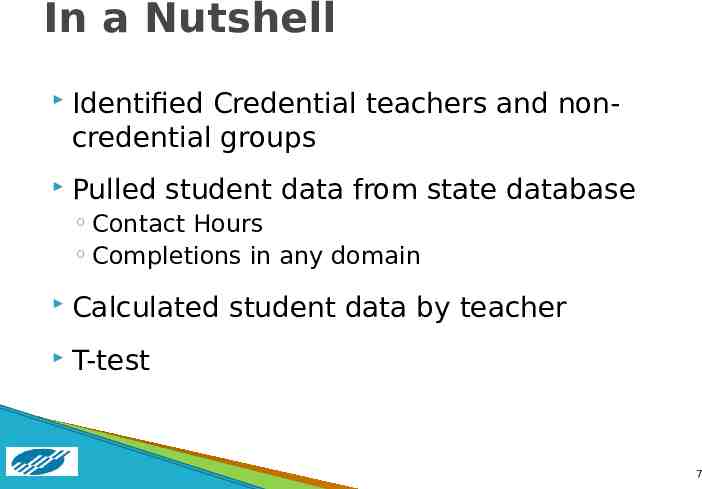
In a Nutshell Identified Credential teachers and noncredential groups Pulled student data from state database Contact Hours Completions in any domain Calculated student data by teacher T-test 7
About the Credential Group (Treatment Group) Completed Teacher Credential on or before June 30, 2011 Active in the 2011-2012 year Assigned to a class in 2011-2012 44 Teachers 8
About the Non-Credential Group (Control Group) Active in the 2011-2012 year Assigned to a class in 2011-2012 Matched to the Treatment Group on three variables: Years of experience Employment Status Level of Education (Degree) Three Control teachers for every teacher in the Treatment Group 132 teachers to start 9
Adjustments to Non-Credential Group (Control Group) 4 teachers removed – team taught with a teacher not in this study during the project year 2 teachers removed because they began and completed the credential during the project year 2 teachers removed because they were assigned to 7-8 classes during the year. Final number: 124 10
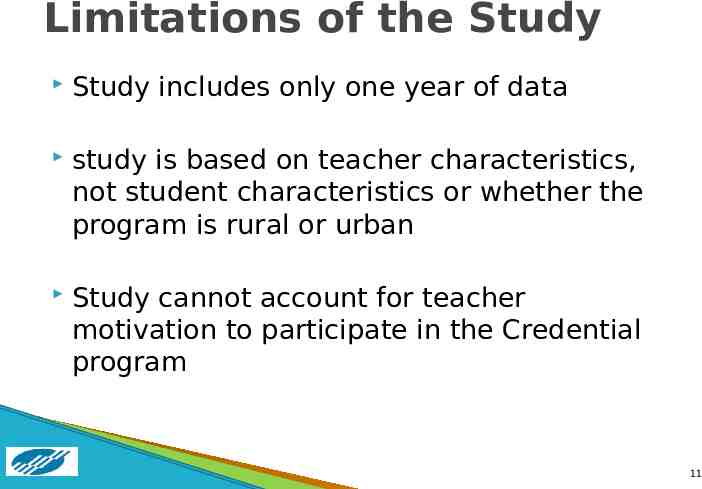
Limitations of the Study Study includes only one year of data study is based on teacher characteristics, not student characteristics or whether the program is rural or urban Study cannot account for teacher motivation to participate in the Credential program 11
Years of Experience 66% 70% 58% 60% 50% 40% 30% 20% 19% 23% 18% 16% 10% 0% 0-3 Years 4-5 Years Non-Credentialed N 124 5 or More Years Credentialed N 44 12
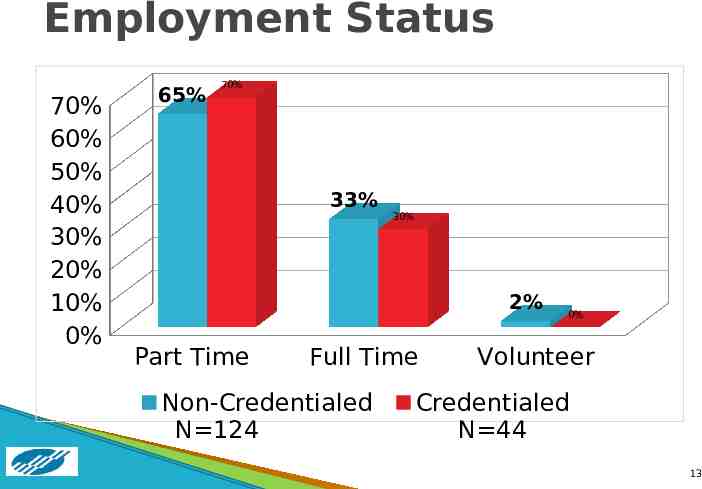
Employment Status 70% 60% 50% 40% 30% 20% 10% 0% 65% 70% 33% 30% 2% Part Time Full Time Non-Credentialed N 124 0% Volunteer Credentialed N 44 13
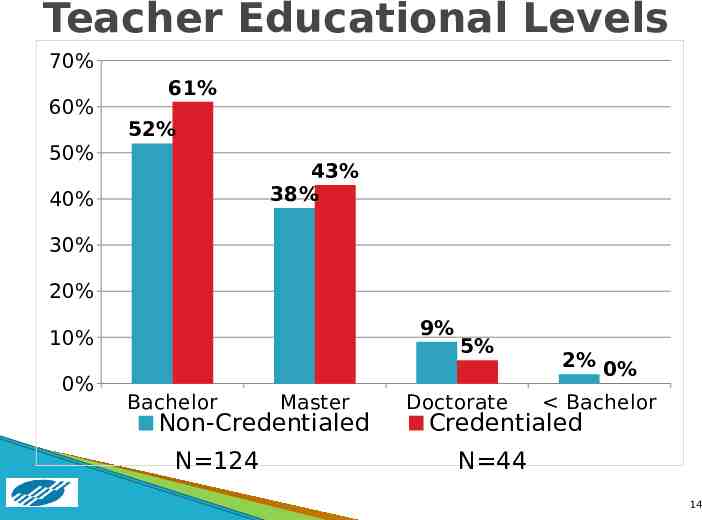
Teacher Educational Levels 70% 60% 61% 52% 50% 43% 38% 40% 30% 20% 9% 10% 0% Bachelor Master Non-Credentialed N 124 5% Doctorate 2% 0% Bachelor Credentialed N 44 14
Observations Average Yrs Experience 2011-2012 PD Hours/teacher Contact hours/student Participants /teacher NonCredential Credentia l 8.4 8.5 24.5 57 85 80 69 91 15
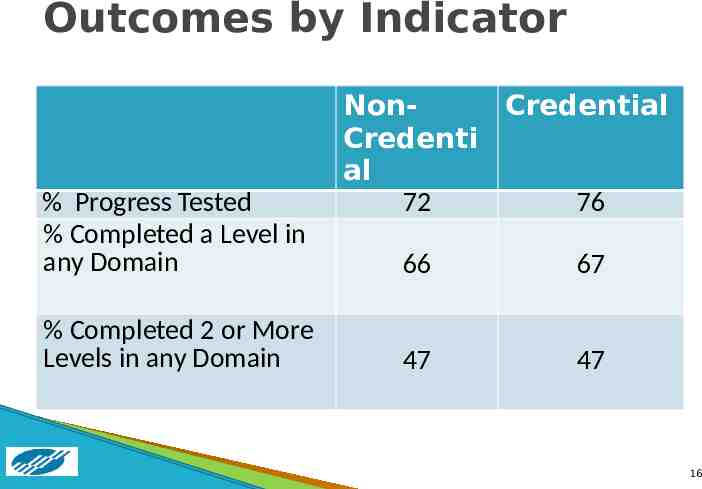
Outcomes by Indicator % Progress Tested % Completed a Level in any Domain % Completed 2 or More Levels in any Domain NonCredential Credenti al 72 76 66 67 47 47 16
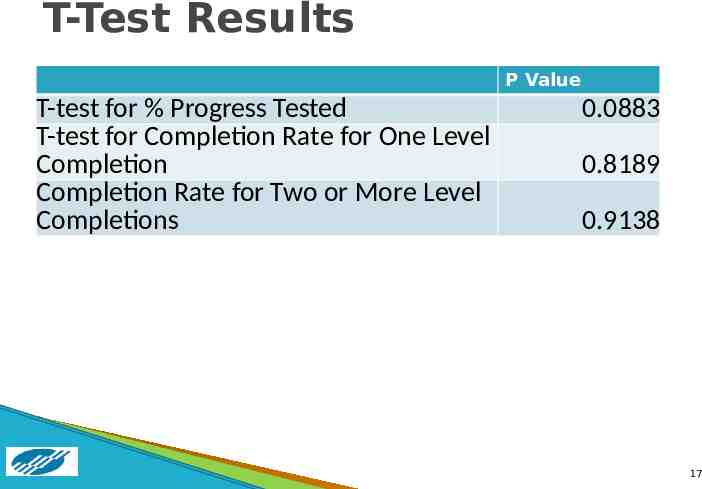
T-Test Results P Value T-test for % Progress Tested T-test for Completion Rate for One Level Completion Completion Rate for Two or More Level Completions 0.0883 0.8189 0.9138 17
Conclusions Credentialed teachers continue participating in professional development at more than double the rate of their noncredentialed peers Students in classes taught by credentialed teachers are progress tested at a slightly higher rate than those taught by noncredentialed teachers Credentialed teachers teach more students/teacher 18
Also of Note No way to quantify teacher confidence/satisfaction in the classroom Need data over several years to evaluate rates of teacher turnover for the two groups Data under additional review 19
Implications for Application Share results with the credential project staff and develop observations/recommendations Share results with local program directors, GREAT Centers, teachers Look at teacher turnover data for 2-3 years to see if credentialed teacher turnover is decreased/increased/no change Develop follow-up questions to determine further study and/or decision to collect qualitative data 20
Texas Contact Information Joanie Rethlake, State Director [email protected] Elizabeth B. Thompson, Assistant Director [email protected] Sridevi Rangineni, Systems Analyst/Programmer [email protected] 21