Quality, Time, and the Theory of Constraints Chapter 19 2003 Prentice


63 Slides233.00 KB
Quality, Time, and the Theory of Constraints Chapter 19 2003 Prentice Hall Business Publishing, Cost Accounting 11/e, Horngren/Datar/Foster 19 - 1
Learning Objective 1 Explain the four cost categories in a cost-of-quality program. 2003 Prentice Hall Business Publishing, Cost Accounting 11/e, Horngren/Datar/Foster 19 - 2
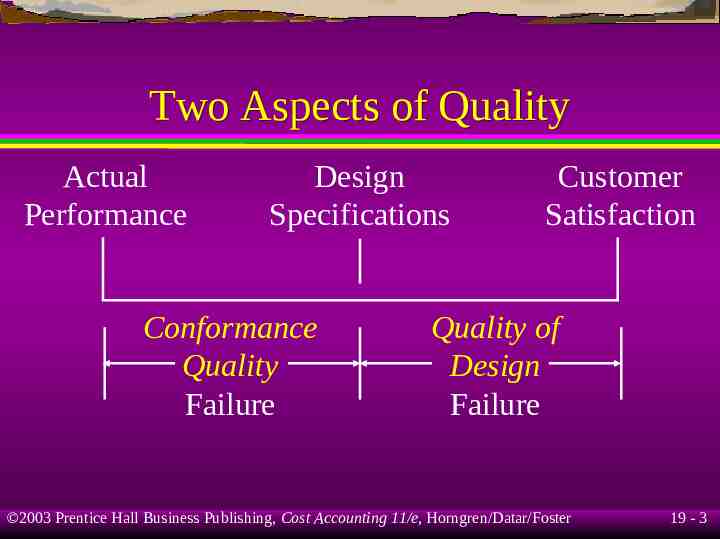
Two Aspects of Quality Actual Performance Design Specifications Conformance Quality Failure Customer Satisfaction Quality of Design Failure 2003 Prentice Hall Business Publishing, Cost Accounting 11/e, Horngren/Datar/Foster 19 - 3
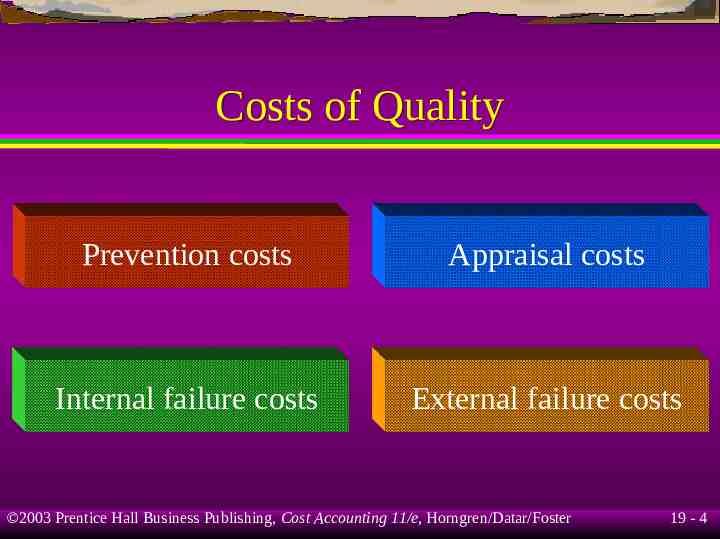
Costs of Quality Prevention costs Appraisal costs Internal failure costs External failure costs 2003 Prentice Hall Business Publishing, Cost Accounting 11/e, Horngren/Datar/Foster 19 - 4
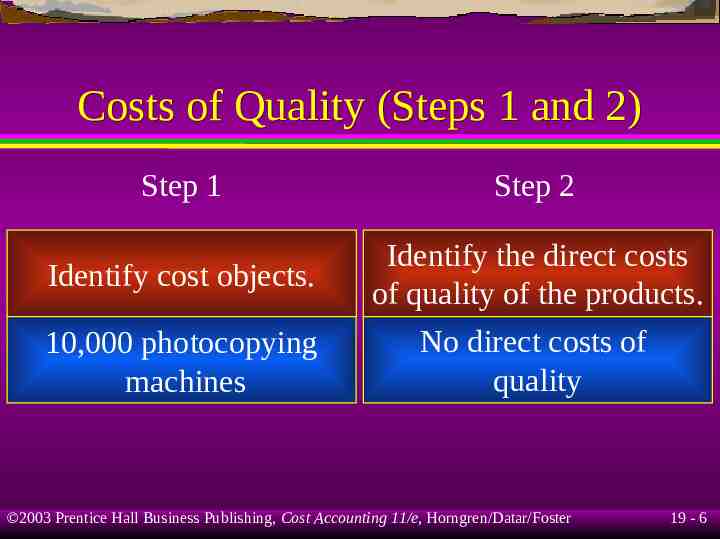
Costs of Quality Example Vegas Photo Corporation made 10,000 photocopying machines last year. Vegas Photo determines the costs of quality of its photocopying machines using a 7-step activity-based costing approach. 2003 Prentice Hall Business Publishing, Cost Accounting 11/e, Horngren/Datar/Foster 19 - 5
Costs of Quality (Steps 1 and 2) Step 1 Identify cost objects. 10,000 photocopying machines Step 2 Identify the direct costs of quality of the products. No direct costs of quality 2003 Prentice Hall Business Publishing, Cost Accounting 11/e, Horngren/Datar/Foster 19 - 6
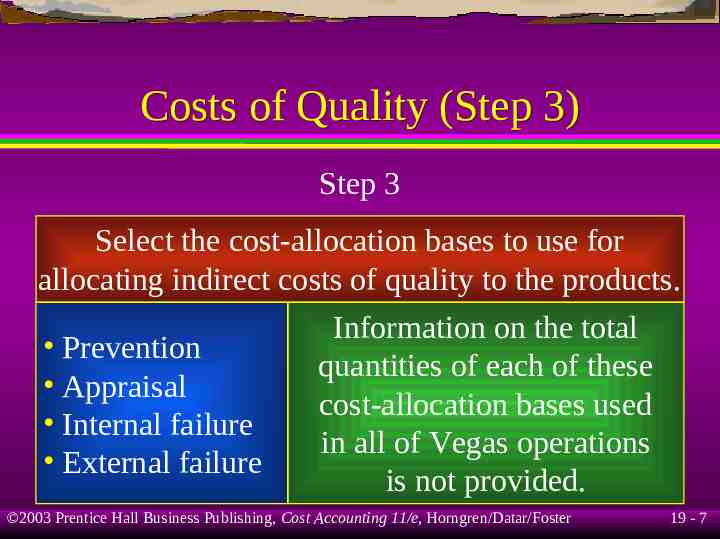
Costs of Quality (Step 3) Step 3 Select the cost-allocation bases to use for allocating indirect costs of quality to the products. Information on the total Prevention quantities of each of these Appraisal cost-allocation bases used Internal failure in all of Vegas operations External failure is not provided. 2003 Prentice Hall Business Publishing, Cost Accounting 11/e, Horngren/Datar/Foster 19 - 7
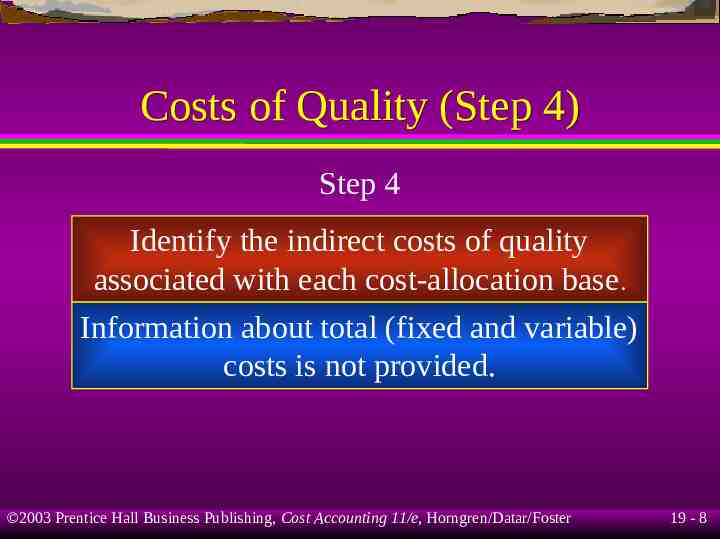
Costs of Quality (Step 4) Step 4 Identify the indirect costs of quality associated with each cost-allocation base . Information about total (fixed and variable) costs is not provided. 2003 Prentice Hall Business Publishing, Cost Accounting 11/e, Horngren/Datar/Foster 19 - 8
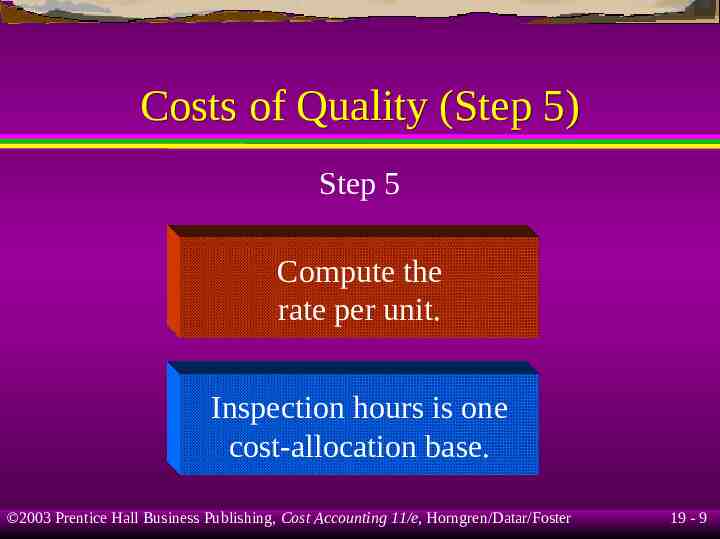
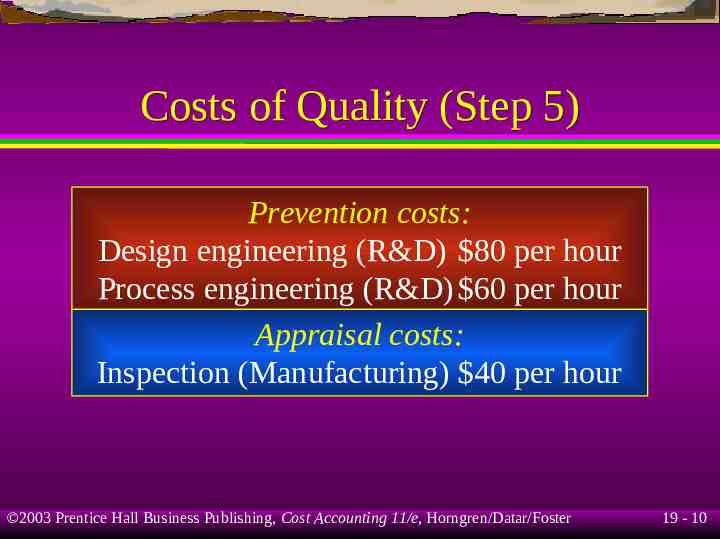
Costs of Quality (Step 5) Step 5 Compute the rate per unit. Inspection hours is one cost-allocation base. 2003 Prentice Hall Business Publishing, Cost Accounting 11/e, Horngren/Datar/Foster 19 - 9
Costs of Quality (Step 5) Prevention costs: Design engineering (R&D) 80 per hour Process engineering (R&D) 60 per hour Appraisal costs: Inspection (Manufacturing) 40 per hour 2003 Prentice Hall Business Publishing, Cost Accounting 11/e, Horngren/Datar/Foster 19 - 10
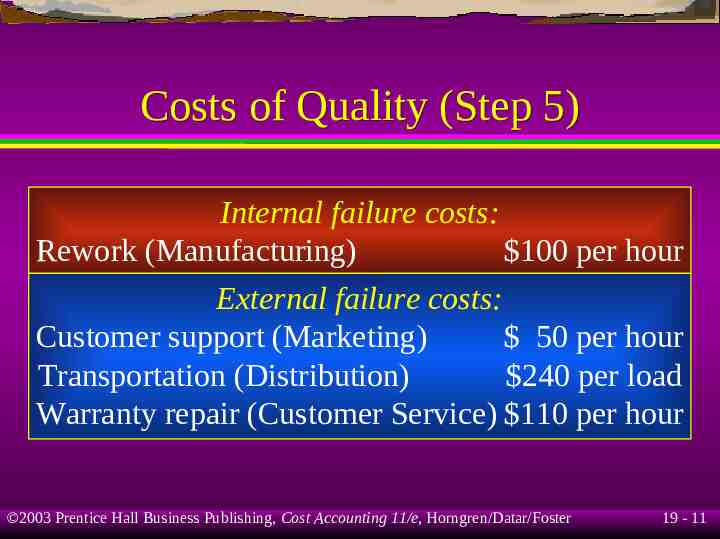
Costs of Quality (Step 5) Internal failure costs: Rework (Manufacturing) 100 per hour External failure costs: Customer support (Marketing) 50 per hour Transportation (Distribution) 240 per load Warranty repair (Customer Service) 110 per hour 2003 Prentice Hall Business Publishing, Cost Accounting 11/e, Horngren/Datar/Foster 19 - 11
Costs of Quality (Step 6) Step 6 Compute the indirect costs of quality allocated to the product. 2003 Prentice Hall Business Publishing, Cost Accounting 11/e, Horngren/Datar/Foster 19 - 12
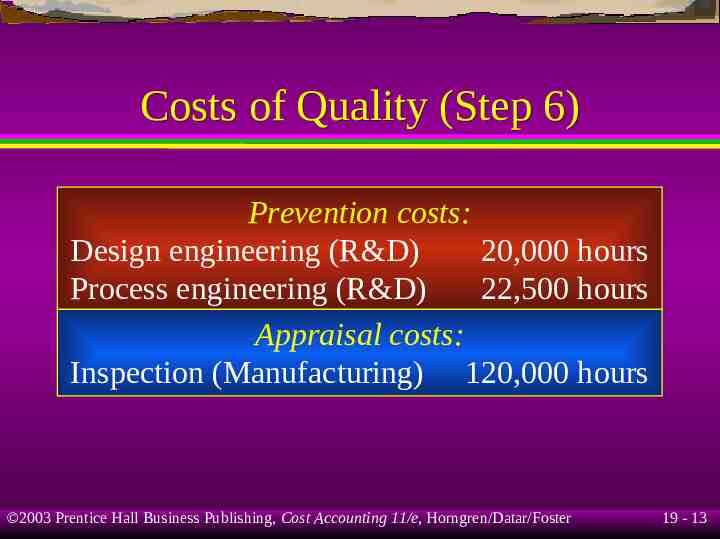
Costs of Quality (Step 6) Prevention costs: Design engineering (R&D) 20,000 hours Process engineering (R&D) 22,500 hours Appraisal costs: Inspection (Manufacturing) 120,000 hours 2003 Prentice Hall Business Publishing, Cost Accounting 11/e, Horngren/Datar/Foster 19 - 13
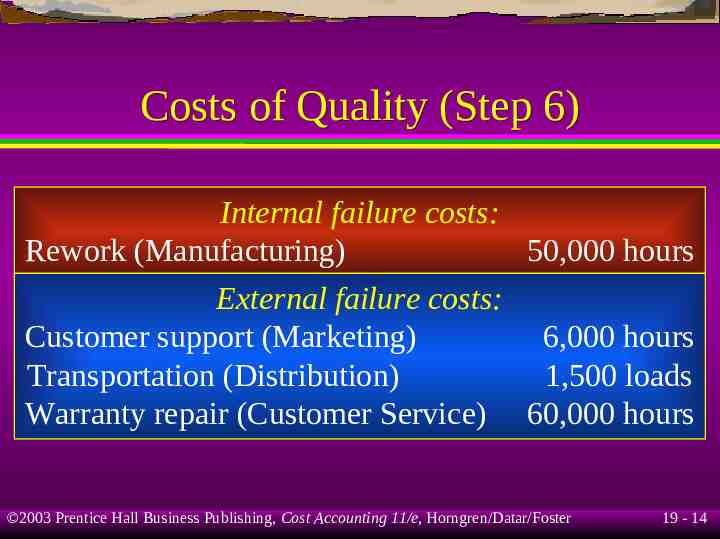
Costs of Quality (Step 6) Internal failure costs: Rework (Manufacturing) 50,000 hours External failure costs: Customer support (Marketing) 6,000 hours Transportation (Distribution) 1,500 loads Warranty repair (Customer Service) 60,000 hours 2003 Prentice Hall Business Publishing, Cost Accounting 11/e, Horngren/Datar/Foster 19 - 14
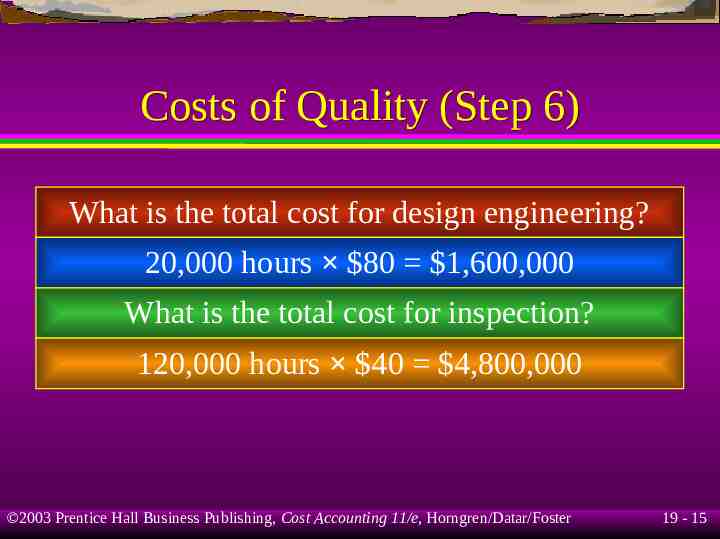
Costs of Quality (Step 6) What is the total cost for design engineering? 20,000 hours 80 1,600,000 What is the total cost for inspection? 120,000 hours 40 4,800,000 2003 Prentice Hall Business Publishing, Cost Accounting 11/e, Horngren/Datar/Foster 19 - 15
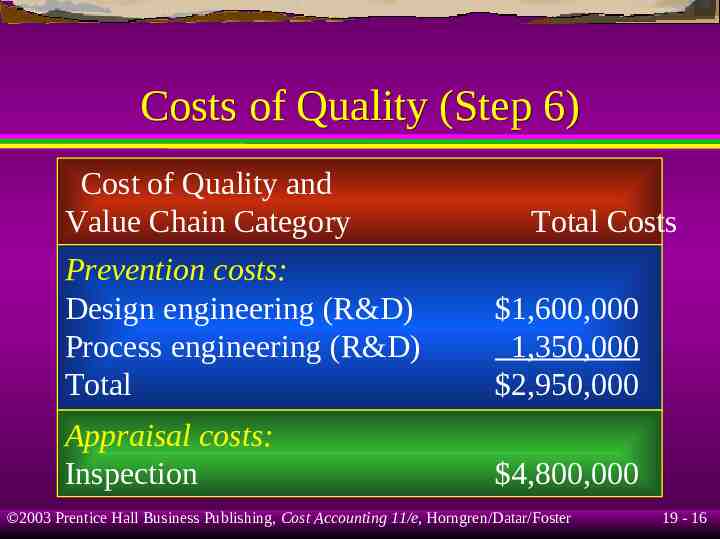
Costs of Quality (Step 6) Cost of Quality and Value Chain Category Prevention costs: Design engineering (R&D) Process engineering (R&D) Total 1,600,000 1,350,000 2,950,000 Appraisal costs: Inspection 4,800,000 Total Costs 2003 Prentice Hall Business Publishing, Cost Accounting 11/e, Horngren/Datar/Foster 19 - 16
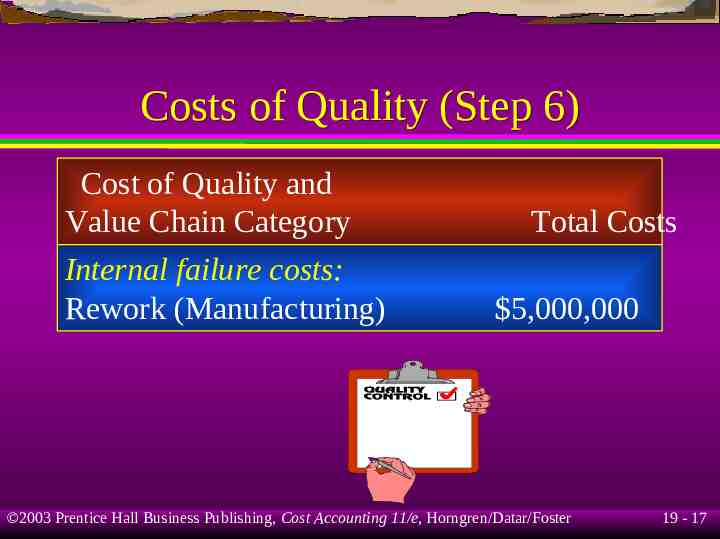
Costs of Quality (Step 6) Cost of Quality and Value Chain Category Internal failure costs: Rework (Manufacturing) Total Costs 5,000,000 2003 Prentice Hall Business Publishing, Cost Accounting 11/e, Horngren/Datar/Foster 19 - 17
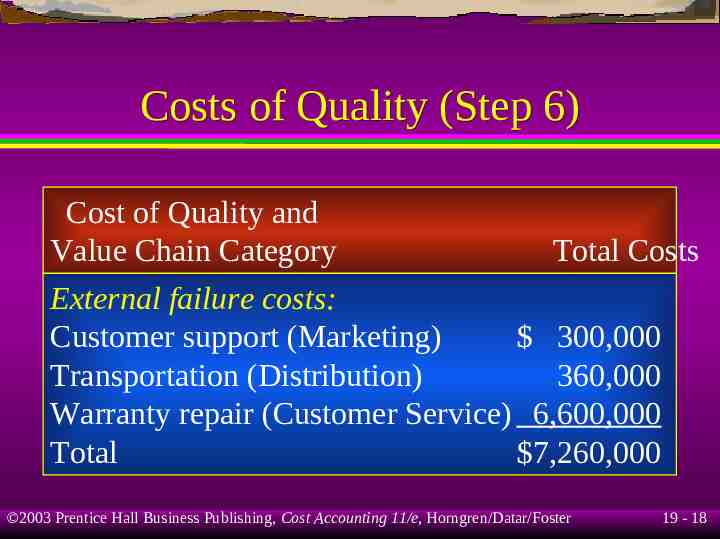
Costs of Quality (Step 6) Cost of Quality and Value Chain Category Total Costs External failure costs: Customer support (Marketing) 300,000 Transportation (Distribution) 360,000 Warranty repair (Customer Service) 6,600,000 Total 7,260,000 2003 Prentice Hall Business Publishing, Cost Accounting 11/e, Horngren/Datar/Foster 19 - 18
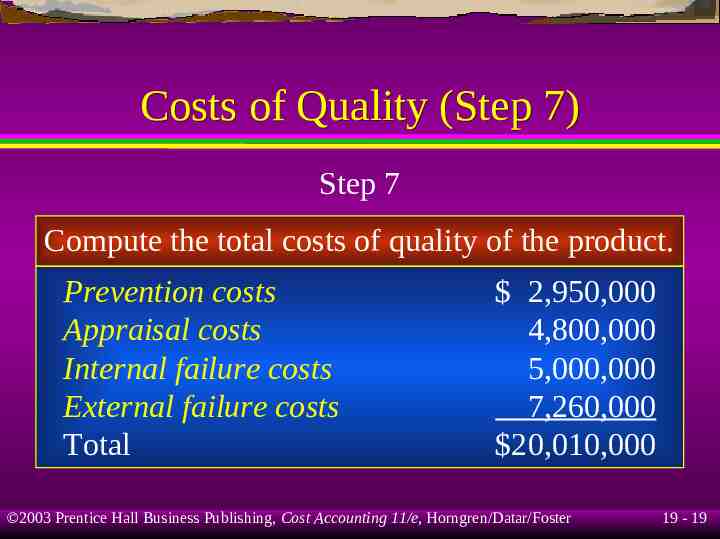
Costs of Quality (Step 7) Step 7 Compute the total costs of quality of the product. Prevention costs Appraisal costs Internal failure costs External failure costs Total 2,950,000 4,800,000 5,000,000 7,260,000 20,010,000 2003 Prentice Hall Business Publishing, Cost Accounting 11/e, Horngren/Datar/Foster 19 - 19
Learning Objective 2 Use three methods to identify quality problems. 2003 Prentice Hall Business Publishing, Cost Accounting 11/e, Horngren/Datar/Foster 19 - 20
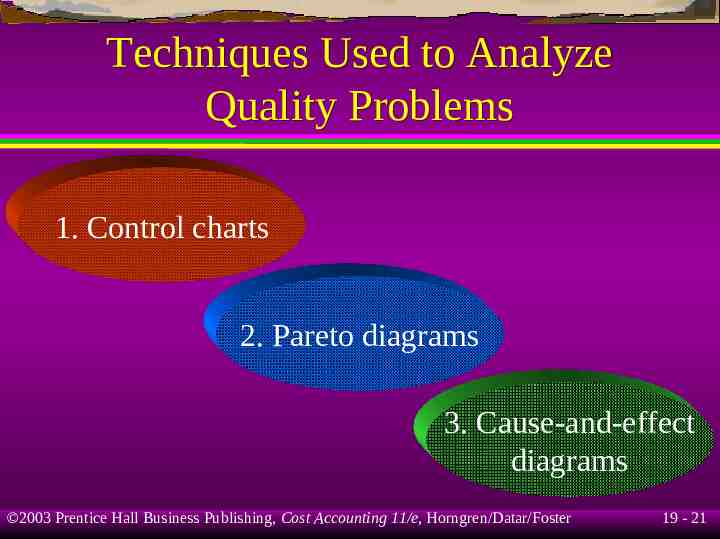
Techniques Used to Analyze Quality Problems 1. Control charts 2. Pareto diagrams 3. Cause-and-effect diagrams 2003 Prentice Hall Business Publishing, Cost Accounting 11/e, Horngren/Datar/Foster 19 - 21
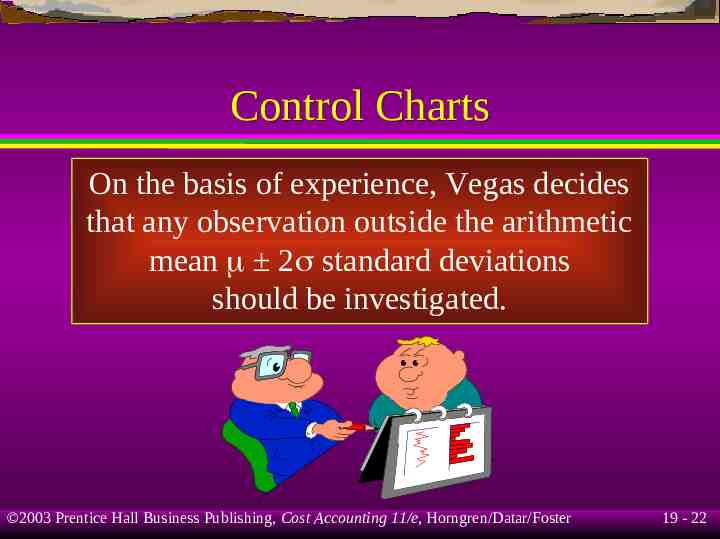
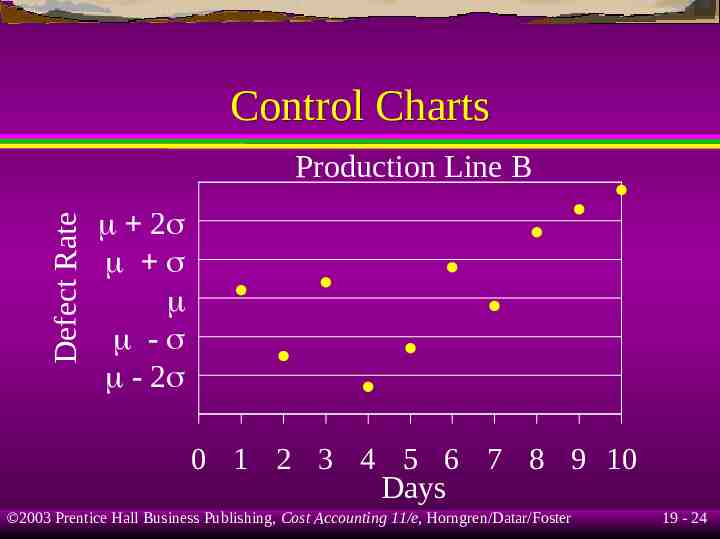
Control Charts On the basis of experience, Vegas decides that any observation outside the arithmetic mean 2 standard deviations should be investigated. 2003 Prentice Hall Business Publishing, Cost Accounting 11/e, Horngren/Datar/Foster 19 - 22
Control Charts Defect Rate Production Line A 2 - - 2 0 1 2 3 4 5 6 7 8 9 10 Days 2003 Prentice Hall Business Publishing, Cost Accounting 11/e, Horngren/Datar/Foster 19 - 23
Control Charts Defect Rate Production Line B 2 - - 2 0 1 2 3 4 5 6 7 8 9 10 Days 2003 Prentice Hall Business Publishing, Cost Accounting 11/e, Horngren/Datar/Foster 19 - 24
Pareto Diagram Number of Times Defect Observed 600 500 400 300 200 100 0 Copies are fuzzy and unclear Copies are too light/dark Paper gets jammed 2003 Prentice Hall Business Publishing, Cost Accounting 11/e, Horngren/Datar/Foster 19 - 25
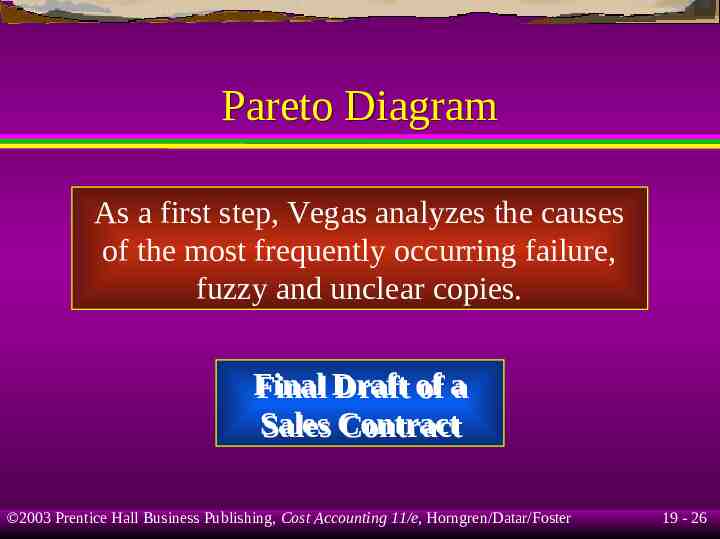
Pareto Diagram As a first step, Vegas analyzes the causes of the most frequently occurring failure, fuzzy and unclear copies. Final Draft of a Sales Contract 2003 Prentice Hall Business Publishing, Cost Accounting 11/e, Horngren/Datar/Foster 19 - 26
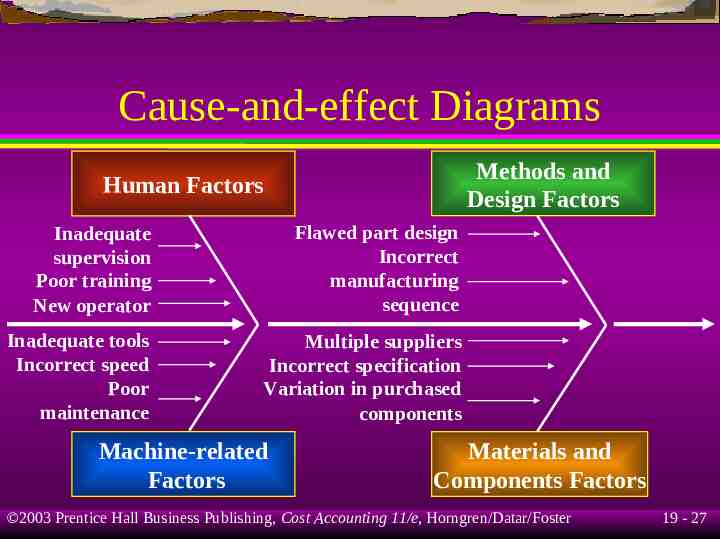
Cause-and-effect Diagrams Methods and Design Factors Human Factors Inadequate supervision Poor training New operator Flawed part design Incorrect manufacturing sequence Inadequate tools Incorrect speed Poor maintenance Multiple suppliers Incorrect specification Variation in purchased components Machine-related Factors Materials and Components Factors 2003 Prentice Hall Business Publishing, Cost Accounting 11/e, Horngren/Datar/Foster 19 - 27
Learning Objective 3 Identify the relevant costs and benefits of quality improvements. 2003 Prentice Hall Business Publishing, Cost Accounting 11/e, Horngren/Datar/Foster 19 - 28
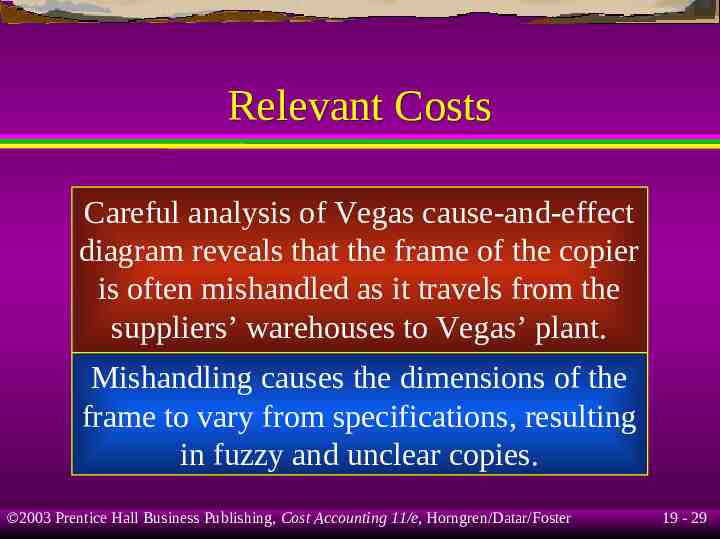
Relevant Costs Careful analysis of Vegas cause-and-effect diagram reveals that the frame of the copier is often mishandled as it travels from the suppliers’ warehouses to Vegas’ plant. Mishandling causes the dimensions of the frame to vary from specifications, resulting in fuzzy and unclear copies. 2003 Prentice Hall Business Publishing, Cost Accounting 11/e, Horngren/Datar/Foster 19 - 29
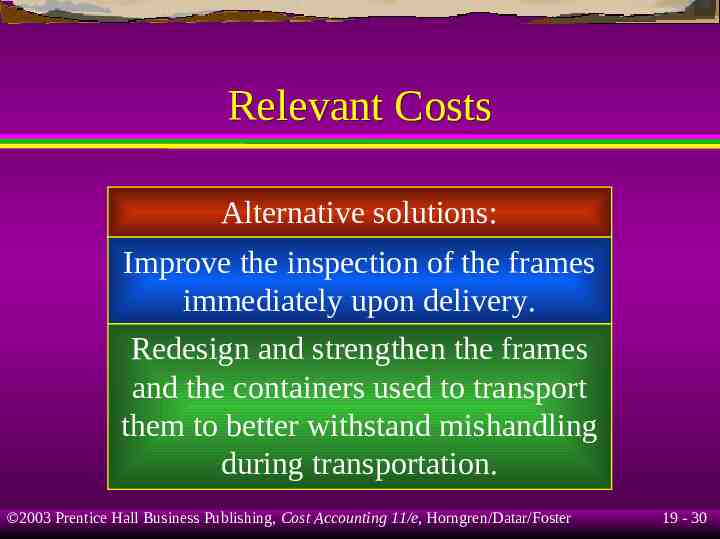
Relevant Costs Alternative solutions: Improve the inspection of the frames immediately upon delivery. Redesign and strengthen the frames and the containers used to transport them to better withstand mishandling during transportation. 2003 Prentice Hall Business Publishing, Cost Accounting 11/e, Horngren/Datar/Foster 19 - 30
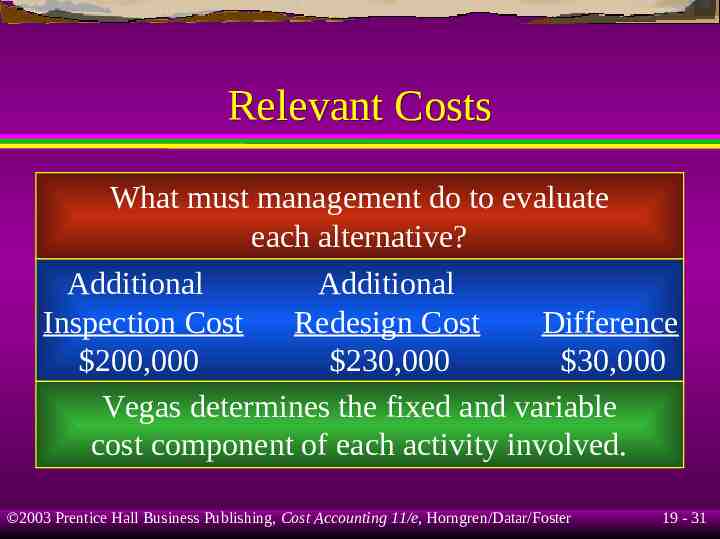
Relevant Costs What must management do to evaluate each alternative? Additional Additional Inspection Cost Redesign Cost Difference 200,000 230,000 30,000 Vegas determines the fixed and variable cost component of each activity involved. 2003 Prentice Hall Business Publishing, Cost Accounting 11/e, Horngren/Datar/Foster 19 - 31
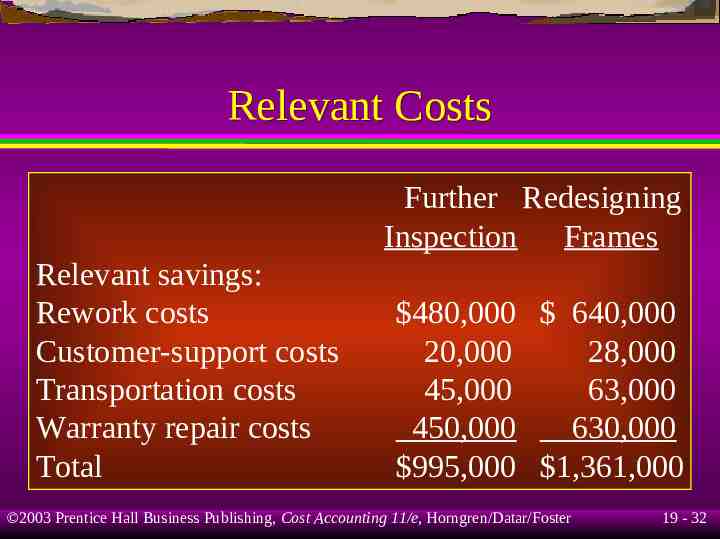
Relevant Costs Further Redesigning Inspection Frames Relevant savings: Rework costs Customer-support costs Transportation costs Warranty repair costs Total 480,000 640,000 20,000 28,000 45,000 63,000 450,000 630,000 995,000 1,361,000 2003 Prentice Hall Business Publishing, Cost Accounting 11/e, Horngren/Datar/Foster 19 - 32
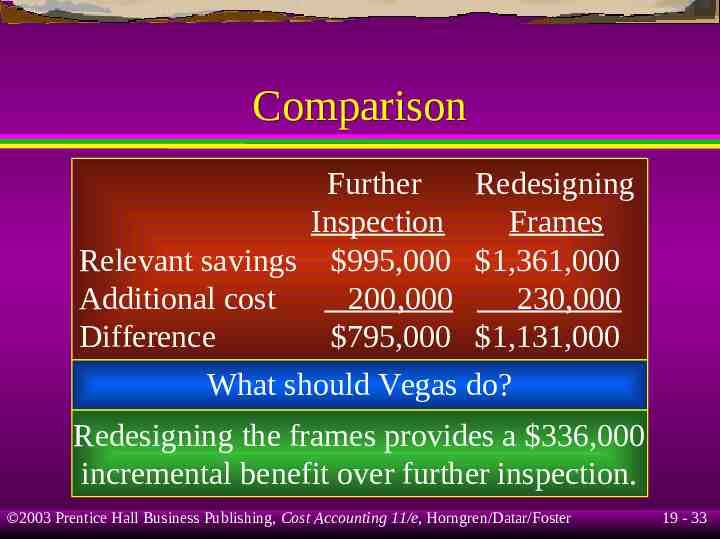
Comparison Further Redesigning Inspection Frames Relevant savings 995,000 1,361,000 Additional cost 200,000 230,000 Difference 795,000 1,131,000 What should Vegas do? Redesigning the frames provides a 336,000 incremental benefit over further inspection. 2003 Prentice Hall Business Publishing, Cost Accounting 11/e, Horngren/Datar/Foster 19 - 33
Learning Objective 4 Provide examples of nonfinancial quality measures of customer satisfaction and internal performance. 2003 Prentice Hall Business Publishing, Cost Accounting 11/e, Horngren/Datar/Foster 19 - 34
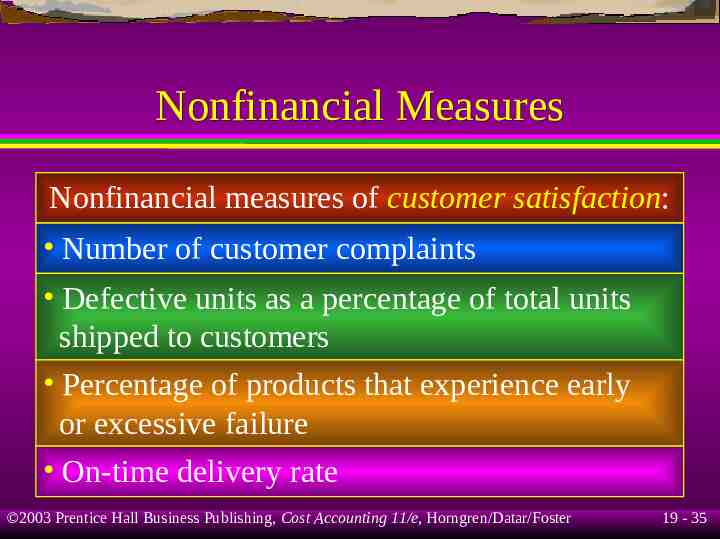
Nonfinancial Measures Nonfinancial measures of customer satisfaction: Number of customer complaints Defective units as a percentage of total units shipped to customers Percentage of products that experience early or excessive failure On-time delivery rate 2003 Prentice Hall Business Publishing, Cost Accounting 11/e, Horngren/Datar/Foster 19 - 35
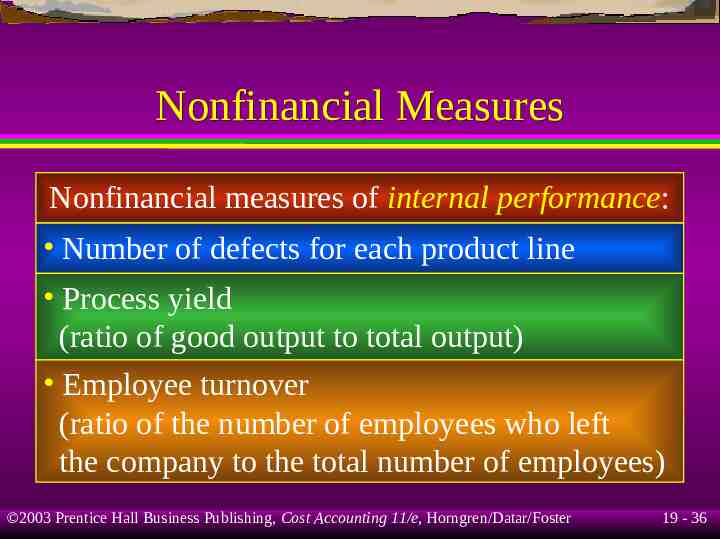
Nonfinancial Measures Nonfinancial measures of internal performance: Number of defects for each product line Process yield (ratio of good output to total output) Employee turnover (ratio of the number of employees who left the company to the total number of employees) 2003 Prentice Hall Business Publishing, Cost Accounting 11/e, Horngren/Datar/Foster 19 - 36
Learning Objective 5 Describe the benefits of financial and nonfinancial measures of quality. 2003 Prentice Hall Business Publishing, Cost Accounting 11/e, Horngren/Datar/Foster 19 - 37
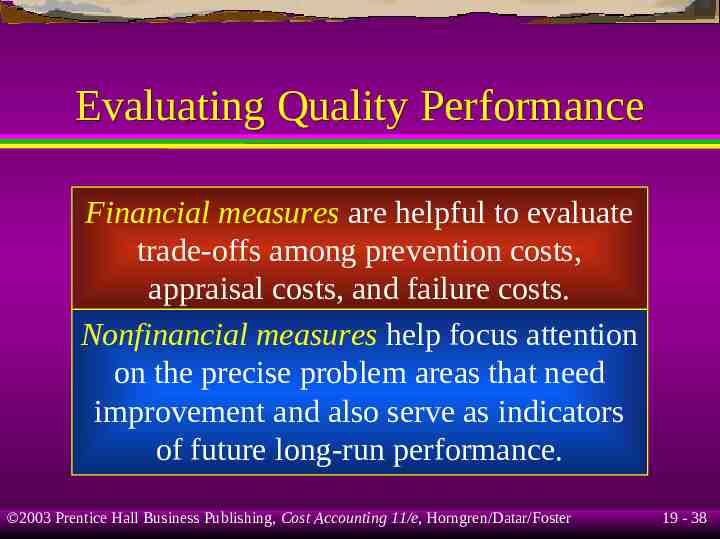
Evaluating Quality Performance Financial measures are helpful to evaluate trade-offs among prevention costs, appraisal costs, and failure costs. Nonfinancial measures help focus attention on the precise problem areas that need improvement and also serve as indicators of future long-run performance. 2003 Prentice Hall Business Publishing, Cost Accounting 11/e, Horngren/Datar/Foster 19 - 38
Learning Objective 6 Describe customer-response time and explain why delays happen and their costs. 2003 Prentice Hall Business Publishing, Cost Accounting 11/e, Horngren/Datar/Foster 19 - 39
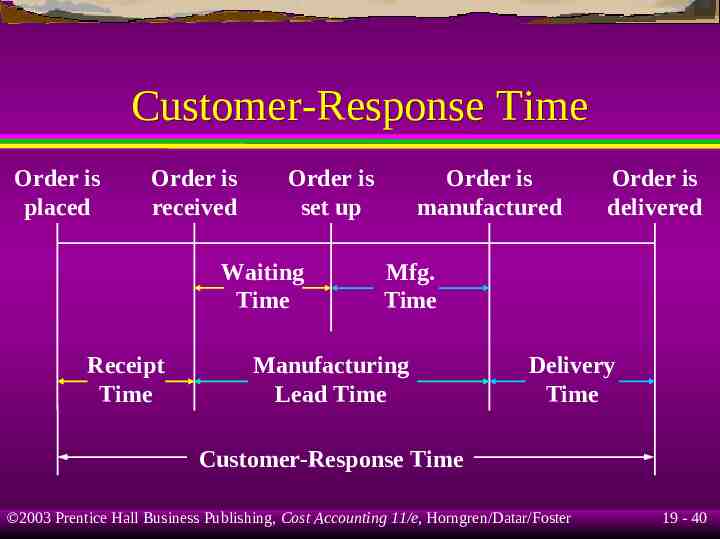
Customer-Response Time Order is placed Order is received Order is set up Waiting Time Receipt Time Order is manufactured Order is delivered Mfg. Time Manufacturing Lead Time Delivery Time Customer-Response Time 2003 Prentice Hall Business Publishing, Cost Accounting 11/e, Horngren/Datar/Foster 19 - 40
On-Time Performance On-time performance refers to situations in which the product or service is actually delivered at the time it is scheduled to be delivered. 2003 Prentice Hall Business Publishing, Cost Accounting 11/e, Horngren/Datar/Foster 19 - 41
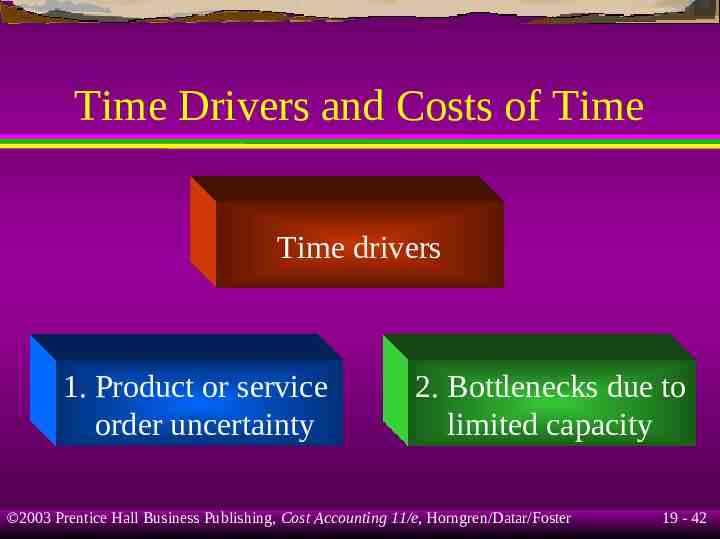
Time Drivers and Costs of Time Time drivers 1. Product or service order uncertainty 2. Bottlenecks due to limited capacity 2003 Prentice Hall Business Publishing, Cost Accounting 11/e, Horngren/Datar/Foster 19 - 42
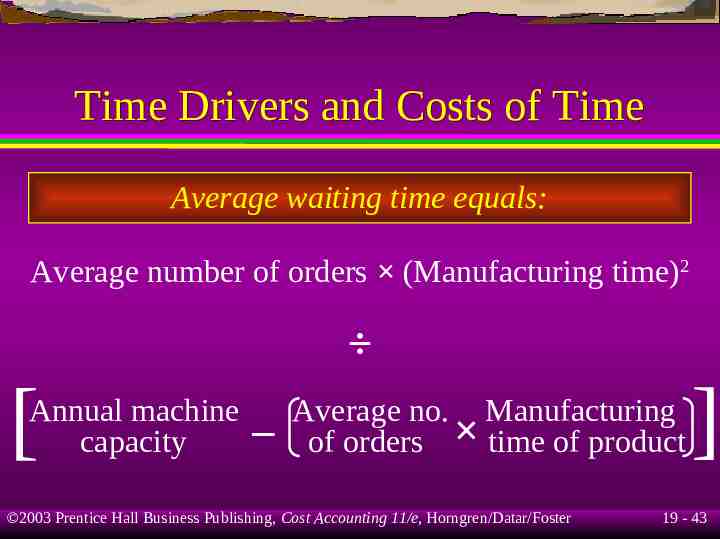
Time Drivers and Costs of Time Average waiting time equals: Average number of orders (Manufacturing time)2 [ Annual machine capacity – Average no. Manufacturing of orders time of product 2003 Prentice Hall Business Publishing, Cost Accounting 11/e, Horngren/Datar/Foster 19 - 43
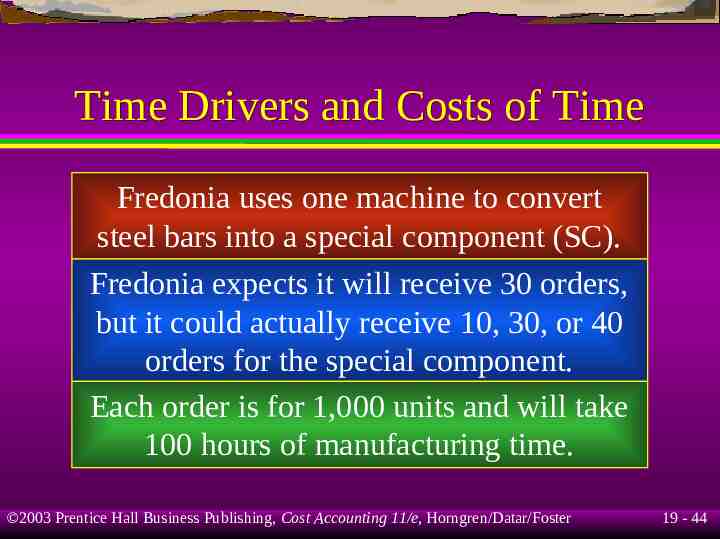
Time Drivers and Costs of Time Fredonia uses one machine to convert steel bars into a special component (SC). Fredonia expects it will receive 30 orders, but it could actually receive 10, 30, or 40 orders for the special component. Each order is for 1,000 units and will take 100 hours of manufacturing time. 2003 Prentice Hall Business Publishing, Cost Accounting 11/e, Horngren/Datar/Foster 19 - 44
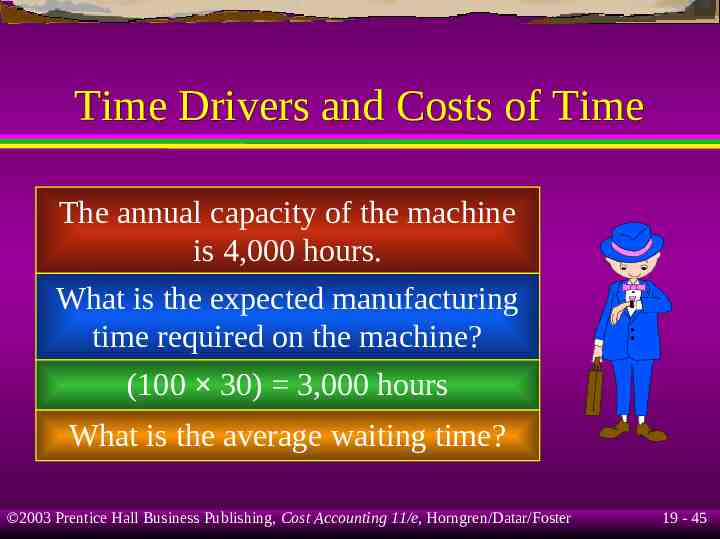
Time Drivers and Costs of Time The annual capacity of the machine is 4,000 hours. What is the expected manufacturing time required on the machine? (100 30) 3,000 hours What is the average waiting time? 2003 Prentice Hall Business Publishing, Cost Accounting 11/e, Horngren/Datar/Foster 19 - 45
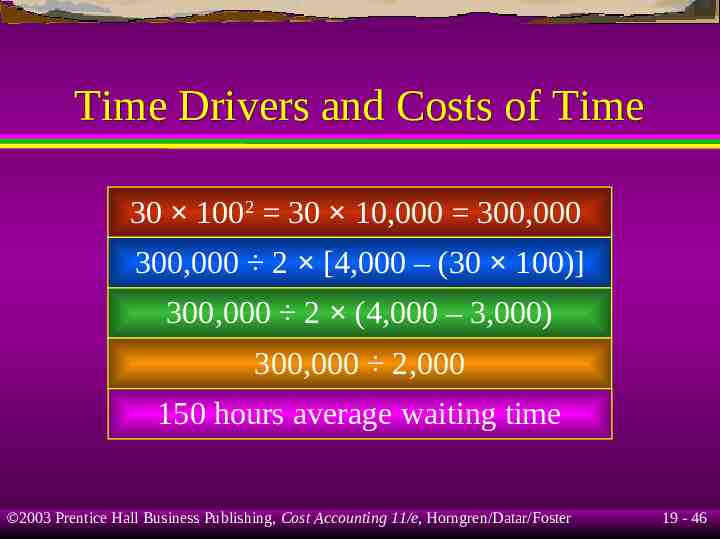
Time Drivers and Costs of Time 30 1002 30 10,000 300,000 300,000 2 [4,000 – (30 100)] 300,000 2 (4,000 – 3,000) 300,000 2,000 150 hours average waiting time 2003 Prentice Hall Business Publishing, Cost Accounting 11/e, Horngren/Datar/Foster 19 - 46
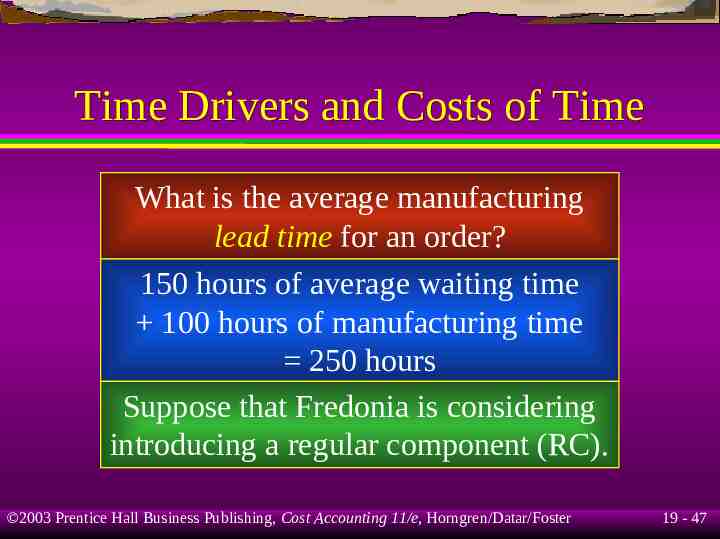
Time Drivers and Costs of Time What is the average manufacturing lead time for an order? 150 hours of average waiting time 100 hours of manufacturing time 250 hours Suppose that Fredonia is considering introducing a regular component (RC). 2003 Prentice Hall Business Publishing, Cost Accounting 11/e, Horngren/Datar/Foster 19 - 47
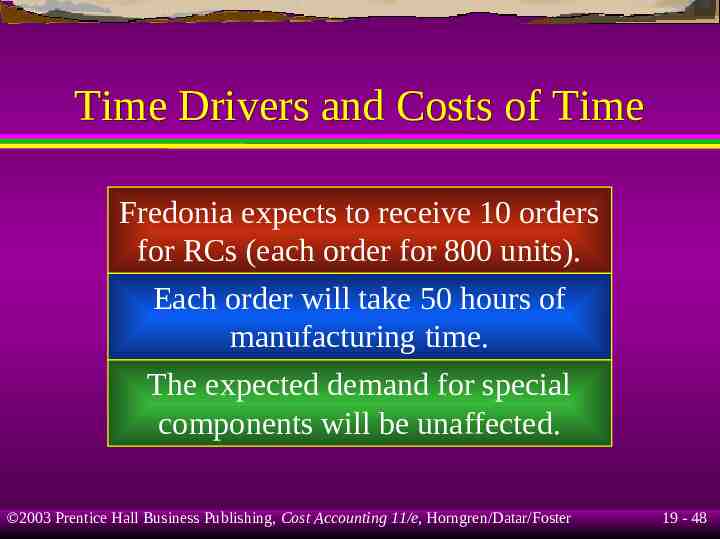
Time Drivers and Costs of Time Fredonia expects to receive 10 orders for RCs (each order for 800 units). Each order will take 50 hours of manufacturing time. The expected demand for special components will be unaffected. 2003 Prentice Hall Business Publishing, Cost Accounting 11/e, Horngren/Datar/Foster 19 - 48
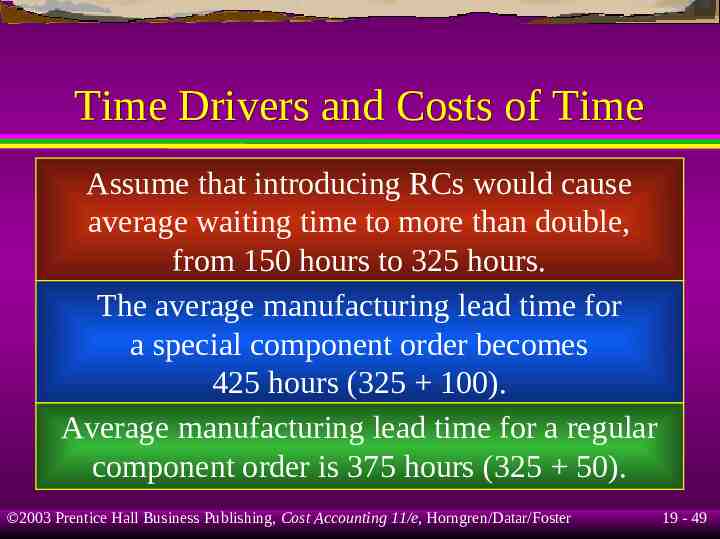
Time Drivers and Costs of Time Assume that introducing RCs would cause average waiting time to more than double, from 150 hours to 325 hours. The average manufacturing lead time for a special component order becomes 425 hours (325 100). Average manufacturing lead time for a regular component order is 375 hours (325 50). 2003 Prentice Hall Business Publishing, Cost Accounting 11/e, Horngren/Datar/Foster 19 - 49
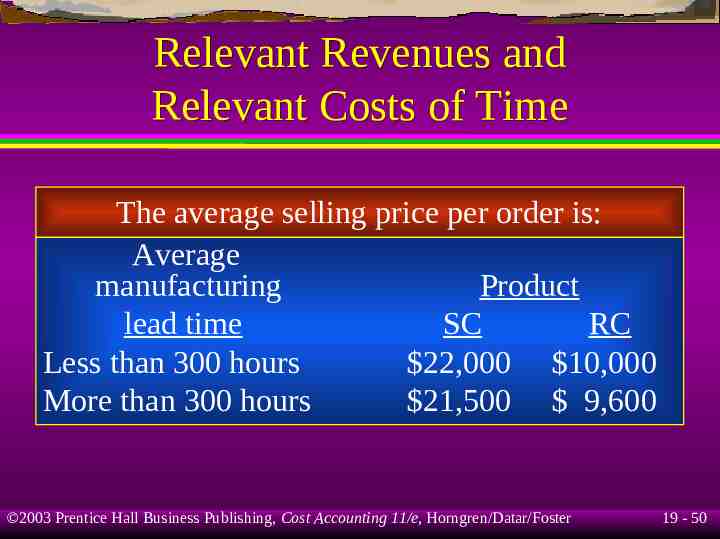
Relevant Revenues and Relevant Costs of Time The average selling price per order is: Average manufacturing Product lead time SC RC Less than 300 hours 22,000 10,000 More than 300 hours 21,500 9,600 2003 Prentice Hall Business Publishing, Cost Accounting 11/e, Horngren/Datar/Foster 19 - 50
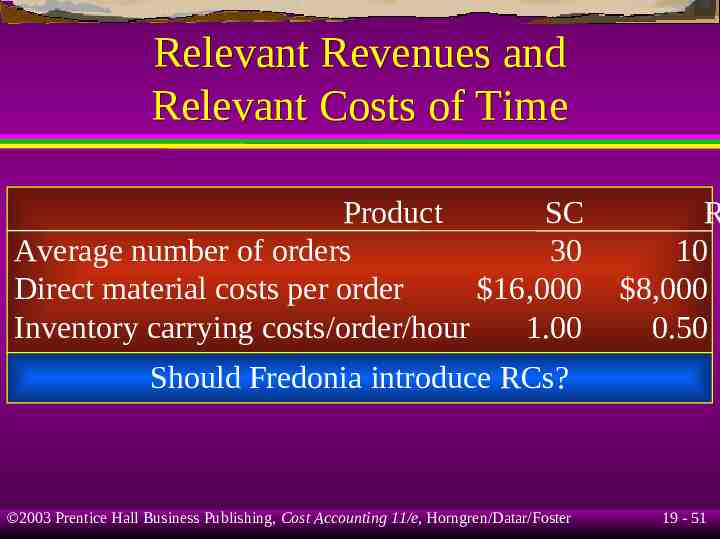
Relevant Revenues and Relevant Costs of Time Product SC Average number of orders 30 Direct material costs per order 16,000 Inventory carrying costs/order/hour 1.00 R 10 8,000 0.50 Should Fredonia introduce RCs? 2003 Prentice Hall Business Publishing, Cost Accounting 11/e, Horngren/Datar/Foster 19 - 51
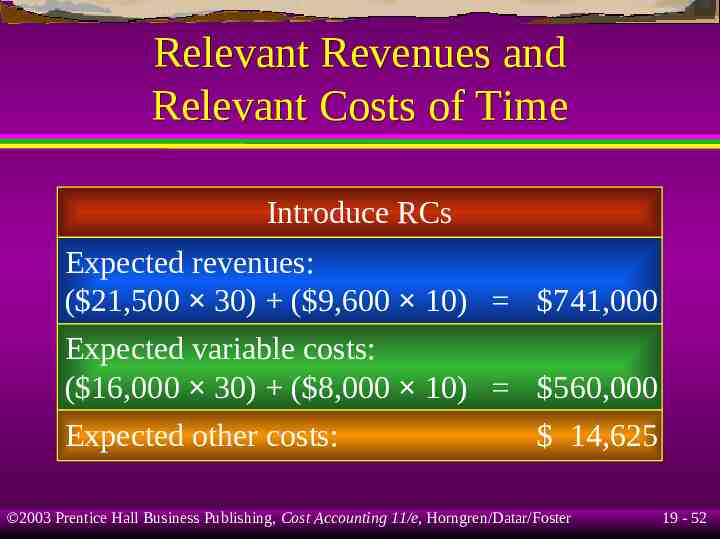
Relevant Revenues and Relevant Costs of Time Introduce RCs Expected revenues: ( 21,500 30) ( 9,600 10) 741,000 Expected variable costs: ( 16,000 30) ( 8,000 10) 560,000 Expected other costs: 14,625 2003 Prentice Hall Business Publishing, Cost Accounting 11/e, Horngren/Datar/Foster 19 - 52
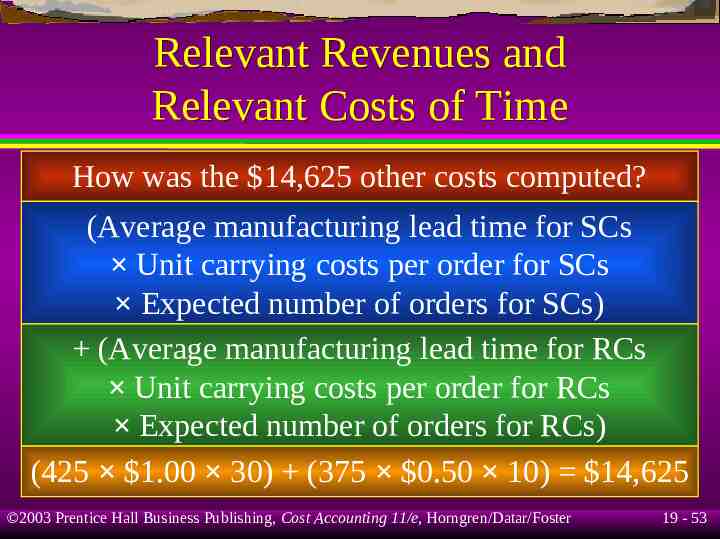
Relevant Revenues and Relevant Costs of Time How was the 14,625 other costs computed? (Average manufacturing lead time for SCs Unit carrying costs per order for SCs Expected number of orders for SCs) (Average manufacturing lead time for RCs Unit carrying costs per order for RCs Expected number of orders for RCs) (425 1.00 30) (375 0.50 10) 14,625 2003 Prentice Hall Business Publishing, Cost Accounting 11/e, Horngren/Datar/Foster 19 - 53
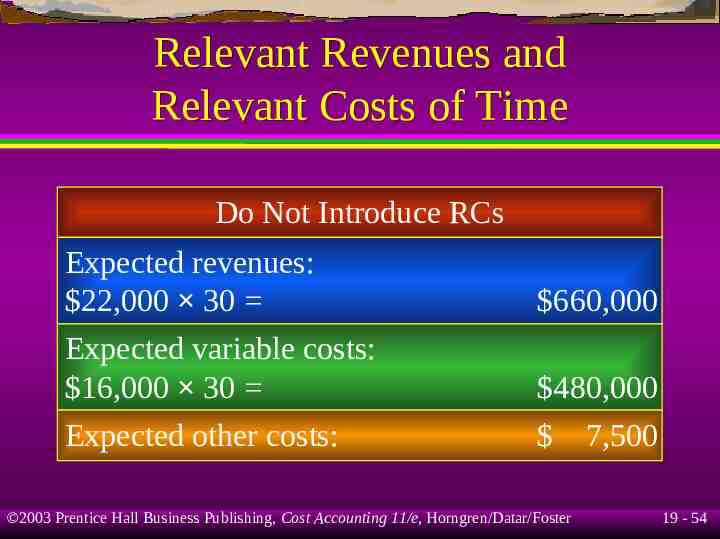
Relevant Revenues and Relevant Costs of Time Do Not Introduce RCs Expected revenues: 22,000 30 Expected variable costs: 16,000 30 Expected other costs: 660,000 480,000 7,500 2003 Prentice Hall Business Publishing, Cost Accounting 11/e, Horngren/Datar/Foster 19 - 54
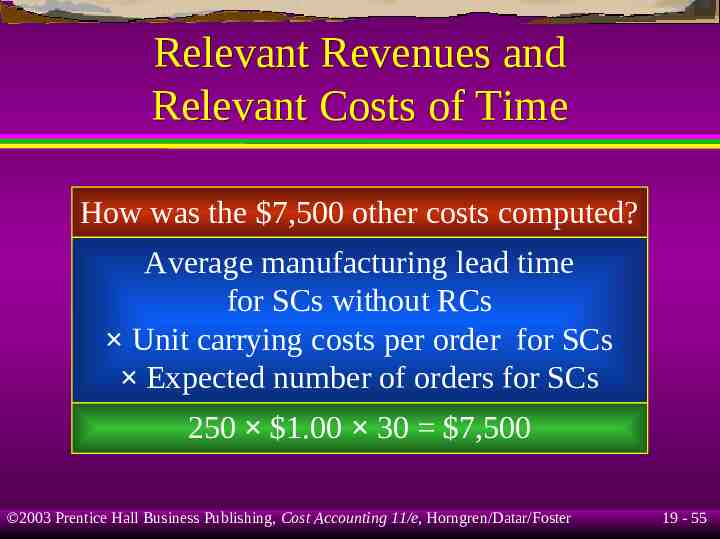
Relevant Revenues and Relevant Costs of Time How was the 7,500 other costs computed? Average manufacturing lead time for SCs without RCs Unit carrying costs per order for SCs Expected number of orders for SCs 250 1.00 30 7,500 2003 Prentice Hall Business Publishing, Cost Accounting 11/e, Horngren/Datar/Foster 19 - 55
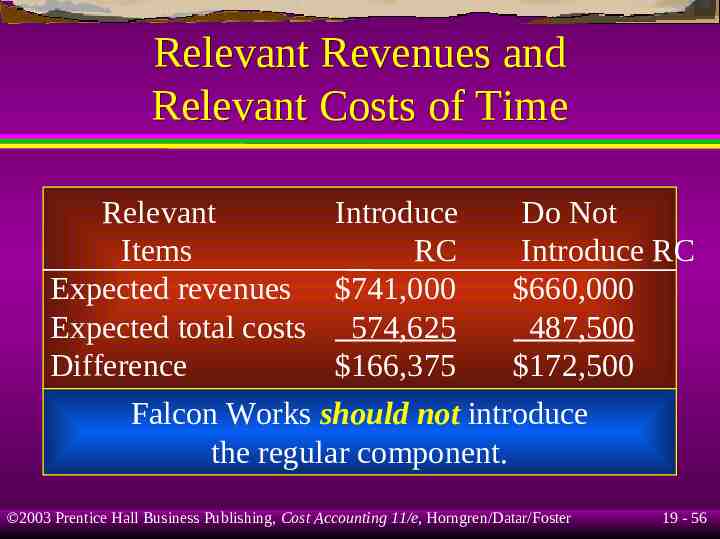
Relevant Revenues and Relevant Costs of Time Relevant Introduce Do Not Items RC Introduce RC Expected revenues 741,000 660,000 Expected total costs 574,625 487,500 Difference 166,375 172,500 Falcon Works should not introduce the regular component. 2003 Prentice Hall Business Publishing, Cost Accounting 11/e, Horngren/Datar/Foster 19 - 56
Learning Objective 7 Apply the three measures in the theory of constraints. 2003 Prentice Hall Business Publishing, Cost Accounting 11/e, Horngren/Datar/Foster 19 - 57
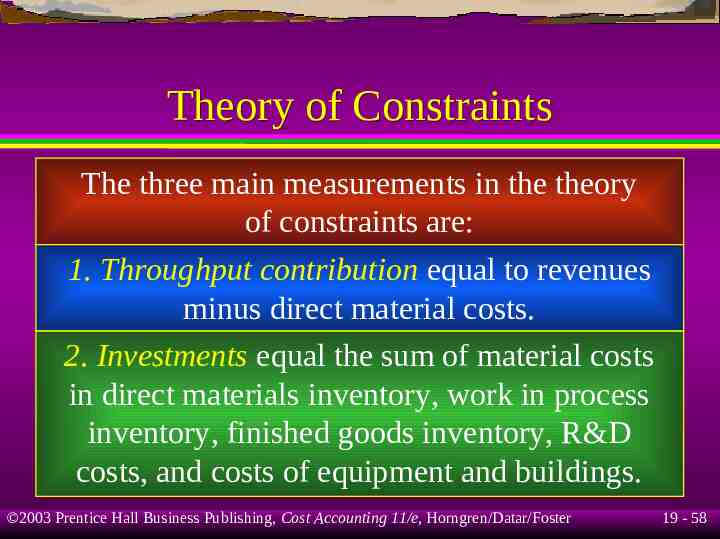
Theory of Constraints The three main measurements in the theory of constraints are: 1. Throughput contribution equal to revenues minus direct material costs. 2. Investments equal the sum of material costs in direct materials inventory, work in process inventory, finished goods inventory, R&D costs, and costs of equipment and buildings. 2003 Prentice Hall Business Publishing, Cost Accounting 11/e, Horngren/Datar/Foster 19 - 58
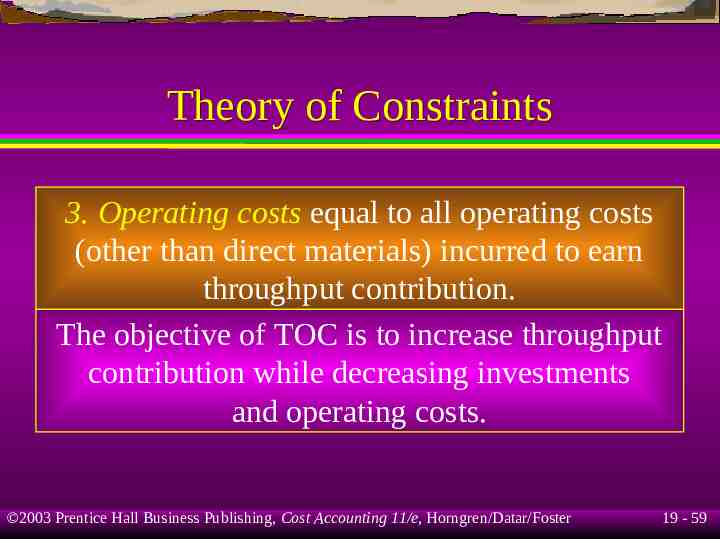
Theory of Constraints 3. Operating costs equal to all operating costs (other than direct materials) incurred to earn throughput contribution. The objective of TOC is to increase throughput contribution while decreasing investments and operating costs. 2003 Prentice Hall Business Publishing, Cost Accounting 11/e, Horngren/Datar/Foster 19 - 59
Learning Objective 8 Manage bottlenecks. 2003 Prentice Hall Business Publishing, Cost Accounting 11/e, Horngren/Datar/Foster 19 - 60
Managing Bottlenecks The four steps in managing bottlenecks are: 1. Recognize that the bottleneck operation determines throughput contribution of the system as a whole. 2. Search and find the bottleneck operation by identifying operations with large quantities of inventory waiting to be worked on. 2003 Prentice Hall Business Publishing, Cost Accounting 11/e, Horngren/Datar/Foster 19 - 61
Managing Bottlenecks 3. Keep the bottleneck busy and subordinate all nonbottleneck operations to the bottleneck operations. 4. Take actions to increase bottleneck efficiency and capacity – the objective is to increase throughput contribution minus the incremental costs of taking such actions. 2003 Prentice Hall Business Publishing, Cost Accounting 11/e, Horngren/Datar/Foster 19 - 62
End of Chapter 19 2003 Prentice Hall Business Publishing, Cost Accounting 11/e, Horngren/Datar/Foster 19 - 63