Qualitative Data Analysis : An introduction Carol Grbich Chapter 24
8 Slides68.00 KB
Qualitative Data Analysis : An introduction Carol Grbich Chapter 24 : Innovative Data Display
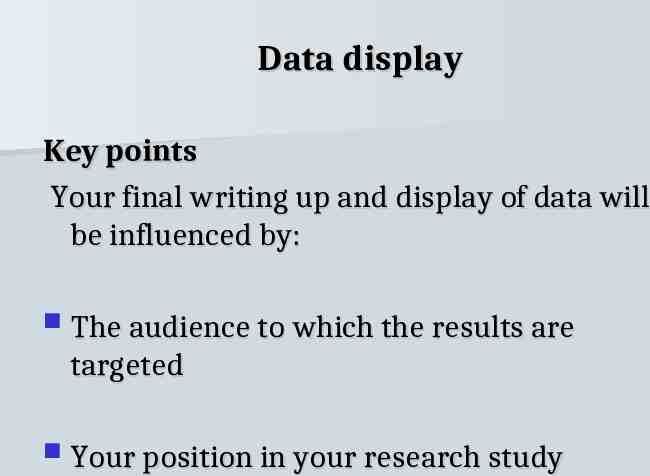
Data display Key points Your final writing up and display of data will be influenced by: The audience to which the results are targeted Your position in your research study
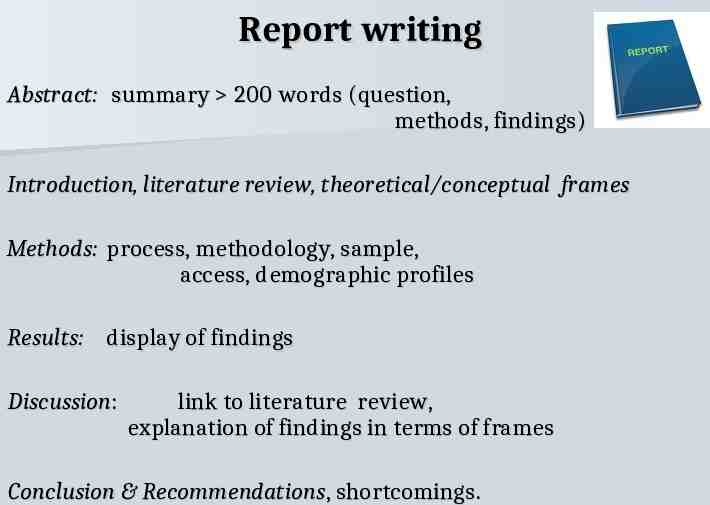
Report writing Abstract: summary 200 words (question, methods, findings) Introduction, literature review, theoretical/conceptual frames Methods: process, methodology, sample, access, demographic profiles Results: display of findings Discussion: link to literature review, explanation of findings in terms of frames Conclusion & Recommendations, shortcomings.
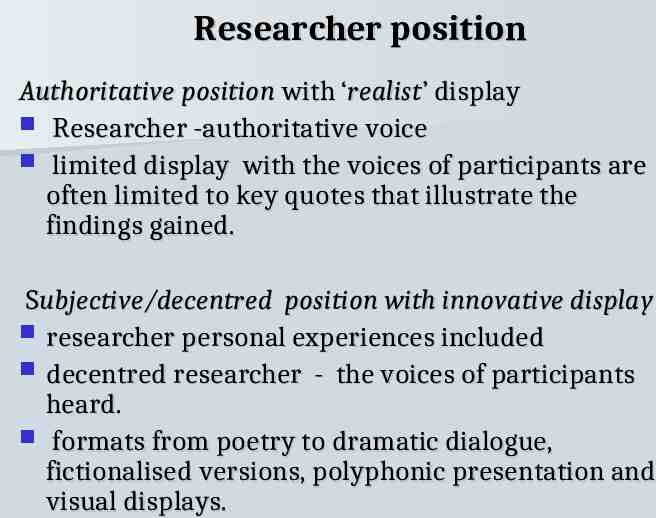
Researcher position Authoritative position with ‘realist’ display Researcher -authoritative voice limited display with the voices of participants are often limited to key quotes that illustrate the findings gained. Subjective/decentred position with innovative display researcher personal experiences included decentred researcher - the voices of participants heard. formats from poetry to dramatic dialogue, fictionalised versions, polyphonic presentation and visual displays.
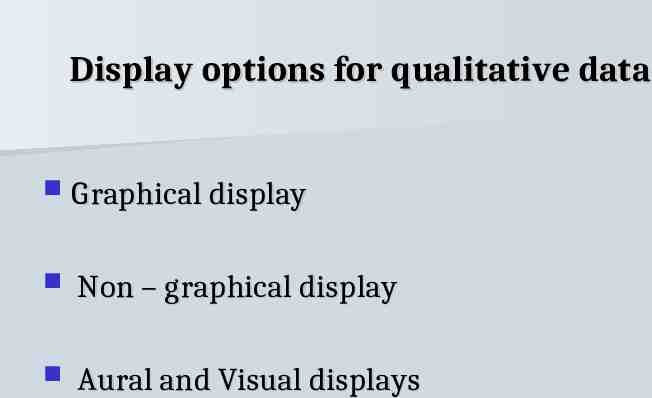
Display options for qualitative data Graphical display Non – graphical display Aural and Visual displays
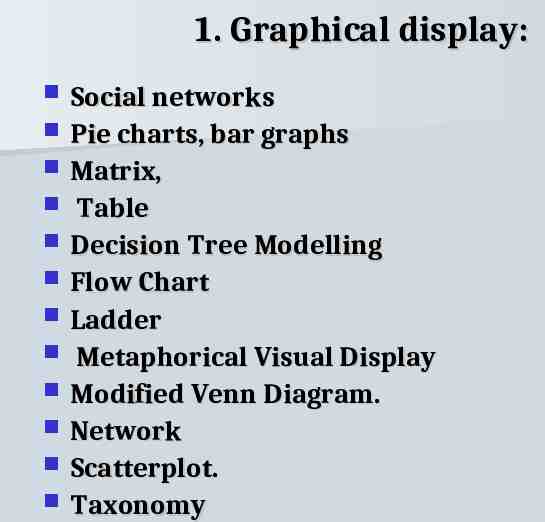
1. Graphical display: Social networks Pie charts, bar graphs Matrix, Table Decision Tree Modelling Flow Chart Ladder Metaphorical Visual Display Modified Venn Diagram. Network Scatterplot. Taxonomy
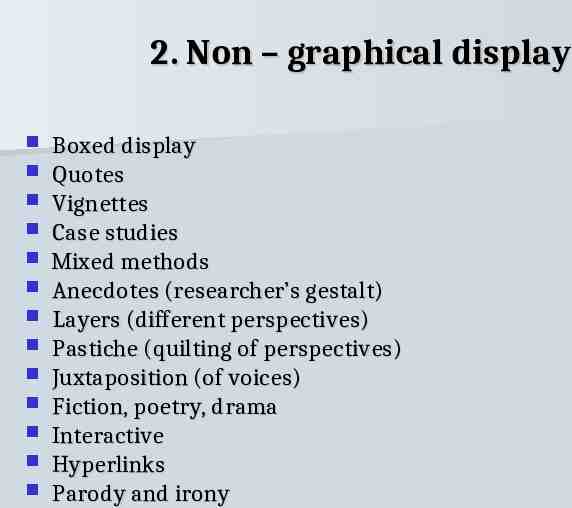
2. Non – graphical display Boxed display Quotes Vignettes Case studies Mixed methods Anecdotes (researcher’s gestalt) Layers (different perspectives) Pastiche (quilting of perspectives) Juxtaposition (of voices) Fiction, poetry, drama Interactive Hyperlinks Parody and irony
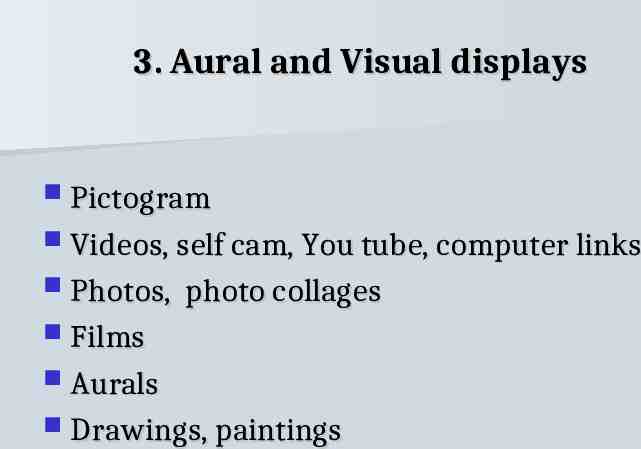
3. Aural and Visual displays Pictogram Videos, self cam, You tube, computer links Photos, photo collages Films Aurals Drawings, paintings