Managing with Measures for Performance Improvement Office of


68 Slides2.52 MB
Managing with Measures for Performance Improvement Office of Quality Management Office of Research Services National Institutes of Health October 2005
Session Outline: Background Overview Developing Measures Effectively Managing With Measures Service Group Examples Questions Session Evaluation 2
Background The President's Management Agenda, announced in the summer of 2001, is an aggressive strategy for improving the management of the Federal government. It focuses on five areas of management weakness across the government where improvements and the most progress can be made. More information at www.whitehouse.gov/omb/budintegration/pma index.html Factual Example - The Federal government spends over 25 billion annually on IT systems and services. Do these services improve efficiency or reduce costs? It is likely they do, but without measuring and communicating the results, how will anyone know? 3
OVERVIEW 4
Overview Organizations succeed when resources within a service group work together to achieve a common goal. This is also true for performance measurement which includes establishing operating strategies, defining processes that contribute to the strategies, and evaluating, using and communicating the results to improve performance. 5
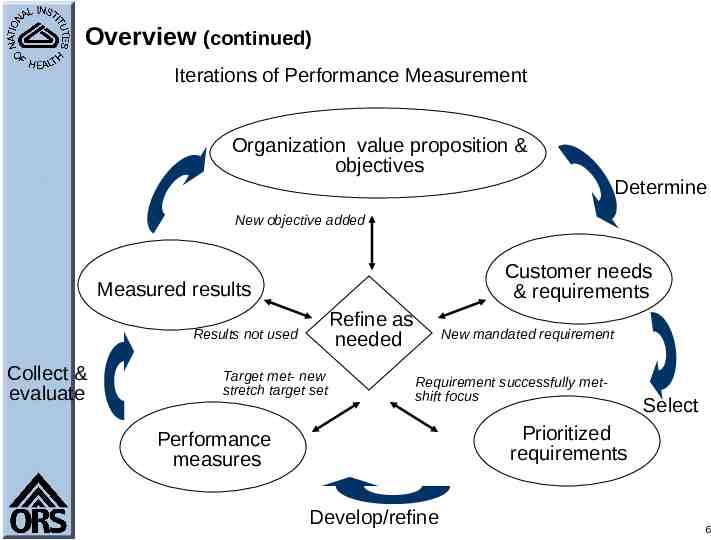
Overview (continued) Iterations of Performance Measurement Organization value proposition & objectives Determine New objective added Customer needs & requirements Measured results Refine as needed Results not used Collect & evaluate Target met- new stretch target set New mandated requirement Requirement successfully metshift focus Select Prioritized requirements Performance measures Develop/refine 6
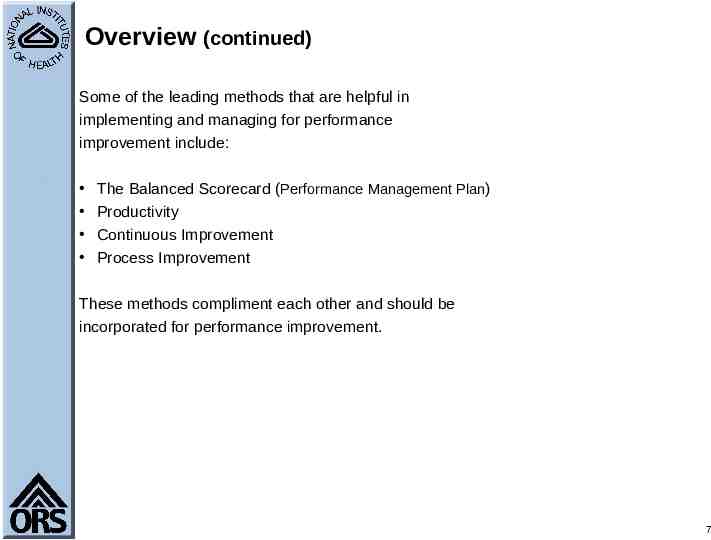
Overview (continued) Some of the leading methods that are helpful in implementing and managing for performance improvement include: The Balanced Scorecard (Performance Management Plan) Productivity Continuous Improvement Process Improvement These methods compliment each other and should be incorporated for performance improvement. 7
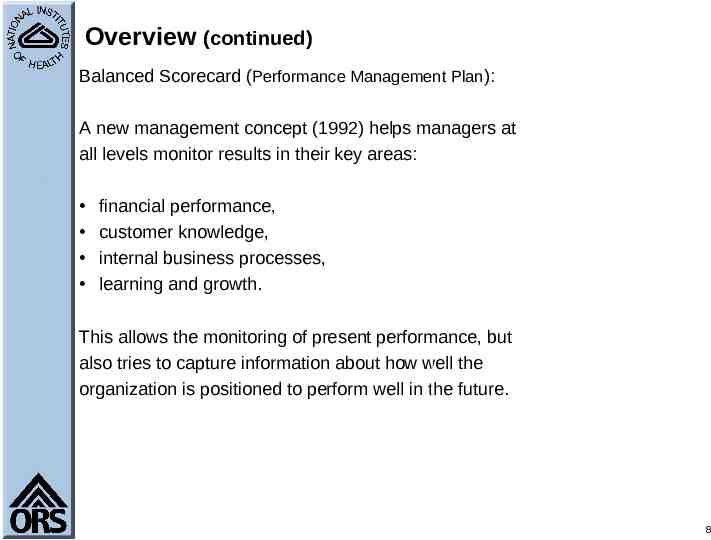
Overview (continued) Balanced Scorecard (Performance Management Plan): A new management concept (1992) helps managers at all levels monitor results in their key areas: financial performance, customer knowledge, internal business processes, learning and growth. This allows the monitoring of present performance, but also tries to capture information about how well the organization is positioned to perform well in the future. 8
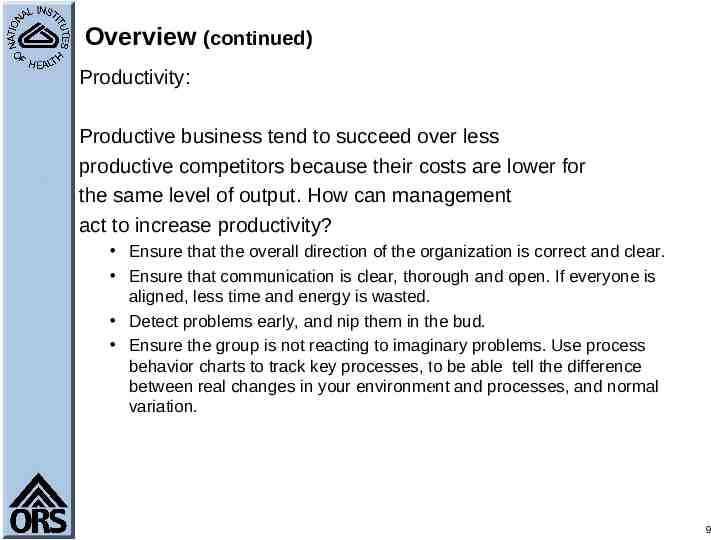
Overview (continued) Productivity: Productive business tend to succeed over less productive competitors because their costs are lower for the same level of output. How can management act to increase productivity? Ensure that the overall direction of the organization is correct and clear. Ensure that communication is clear, thorough and open. If everyone is aligned, less time and energy is wasted. Detect problems early, and nip them in the bud. Ensure the group is not reacting to imaginary problems. Use process behavior charts to track key processes, to be able tell the difference between real changes in your environment and processes, and normal variation. 9
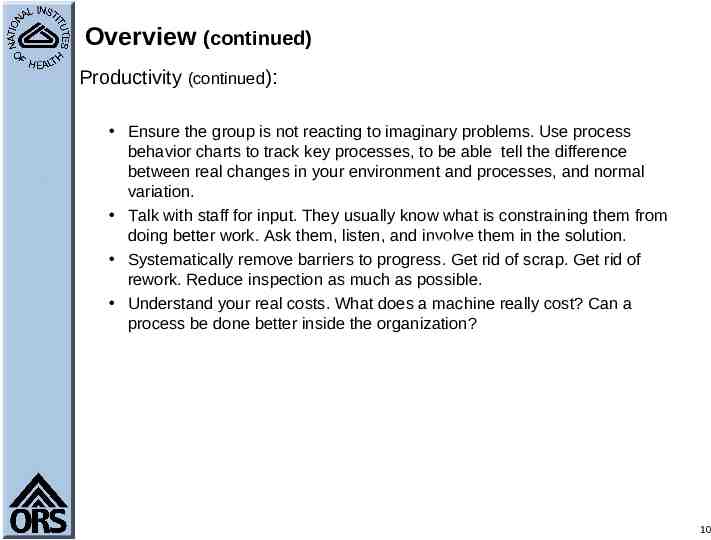
Overview (continued) Productivity (continued): Ensure the group is not reacting to imaginary problems. Use process behavior charts to track key processes, to be able tell the difference between real changes in your environment and processes, and normal variation. Talk with staff for input. They usually know what is constraining them from doing better work. Ask them, listen, and involve them in the solution. Systematically remove barriers to progress. Get rid of scrap. Get rid of rework. Reduce inspection as much as possible. Understand your real costs. What does a machine really cost? Can a process be done better inside the organization? 10
Overview (continued) Continuous Improvement (Kaizen): In contrast to the usual emphasis on revolutionary, innovative change on an occasional basis, continuous improvement looks for uninterrupted, ongoing incremental change. In other words, there is always room for improvement and continuously trying to become better. The principles of implementation are: human resources are the most important organizational assets processes should evolve by gradual improvement rather than radical changes, improvement should be based on statistical/quantitative evaluation of process performance. 11
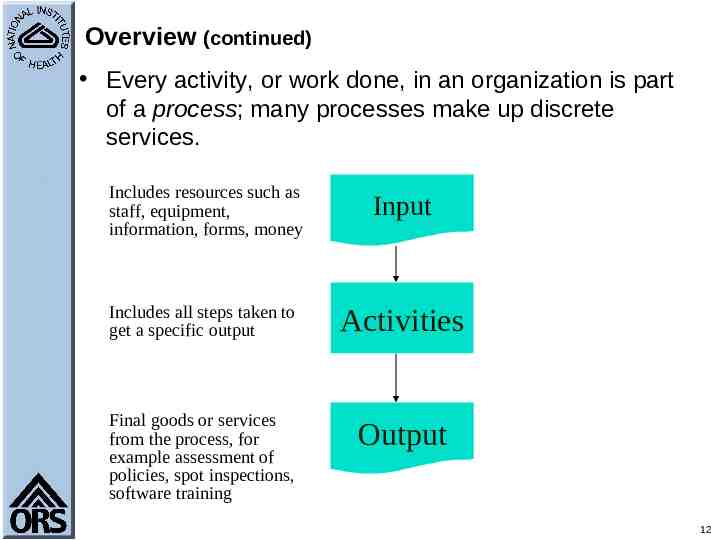
Overview (continued) Every activity, or work done, in an organization is part of a process; many processes make up discrete services. Includes resources such as staff, equipment, information, forms, money Input Includes all steps taken to get a specific output Activities Final goods or services from the process, for example assessment of policies, spot inspections, software training Output 12
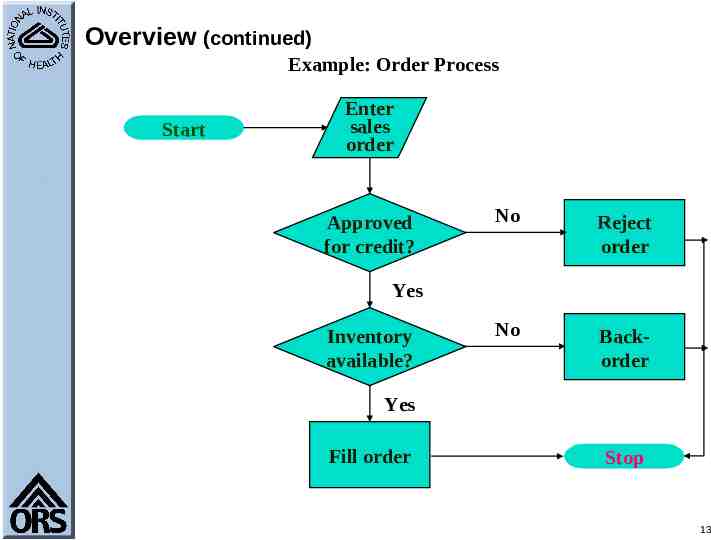
Overview (continued) Example: Order Process Start Enter sales order Approved for credit? No Reject order No Backorder Yes Inventory available? Yes Fill order Stop 13
Overview (continued) Processes should add value, i.e. accomplish something. Focusing and measuring areas within processes results in more rapid, substantial improvements. 14
Overview (continued) Many processes are not optimal – there is generally some wasted effort, lost time, scrap, miscommunication, or re-work. These problems all have costs - some small, and some great. Good News - Management practitioners have, over the years, developed tools which can be used to measure and systematically improve processes and overall operations. 15
Classic Tools The best tools stand the test of time and give a lot of leverage over common problems. The most widely used management methods and tools include: Quality Control Charts Pie charts Bar charts Run Charts Radar Charts Scatter Plots Histograms Pareto Charts Normal Test Plots Process Capability Calculations Control Charts (Process Behavior) Other Quality Management Tools Relations Diagram Affinity Diagrams Brainstorms Building Consensus Cause and Effect Diagrams Flowcharts Force Field Diagrams Tree Diagrams Scattergra m 16
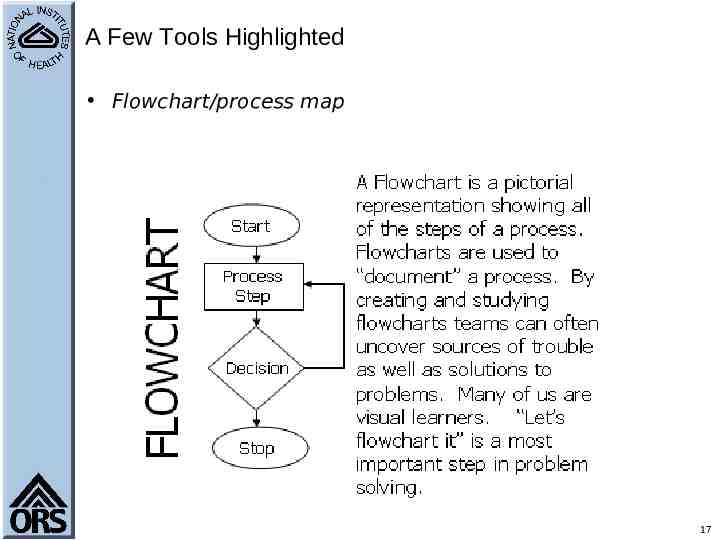
A Few Tools Highlighted Flowchart/process map Scattergra m 17
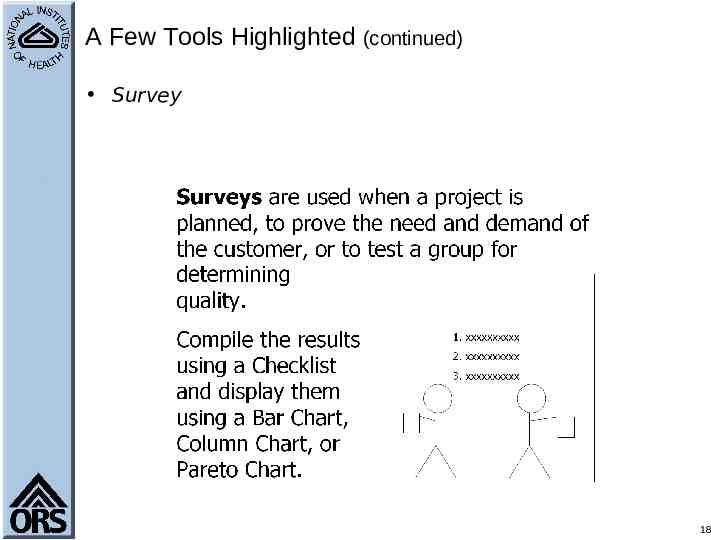
A Few Tools Highlighted (continued) Survey Scattergra m 18
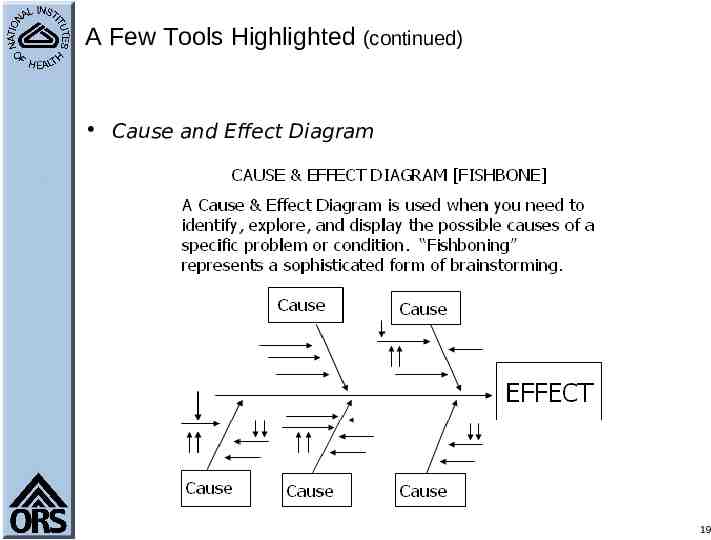
A Few Tools Highlighted (continued) Cause and Effect Diagram Scattergra m 19
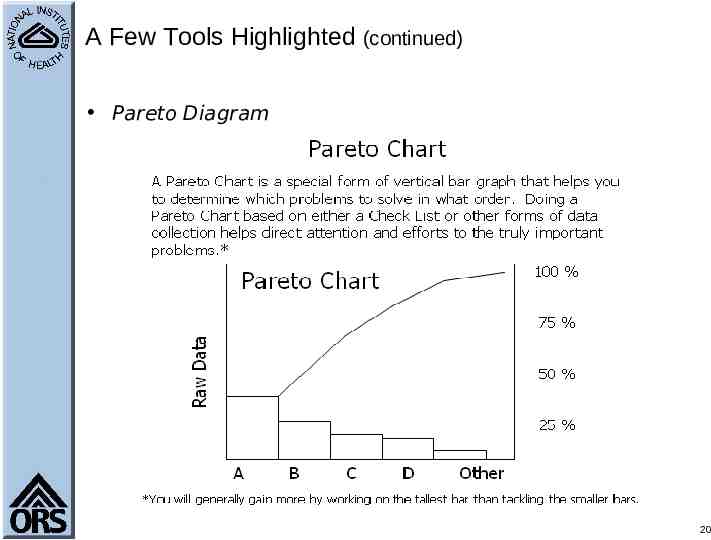
A Few Tools Highlighted (continued) Pareto Diagram Scattergra m 20
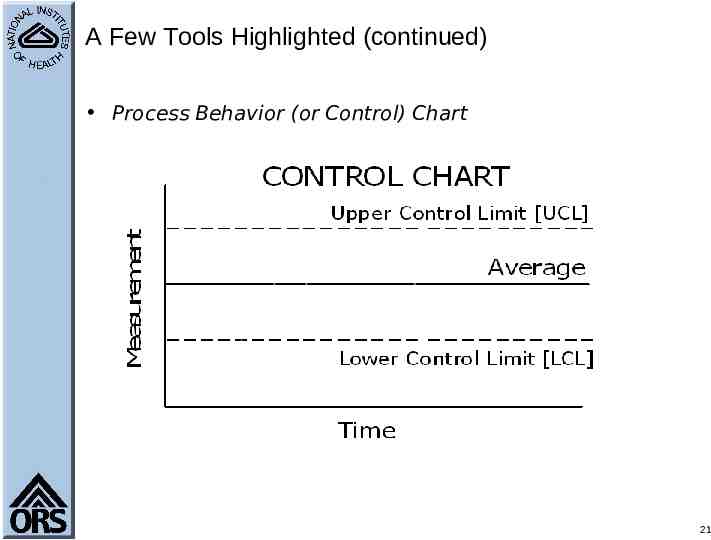
A Few Tools Highlighted (continued) Process Behavior (or Control) Chart Scattergra m 21
DEVELOPING MEASURES EFFECTIVELY 22
Measures What is a Measure? A measure is a means of assessing performance in a particular area. Why Measure? Measures are at the heart of a good, customerfocused process management system, and any activity directed at continuous improvement. 23
Measures (continued) Measures help drive performance improvement. Measures help provide a basis for assessing efficiency and effectiveness of services. 24
Measures (continued) The Performance Management Plan (PMP) has been, and is a useful tool to plan and take the pulse of an organization. The PMP assists organizations with: Effective organizational performance measurement Implementation of strategy 25
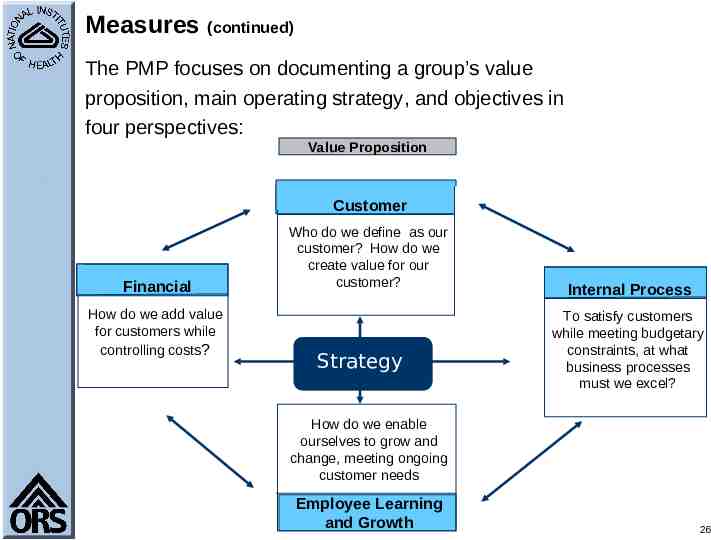
Measures (continued) The PMP focuses on documenting a group’s value proposition, main operating strategy, and objectives in four perspectives: Value Proposition Customer Financial How do we add value for customers while controlling costs? Who do we define as our customer? How do we create value for our customer? Strategy Internal Process To satisfy customers while meeting budgetary constraints, at what business processes must we excel? How do we enable ourselves to grow and change, meeting ongoing customer needs Employee Learning and Growth 26
Steps to Develop and Manage with Measures 27
Steps to Develop and Manage with Measures 1. Link Processes to Objectives Using the PMP framework, establish a clear understanding of your service group’s purpose, or value, and your objectives. Update as necessary. Identify linkages between your processes (work that is done) and defined objectives to increase the likelihood that improved process results will contribute to total service group accomplishments. 28
Steps to Develop and Manage with Measures (continued) 2. Identify and Select Performance Measures Within the objectives, identify what process is being measured, where applicable, and the goals of each process being measured. Decide how requirements will be met. Know the purpose of the results. Understand why the results matter. Measure that which is most important. NOTE: Effective performance measures reflect a strong customer focus. 29
Steps to Develop and Manage with Measures (continued) 3. Establish Baseline to Compare Future Performance Baselines are an essential element of performance measurement. If no baselines exist, select measures that will establish the basis for comparing future performance, collect data about current processes, work output, and service group outcomes. 30
Steps to Develop and Manage with Measures (continued) 4. Select Processes with the Greatest Impact Select those processes, tied to the objectives, within each PMP perspective with the greatest operational impact. Remember to highlight areas that will allow measurement of key elements of your primary strategy. 31
Steps to Develop and Manage with Measures (continued) 5. Collect Data Address data collection during development of measures. Decide the “what, when, where, how and by whom” of collecting the data and document it. Validate data. Review performance measures to verify they represent what they intend to gauge – Are we measuring the right thing? 32
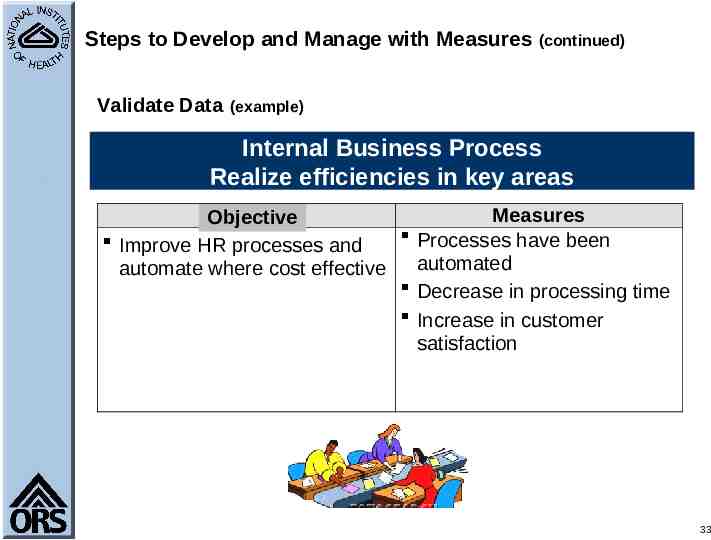
Steps to Develop and Manage with Measures (continued) Validate Data (example) Internal Business Process Realize efficiencies in key areas Goals Measures Objective Processes have been Improve HR processes and automated automate where cost effective Decrease in processing time Increase in customer satisfaction 33
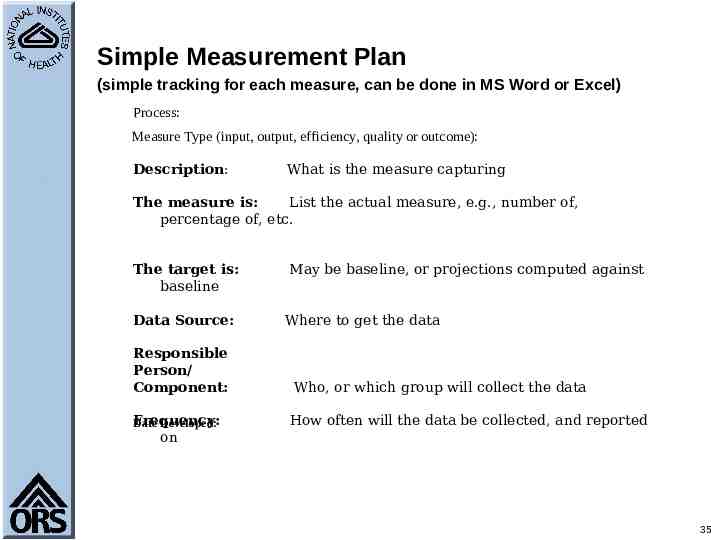
Steps to Develop and Manage with Measures (continued) 5. Collect Data (continued) Document measures using any one of the suggested forms on the next three slides: 34
Simple Measurement Plan (simple tracking for each measure, can be done in MS Word or Excel) Process: Measure Type (input, output, efficiency, quality or outcome): Description: What is the measure capturing The measure is: List the actual measure, e.g., number of, percentage of, etc. The target is: baseline Data Source: Responsible Person/ Component: Frequency: Date Developed: on May be baseline, or projections computed against Where to get the data Who, or which group will collect the data How often will the data be collected, and reported 35
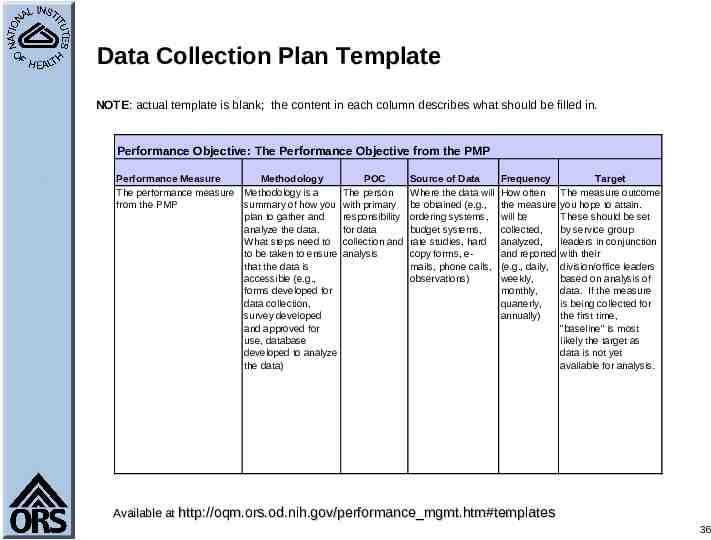
Data Collection Plan Template NOTE: actual template is blank; the content in each column describes what should be filled in. Performance Objective: The Performance Objective from the PMP Performance Measure Methodology The performance measure Methodology is a from the PMP summary of how you plan to gather and analyze the data. What steps need to to be taken to ensure that the data is accessible (e.g., forms developed for data collection, survey developed and approved for use, database developed to analyze the data) POC The person with primary responsibility for data collection and analysis Source of Data Where the data will be obtained (e.g., ordering systems, budget systems, rate studies, hard copy forms, emails, phone calls, observations) Frequency How often the measure will be collected, analyzed, and reported (e.g., daily, weekly, monthly, quarterly, annually) Target The measure outcome you hope to attain. These should be set by service group leaders in conjunction with their division/office leaders based on analysis of data. If the measure is being collected for the first time, "baseline" is most likely the target as data is not yet available for analysis. Available at http://oqm.ors.od.nih.gov/performance mgmt.htm#templates 36
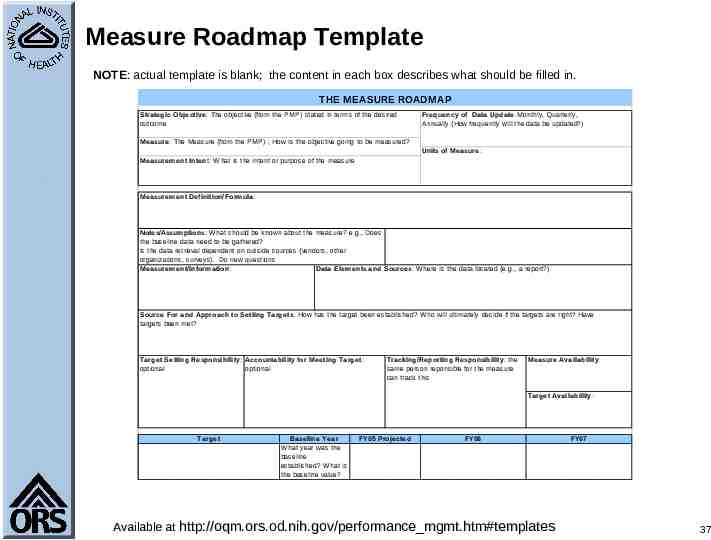
Measure Roadmap Template NOTE: actual template is blank; the content in each box describes what should be filled in. T HE M EASURE ROADM AP Strategic Objective : The objective (from the PMP) stated in terms of the desired outcome Freque ncy of Data Update :Monthly, Quarterly, Annually (How frequently will the data be updated?) Measure: The Measure (from the PMP) ; How is the objective going to be measured? Units of Measure : Measurement Inte nt: W hat is the intent or purpose of the measure Measurement Definition/Formula : Notes/Assumptions: What should be known about the measure? e.g., Does the baseline data need to be gathered? Is the data retrieval dependent on outside sources (vendors, other organizations, surveys). Do new questions Measurement/Informa tion: Data Elements and Source s: W here is the data located (e.g., a report?) Source For a nd Approach to Setting Targe ts: How has the target been established? W ho will ultimately decide if the targets are right? Have targets been met? Target Setting Responsibility: Accountability for Me eting Target: optional optional Tracking/Reporting Responsibility: the same person reponsible for the measure can track this Mea sure Availa bility: Target Availability: Target Base line Year W hat year was the baseline established? W hat is the baseline value? FY05 Projected FY06 Available at http://oqm.ors.od.nih.gov/performance mgmt.htm#templates FY07 37
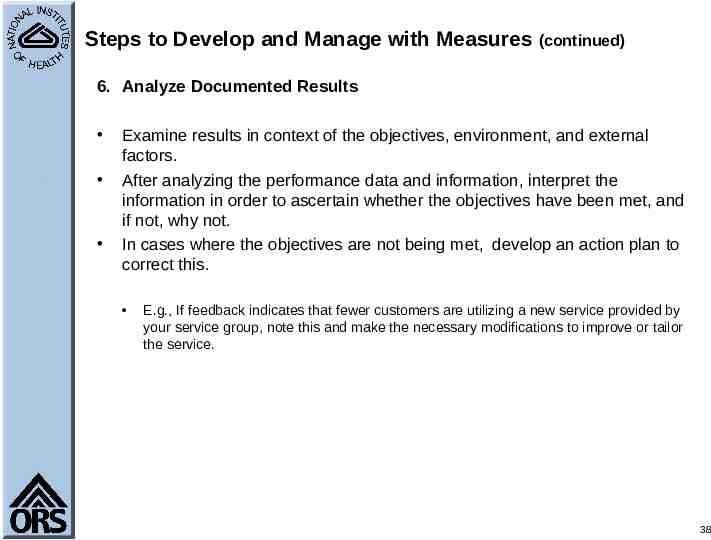
Steps to Develop and Manage with Measures (continued) 6. Analyze Documented Results Examine results in context of the objectives, environment, and external factors. After analyzing the performance data and information, interpret the information in order to ascertain whether the objectives have been met, and if not, why not. In cases where the objectives are not being met, develop an action plan to correct this. E.g., If feedback indicates that fewer customers are utilizing a new service provided by your service group, note this and make the necessary modifications to improve or tailor the service. 38
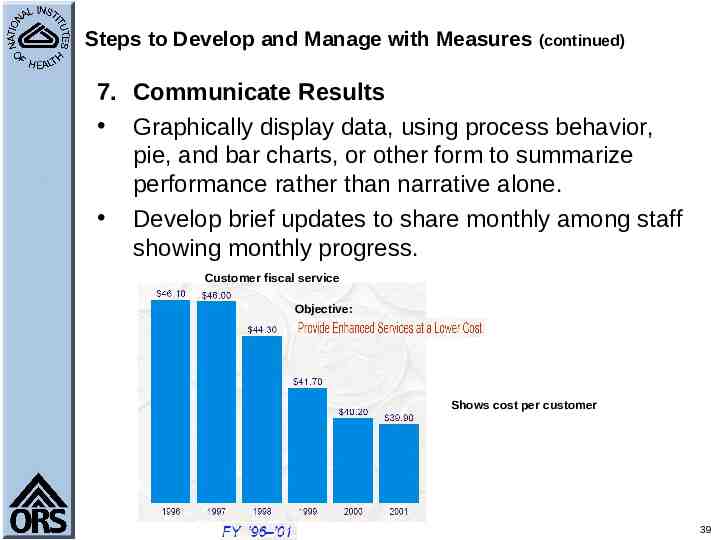
Steps to Develop and Manage with Measures (continued) 7. Communicate Results Graphically display data, using process behavior, pie, and bar charts, or other form to summarize performance rather than narrative alone. Develop brief updates to share monthly among staff showing monthly progress. Customer fiscal service Objective: Shows cost per customer 39
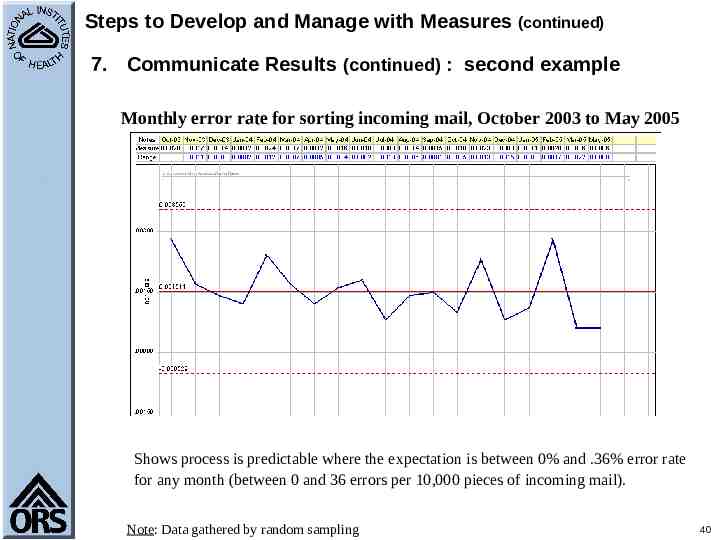
Steps to Develop and Manage with Measures (continued) 7. Communicate Results (continued) : second example Monthly error rate for sorting incoming mail, October 2003 to May 2005 Shows process is predictable where the expectation is between 0% and .36% error rate for any month (between 0 and 36 errors per 10,000 pieces of incoming mail). Note: Data gathered by random sampling. 40
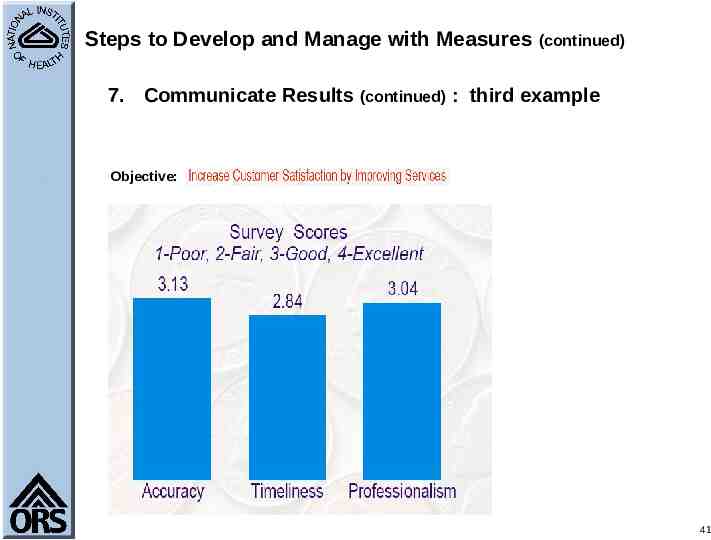
Steps to Develop and Manage with Measures (continued) 7. Communicate Results (continued) : third example Objective: 41
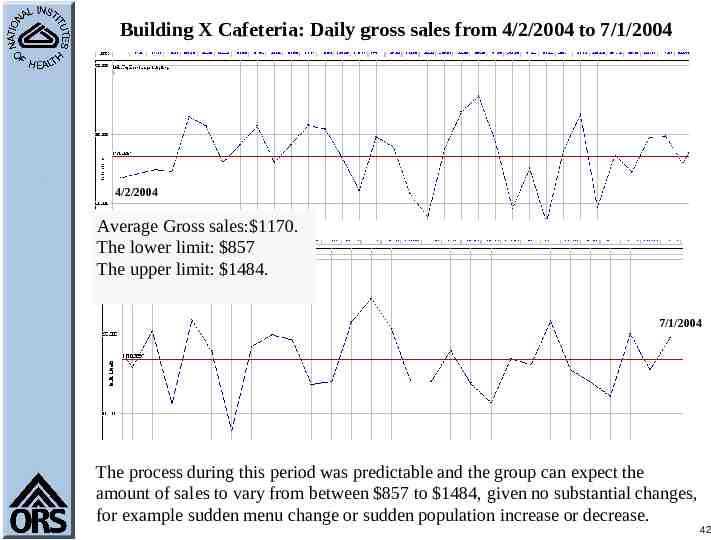
Building X Cafeteria: Daily gross sales from 4/2/2004 to 7/1/2004 4/2/2004 Average Gross sales: 1170. The lower limit: 857 The upper limit: 1484. 7/1/2004 The process during this period was predictable and the group can expect the amount of sales to vary from between 857 to 1484, given no substantial changes, for example sudden menu change or sudden population increase or decrease. 42
Steps to Develop and Manage with Measures (continued) 8. Integrate Measurement with Management Processes The benefit of performance measurement comes from using data to take the appropriate actions to improve performance. To remaining viable, demonstrate service group value through results. Integrate results (input, activity, output) into planning, budgeting, and operating processes in the business. 43
Summary of Steps to Develop and Manage with Measures: 1. Link Processes to Objectives 2. Identify and Select Performance Measures 3. Establish Baseline to Compare Future Performance 4. Select Processes with the Greatest Operational Impact 5. Collect Data 6. Analyze Results 7. Communicate Results 8. Integrate Measurement with Management Processes 44
MANAGING WITH MEASURES: ADDITONAL EXAMPLES FOCUSING ON STEPS 6 & 7
CUSTOMER PERSPECTIVE
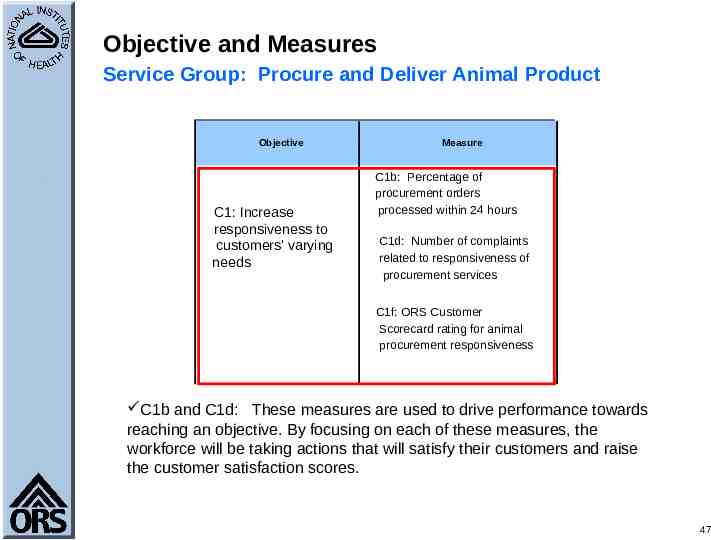
Objective and Measures Service Group: Procure and Deliver Animal Product Objective C1: Increase responsiveness to customers' varying needs Measure C1b: Percentage of procurement orders processed within 24 hours C1d: Number of complaints related to responsiveness of procurement services C1f: ORS Customer Scorecard rating for animal procurement responsiveness C1b and C1d: These measures are used to drive performance towards reaching an objective. By focusing on each of these measures, the workforce will be taking actions that will satisfy their customers and raise the customer satisfaction scores. 47
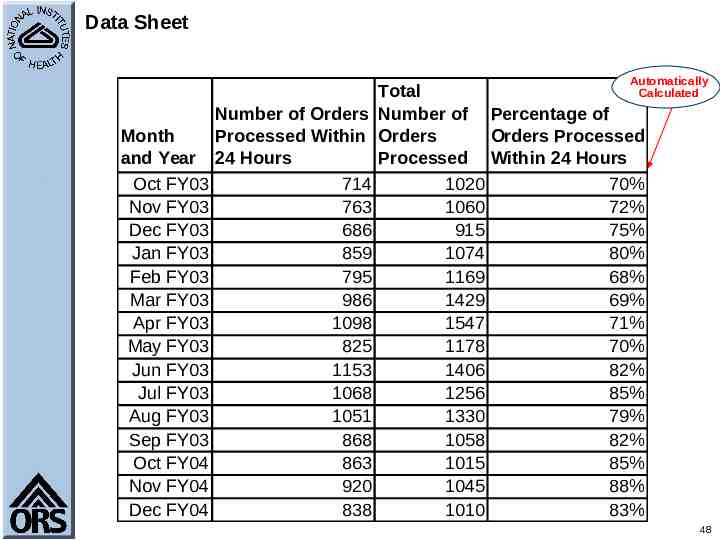
Data Sheet Automatically Month and Year Oct FY03 Nov FY03 Dec FY03 Jan FY03 Feb FY03 Mar FY03 Apr FY03 May FY03 Jun FY03 Jul FY03 Aug FY03 Sep FY03 Oct FY04 Nov FY04 Dec FY04 Number of Orders Processed Within 24 Hours 714 763 686 859 795 986 1098 825 1153 1068 1051 868 863 920 838 Total Calculated Number of Percentage of Orders Orders Processed Processed Within 24 Hours 1020 70% 1060 72% 915 75% 1074 80% 1169 68% 1429 69% 1547 71% 1178 70% 1406 82% 1256 85% 1330 79% 1058 82% 1015 85% 1045 88% 1010 83% 48
Output Measure: % of Procurements Processed within 24 hours (C1b)
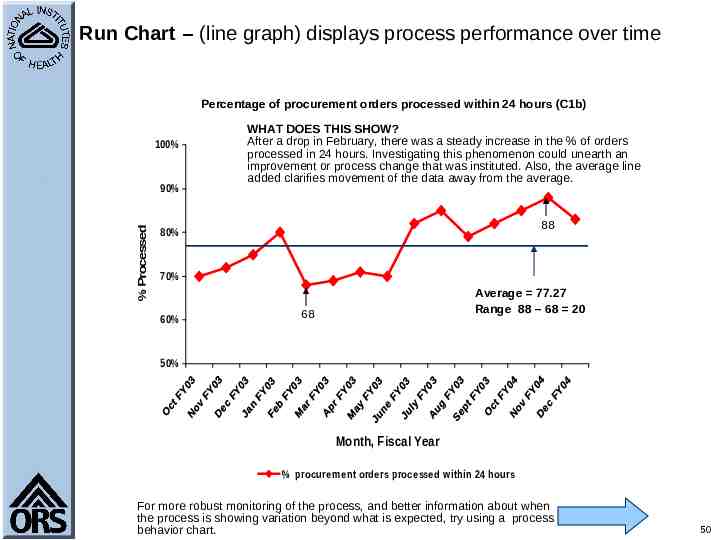
Run Chart – (line graph) displays process performance over time Percentage of procurement orders processed within 24 hours (C1b) 100% % Processed 90% WHAT DOES THIS SHOW? After a drop in February, there was a steady increase in the % of orders processed in 24 hours. Investigating this phenomenon could unearth an improvement or process change that was instituted. Also, the average line added clarifies movement of the data away from the average. 88 80% 70% 60% Average 77.27 Range 88 – 68 20 68 50% Month, Fiscal Year % procurement orders processed within 24 hours For more robust monitoring of the process, and better information about when the process is showing variation beyond what is expected, try using a process behavior chart. 50
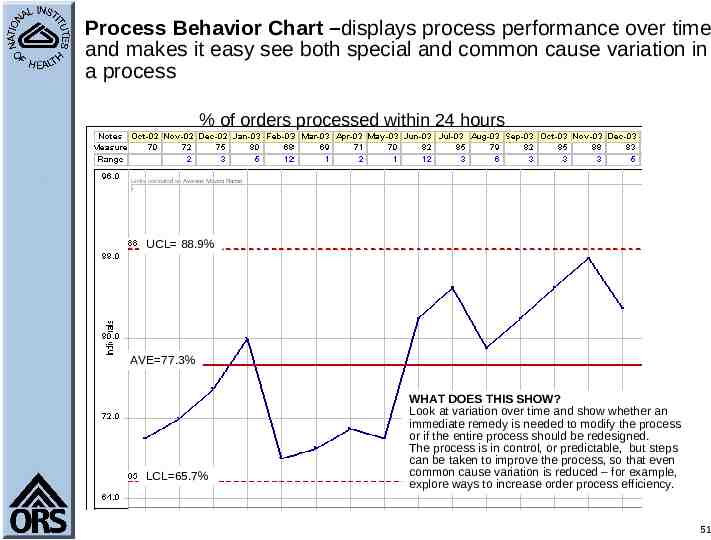
Process Behavior Chart –displays process performance over time and makes it easy see both special and common cause variation in a process % of orders processed within 24 hours UCL 88.9% AVE 77.3% LCL 65.7% WHAT DOES THIS SHOW? Look at variation over time and show whether an immediate remedy is needed to modify the process or if the entire process should be redesigned. The process is in control, or predictable, but steps can be taken to improve the process, so that even common cause variation is reduced – for example, explore ways to increase order process efficiency. 51
Analysis The Process Behavior Chart (PBC) indicates the average percentage of procurement orders processed within 24 hours is 77.3%. The PBC indicates that you can expect between 65.7 % and 88.9% of orders will be processed within 24 hours each month unless there is a change to the process. Is our performance good enough? Are we meeting customer expectations? Refer to baselines and calculated targets, as well as customer agreements and satisfaction ratings. 52
Output Measure: ORS Customer Scorecard ratings for animal procurement responsiveness (C1f)
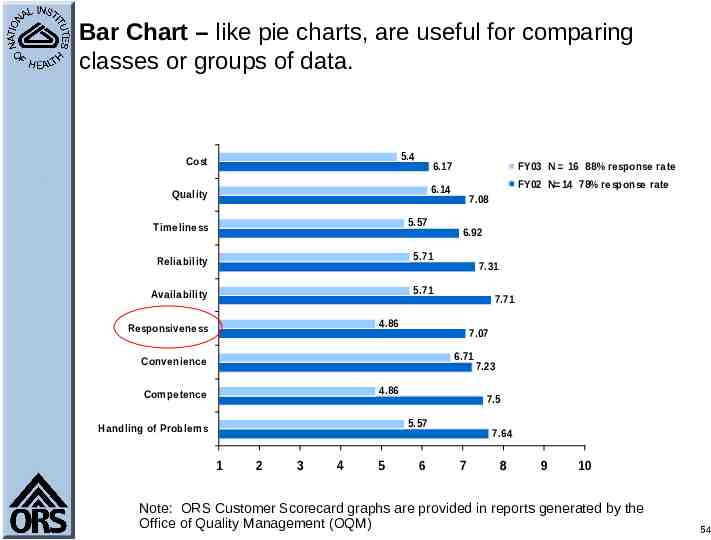
Bar Chart – like pie charts, are useful for comparing classes or groups of data. N 7 FY03 N 14 FY02 5.4 Cost 6.17 5.4 6.14 Cost Quality Quality 5.57 Timeliness Timeliness FY03 N 16 88% response rate 6.92 7.31 5.71 Reliability 7.31 7.71 5.71 Availability 5.71 Availability 4.86 Responsiveness 7.71 7.07 4.86 Responsiveness 6.71 Convenience Convenience 4.86 Competence 4.86 5.57 Competence Handling of Problems Handling of Problems 1 2 1 5.57 3 4 5 2 3 4 6 5 7.08 6.92 5.57 5.71 Reliability FY02 N 14 78% response rate 6.17 7.08 6.14 7.07 7.23 6.71 7.23 7.5 7.64 7 6 8 7 7.5 7.64 8 9 10 9 10 Note: ORS Customer Scorecard graphs are provided in reports generated by the Office of Quality Management (OQM) 54
LEARNING AND GROWTH
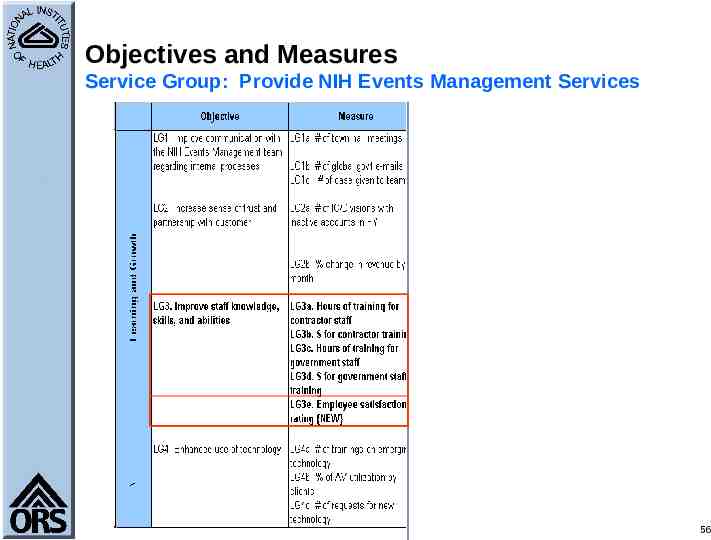
Objectives and Measures Service Group: Provide NIH Events Management Services 56
Input Measure: Measure: Employee Satisfaction Survey Results (LG3e)
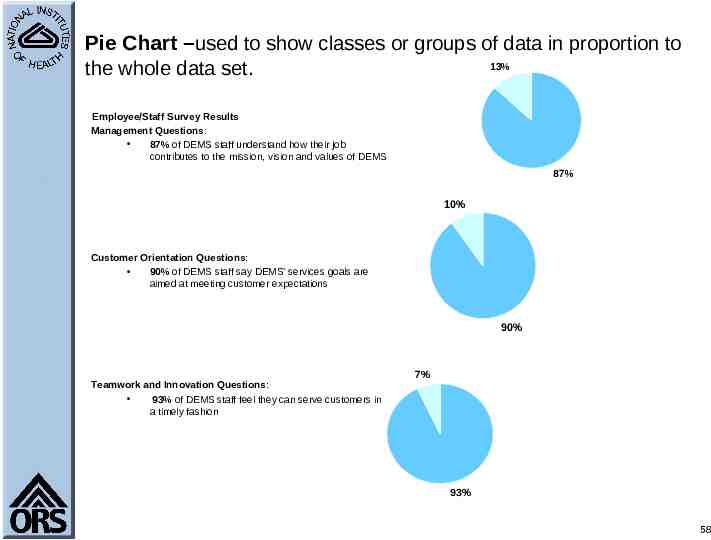
Pie Chart –used to show classes or groups of data in proportion to 13% the whole data set. Employee/Staff Survey Results Management Questions: 87% of DEMS staff understand how their job contributes to the mission, vision and values of DEMS 87% 10% Customer Orientation Questions: 90% of DEMS staff say DEMS’ services goals are aimed at meeting customer expectations 90% Teamwork and Innovation Questions: 93% of DEMS staff feel they can serve customers in a timely fashion 7% 93% 58
Analysis A high percentage of staff feel they understand the organization’s mission, the goals match customer expectations, and they can serve customers in a timely manner. Lower percentages on the charts should be addressed. Practical corrective actions should be employed to maintain and/or improve performance. The information serves as input to the overall service and processes provided by the group; improvement in learning and growth areas drives behavior to achieve objectives. 59
FINANCIAL PERSPECTIVE
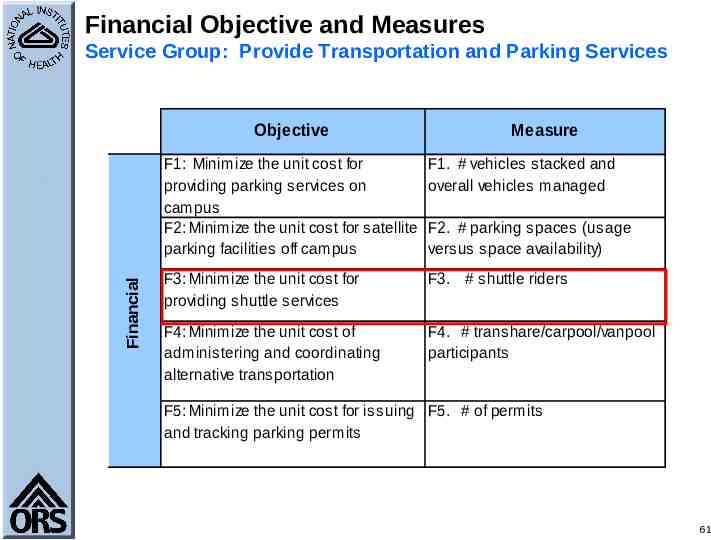
Financial Objective and Measures Service Group: Provide Transportation and Parking Services Financial Objective Measure F1: Minimize the unit cost for providing parking services on campus F2: Minimize the unit cost for satellite parking facilities off campus F1. # vehicles stacked and overall vehicles managed F3: Minimize the unit cost for providing shuttle services F3. # shuttle riders F4: Minimize the unit cost of administering and coordinating alternative transportation F4. # transhare/carpool/vanpool participants F2. # parking spaces (usage versus space availability) F5: Minimize the unit cost for issuing F5. # of permits and tracking parking permits 61
Input Measure: Minimize the unit cost for providing shuttle services (F3)
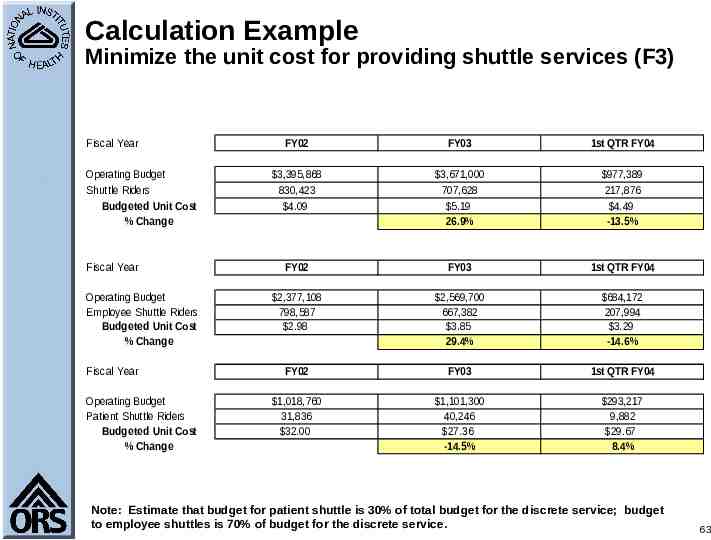
Calculation Example Minimize the unit cost for providing shuttle services (F3) Fiscal Year Operating Budget Shuttle Riders Budgeted Unit Cost % Change Fiscal Year Operating Budget Employee Shuttle Riders Budgeted Unit Cost % Change Fiscal Year Operating Budget Patient Shuttle Riders Budgeted Unit Cost % Change FY02 FY03 1st QTR FY04 3,395,868 830,423 4.09 3,671,000 707,628 5.19 26.9% 977,389 217,876 4.49 -13.5% FY02 FY03 1st QTR FY04 2,377,108 798,587 2.98 2,569,700 667,382 3.85 29.4% 684,172 207,994 3.29 -14.6% FY02 FY03 1st QTR FY04 1,018,760 31,836 32.00 1,101,300 40,246 27.36 -14.5% 293,217 9,882 29.67 8.4% Note: Estimate that budget for patient shuttle is 30% of total budget for the discrete service; budget to employee shuttles is 70% of budget for the discrete service. 63
Analysis Example Determined the basic unit of service delivery – number of riders Counted the number of riders on shuttle – this becomes the denominator for the unit cost formula Determined the dollar resources expended in providing shuttle service – this becomes the numerator of the unit cost formula The ratio of numerator ( ) divided by denominator (riders) yields cost per rider on the shuttles Use this and other data to reveal methods to maintain (or if possible lower) the “unit cost” – example is to encourage more riders - lowers unit cost ( reason: more riders for same resources) 64
Integrating Data into Business Management
Questions to integrate performance data into Business Management: How can the performance data be used to improve business decisions? Examine data for trends over time and across functions. What do the results mean? Do the results contribute to goals and objectives? Have the right measures been included in the PMP? Does the PMP reflect our priorities? Are the performance results helping the manager make better decisions? If not, notify the team or individuals that are responsible about the data that is needed. If the performance results exceed the targets, how can the service group take advantage of additional benefits to improve service and reduce operating costs? What opportunities do the additional benefits make possible? 66
Questions to integrate performance data into Management (continued): What is the level of customer satisfaction? If the results fall short of the targets, what inhibited performance? Were the inhibitors technical or organizational in nature? Source: Performance Based Management, P. Plunkett 67
For more information on Performance Management in the Office of Research services: http://oqm.ors.od.nih.gov/performance mgmt.htm Acknowledgments This training was developed by the Office of Quality Management.