An In-Depth Examination of Java I/O Performance and Possible

37 Slides212.00 KB
An In-Depth Examination of Java I/O Performance and Possible Tuning Strategies Kai Xu [email protected] Hongfei Guo [email protected]
Outline Why bother? (Problems) Our goals Java I/O overview Tests design Test results and analysis Conclusions
Why bother? Growing interest in using Java Much works had been done in Java performance evaluation but NOT in Java I/O
Our Goals Is it really bad (Compared with C/C ) How bad Possible tuning strategies How well they work
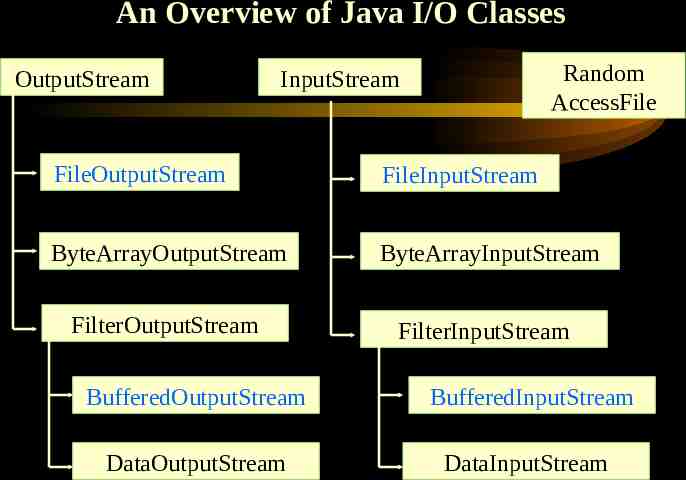
An Overview of Java I/O Classes OutputStream Random AccessFile InputStream FileOutputStream FileInputStream ByteArrayOutputStream ByteArrayInputStream FilterOutputStream FilterInputStream BufferedOutputStream BufferedInputStream DataOutputStream DataInputStream
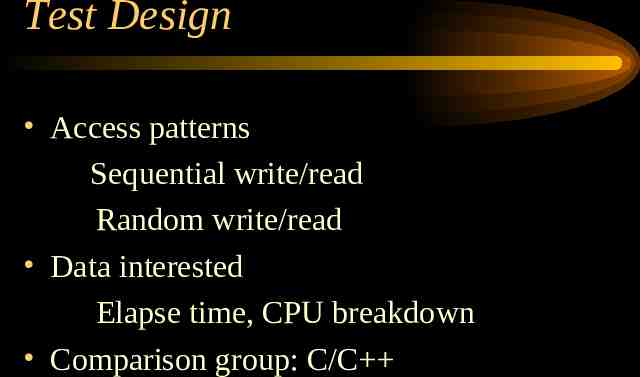
Test Design Access patterns Sequential write/read Random write/read Data interested Elapse time, CPU breakdown Comparison group: C/C
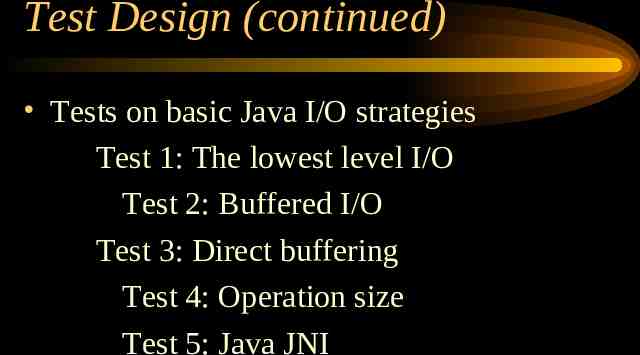
Test Design (continued) Tests on basic Java I/O strategies Test 1: The lowest level I/O Test 2: Buffered I/O Test 3: Direct buffering Test 4: Operation size Test 5: Java JNI
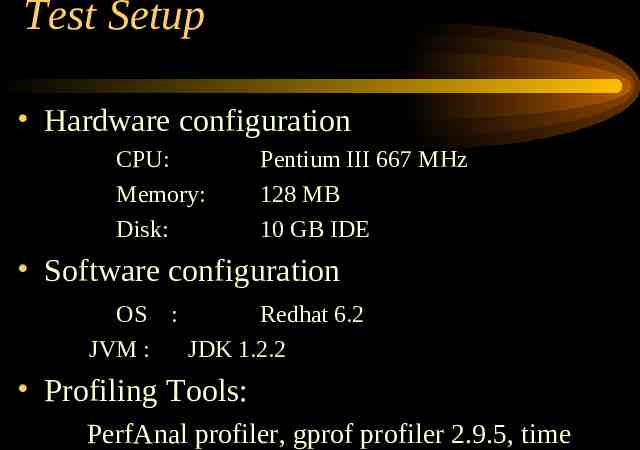
Test Setup Hardware configuration CPU: Memory: Disk: Pentium III 667 MHz 128 MB 10 GB IDE Software configuration OS : Redhat 6.2 JVM : JDK 1.2.2 Profiling Tools: PerfAnal profiler, gprof profiler 2.9.5, time
Test 1: The lowest level Java I/O Test parameters: buffer size : 0 Byte operation size : 1 Byte Sequential Write/Read Random Write/Read
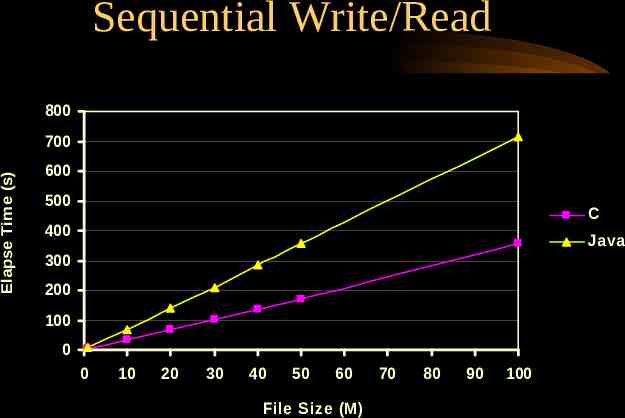
Sequential Write/Read 800 Elapse Time (s) 700 600 500 C 400 Java 300 200 100 0 0 10 20 30 40 50 60 File Size (M) 70 80 90 100
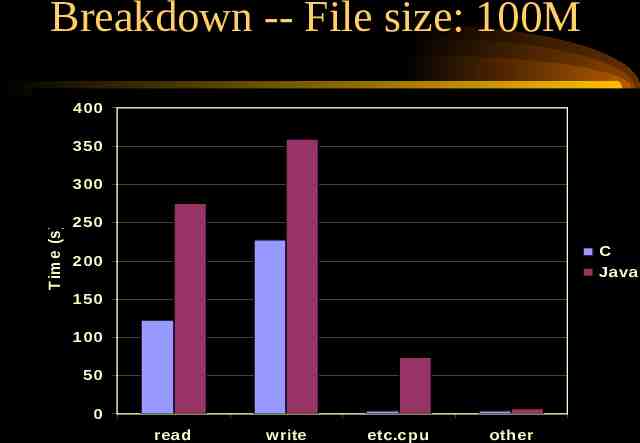
Breakdown -- File size: 100M 400 350 T im e (s ) 300 250 C Java 200 150 100 50 0 read write etc.cpu other
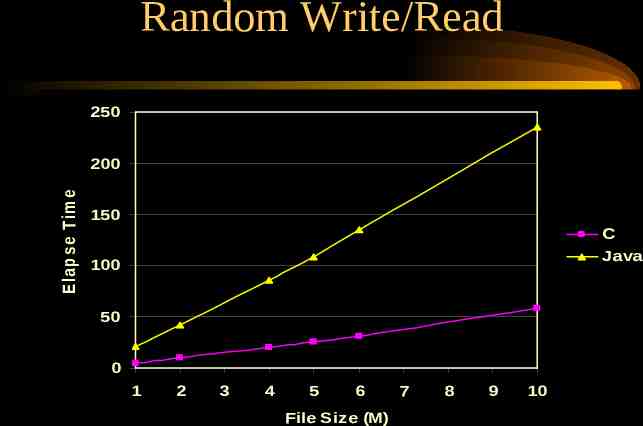
Random Write/Read E la p s e T im e (s ) 250 200 150 C Java 100 50 0 1 2 3 4 5 6 File Size (M) 7 8 9 10
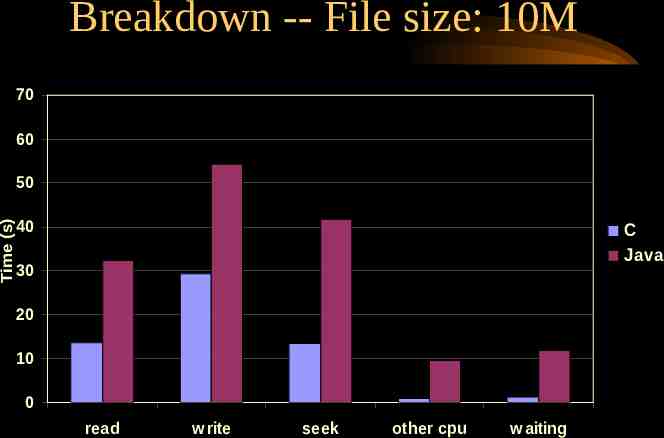
Breakdown -- File size: 10M 70 60 Time (s) 50 40 C Java 30 20 10 0 read w rite seek other cpu w aiting
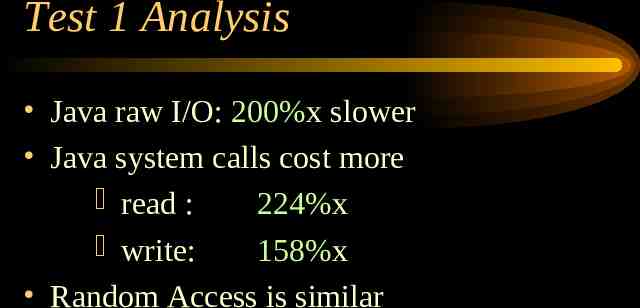
Test 1 Analysis Java raw I/O: 200%x slower Java system calls cost more read : 224%x write: 158%x Random Access is similar
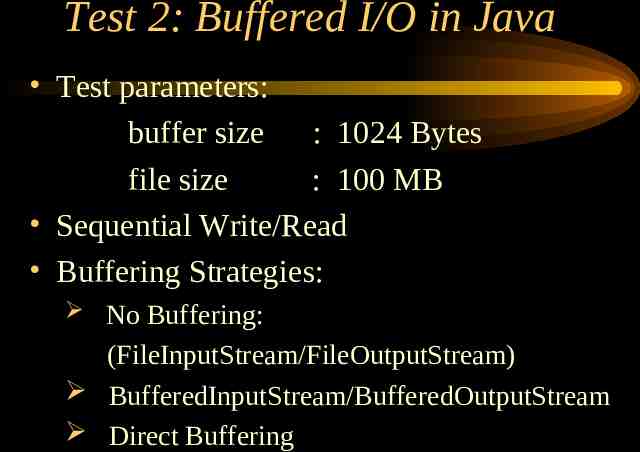
Test 2: Buffered I/O in Java Test parameters: buffer size : 1024 Bytes file size : 100 MB Sequential Write/Read Buffering Strategies: No Buffering: (FileInputStream/FileOutputStream) BufferedInputStream/BufferedOutputStream Direct Buffering
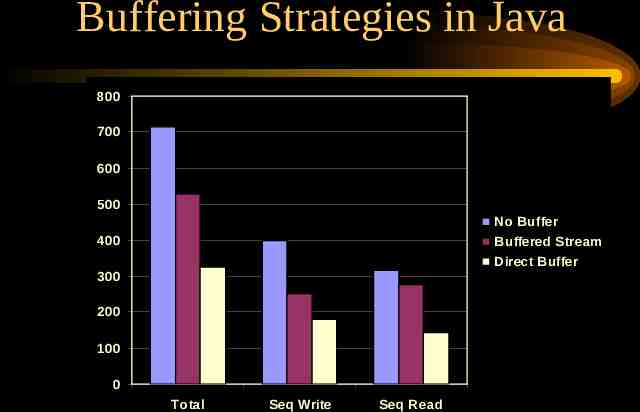
Buffering Strategies in Java 800 700 600 500 No Buffer Buffered Stream Direct Buffer 400 300 200 100 0 Total Seq Write Seq Read
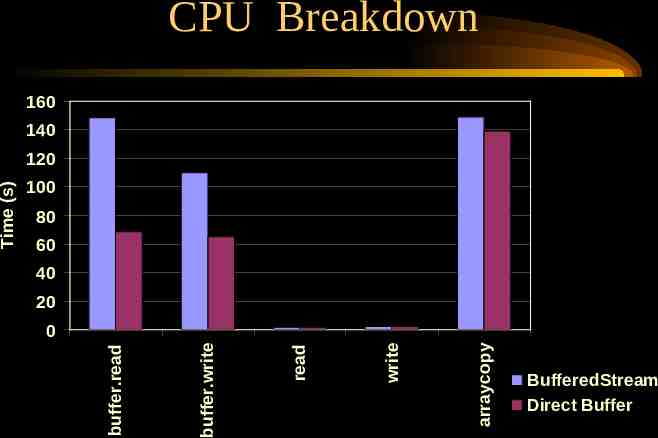
CPU Breakdown 160 140 100 80 60 40 20 arraycopy write read buffer.write 0 buffer.read Time (s) 120 BufferedStream Direct Buffer
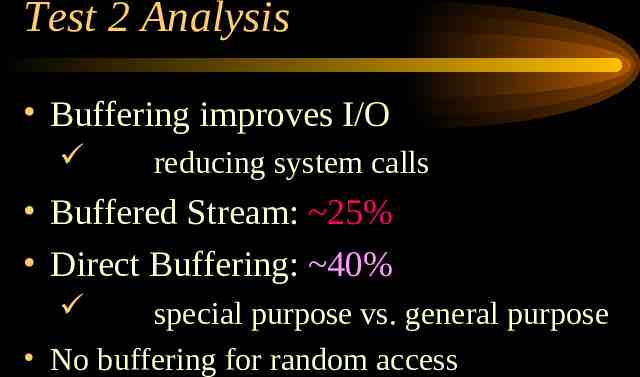
Test 2 Analysis Buffering improves I/O reducing system calls Buffered Stream: 25% Direct Buffering: 40% special purpose vs. general purpose No buffering for random access
Test 3: Direct Buffering Test parameters: file size : 100 MB operation size : 1 Byte Sequential Write/Read Random Write/Read
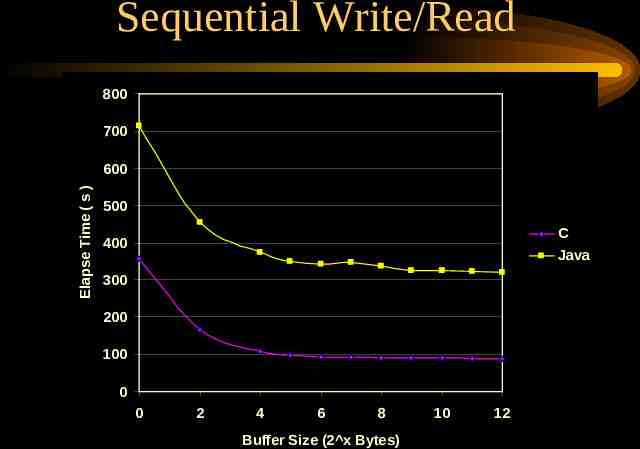
Sequential Write/Read 800 700 Elapse Time ( s ) 600 500 C Java 400 300 200 100 0 0 2 4 6 8 Buffer Size (2 x Bytes) 10 12
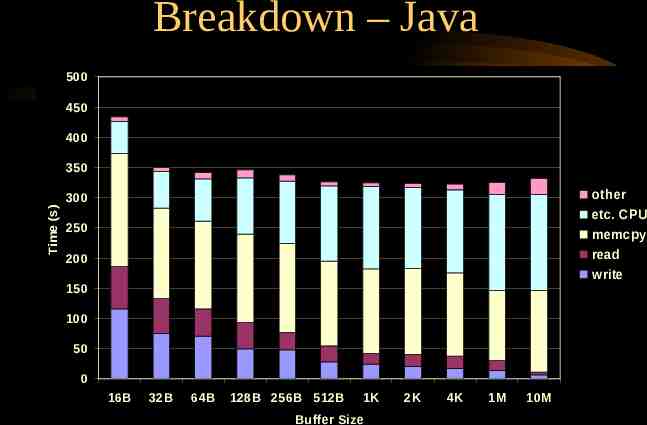
Breakdown – Java 500 450 400 Time (s) 350 other etc. CPU memcpy read write 300 250 200 150 100 50 0 16B 32B 64B 128B 256B 512B 1K Buffer Size 2K 4K 1M 10M
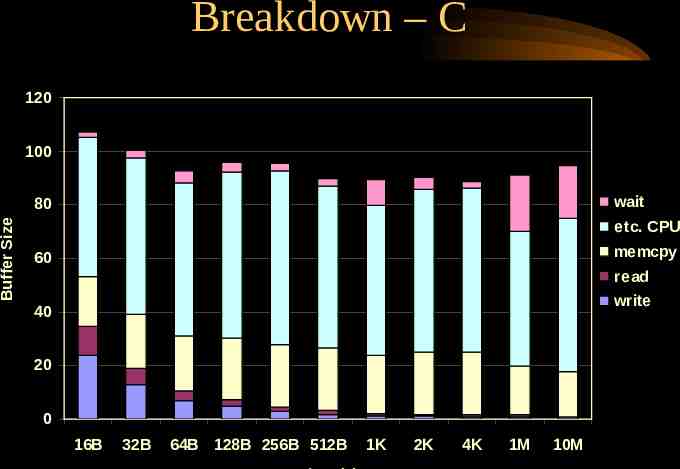
Breakdown – C 120 100 wait Buffer Size 80 etc. CPU memcpy 60 read write 40 20 0 16B 32B 64B 128B 256B 512B 1K 2K 4K 1M 10M
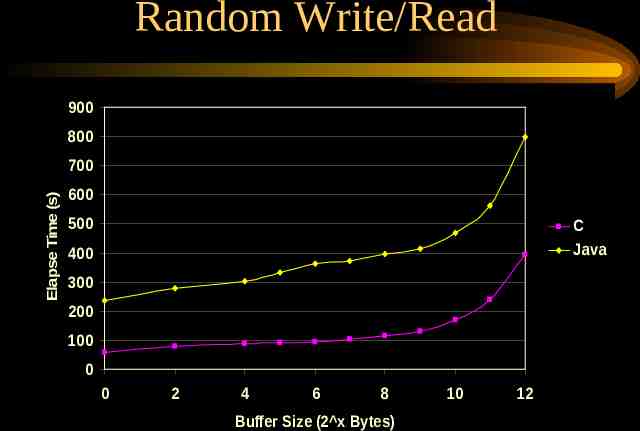
Random Write/Read 900 800 Elapse Time (s) 700 600 500 C Java 400 300 200 100 0 0 2 4 6 8 Buffer Size (2 x Bytes) 10 12
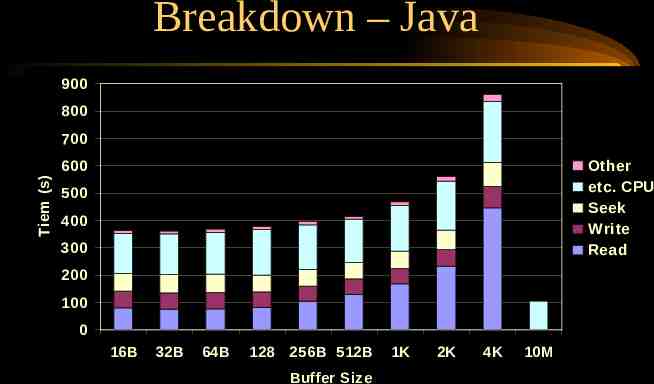
Breakdown – Java 900 800 700 Other etc. CPU Seek Write Read Tiem (s) 600 500 400 300 200 100 0 16B 32B 64B 128 256B 512B Buffer Size 1K 2K 4K 10M
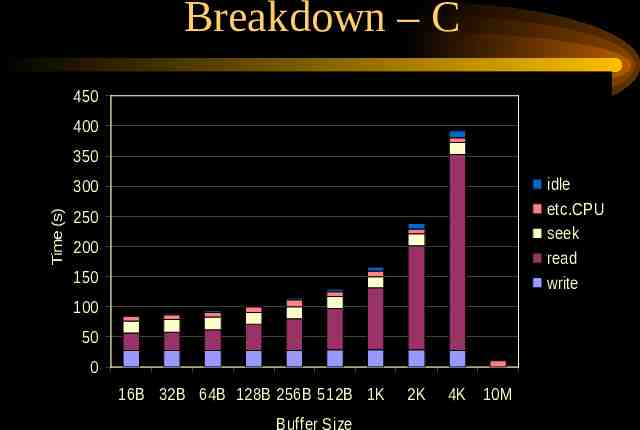
Breakdown – C 450 400 350 idle etc.CPU seek read write Time (s) 300 250 200 150 100 50 0 16B 32B 64B 128B 256B 512B 1K Buffer Size 2K 4K 10M
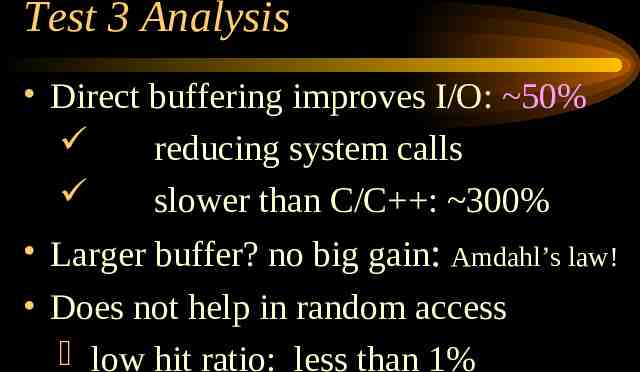
Test 3 Analysis Direct buffering improves I/O: 50% reducing system calls slower than C/C : 300% Larger buffer? no big gain: Amdahl’s law! Does not help in random access low hit ratio: less than 1%
Test 4: Operation Size Test parameters: buffer size Sequential Write/Read Random Write/Read : 0 Byte
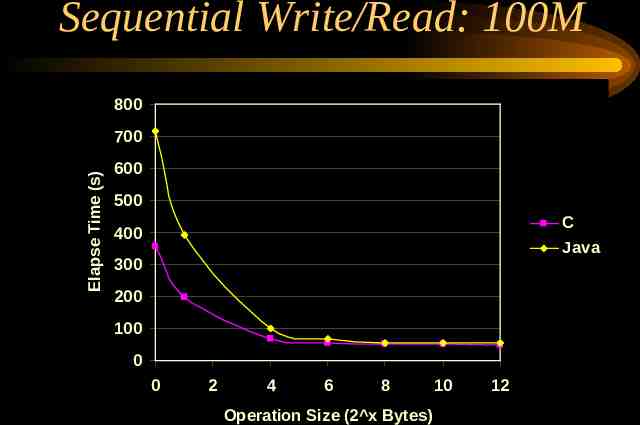
Sequential Write/Read: 100M 800 Elapse Time (s) 700 600 500 C 400 Java 300 200 100 0 0 2 4 6 8 Operation Size (2 x Bytes) 10 12
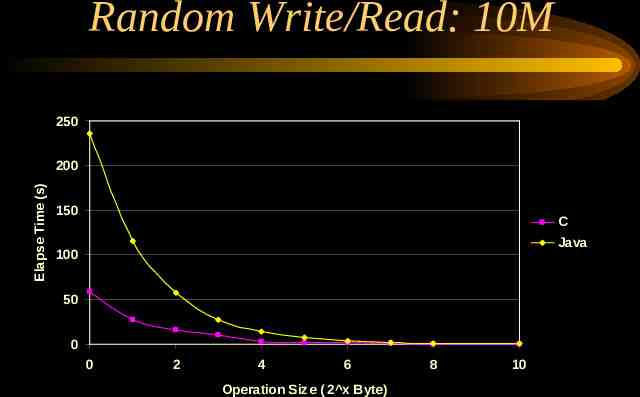
Random Write/Read: 10M 250 Elapse Time (s) 200 150 C Java 100 50 0 0 2 4 6 Operation Size ( 2 x Byte) 8 10
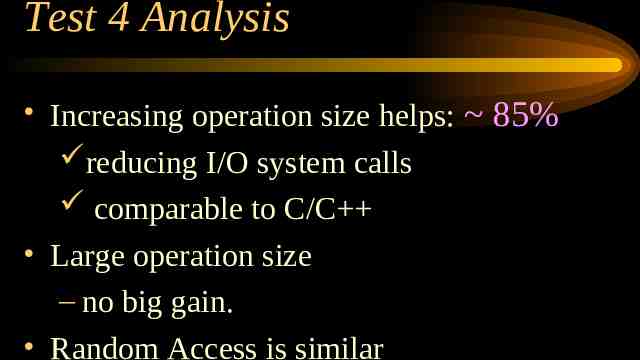
Test 4 Analysis Increasing operation size helps: 85% reducing I/O system calls comparable to C/C Large operation size – no big gain. Random Access is similar
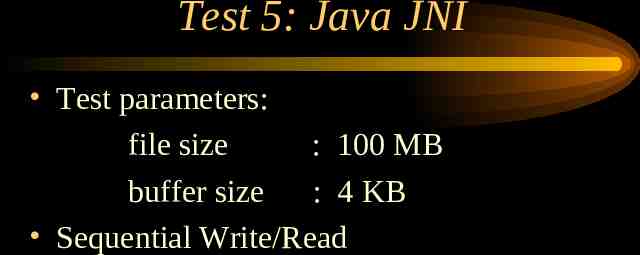
Test 5: Java JNI Test parameters: file size : 100 MB buffer size : 4 KB Sequential Write/Read
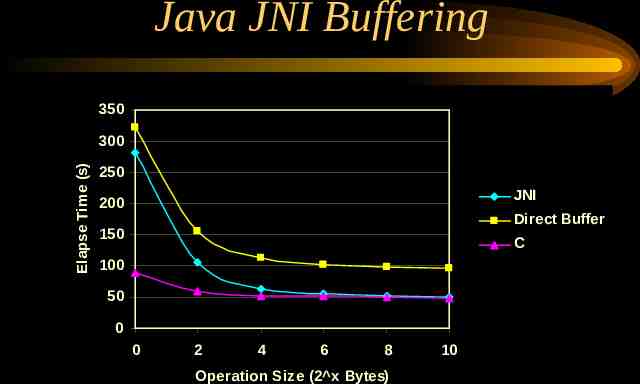
Java JNI Buffering 350 Elapse Time (s) 300 250 JNI 200 Direct Buffer 150 C 100 50 0 0 2 4 6 8 Operation Size (2 x Bytes) 10
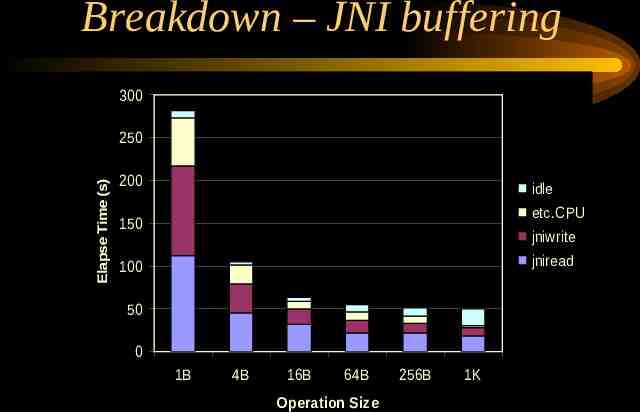
Breakdown – JNI buffering 300 Elapse Time (s) 250 200 idle etc.CPU 150 jniwrite jniread 100 50 0 1B 4B 16B 64B Operation Size 256B 1K
Test 5 Analysis I/O system calls are cheap (C/C level); But, cost of calling native method is high; Small operation size: more native calls, comparable to Direct Buffering; Large operation size: less native calls, comparable to C/C .
Conclusions Java raw I/O: 200%x slower than C Buffering improves I/O Reducing system calls 220% improvement vs. no buffer But, still 364%x slower than C Random I/O – no help with buffering? – locality of access;
Conclusions (continued) Increasing operation size helps Comparable to C/C JNI system calls are cheap (C/C level); cost of calling native method is high; reduce native call times: Comparable to C/C
Thank You