Magnitude-Based Decisions as Hypothesis Tests Will Hopkins
22 Slides236.74 KB
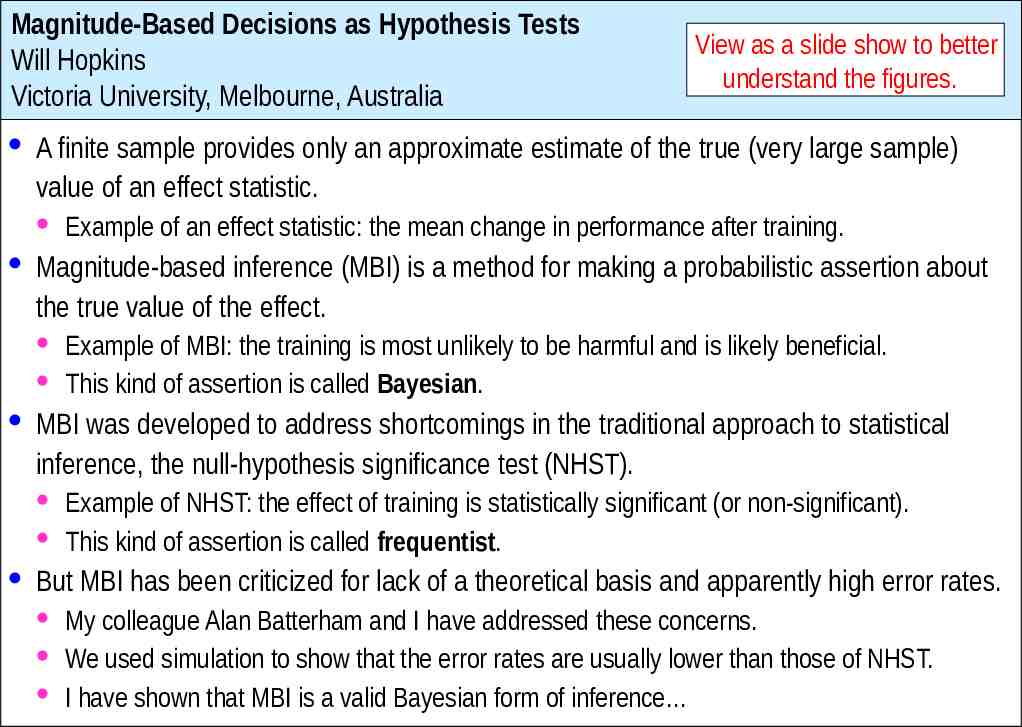
Magnitude-Based Decisions as Hypothesis Tests Will Hopkins Victoria University, Melbourne, Australia View as a slide show to better understand the figures. · A finite sample provides only an approximate estimate of the true (very large sample) value of an effect statistic. · Example of an effect statistic: the mean change in performance after training. · Magnitude-based inference (MBI) is a method for making a probabilistic assertion about the true value of the effect. · Example of MBI: the training is most unlikely to be harmful and is likely beneficial. · This kind of assertion is called Bayesian. · MBI was developed to address shortcomings in the traditional approach to statistical inference, the null-hypothesis significance test (NHST). · Example of NHST: the effect of training is statistically significant (or non-significant). · This kind of assertion is called frequentist. · But MBI has been criticized for lack of a theoretical basis and apparently high error rates. · My colleague Alan Batterham and I have addressed these concerns. · We used simulation to show that the error rates are usually lower than those of NHST. · I have shown that MBI is a valid Bayesian form of inference
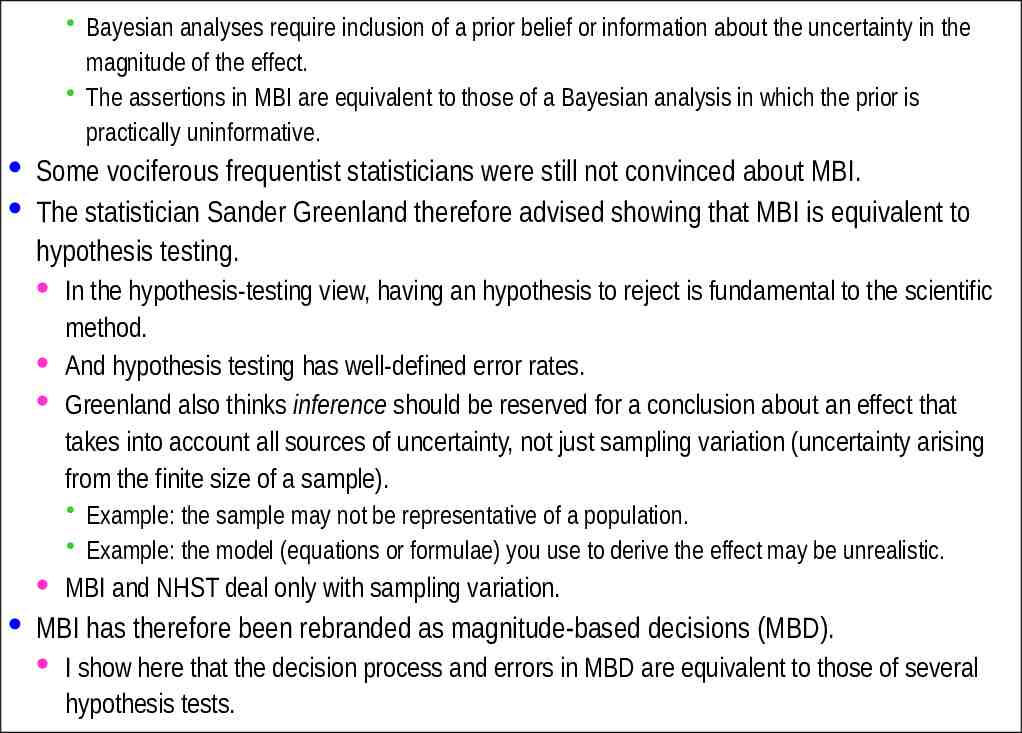
Bayesian analyses require inclusion of a prior belief or information about the uncertainty in the magnitude of the effect. The assertions in MBI are equivalent to those of a Bayesian analysis in which the prior is practically uninformative. · Some vociferous frequentist statisticians were still not convinced about MBI. · The statistician Sander Greenland therefore advised showing that MBI is equivalent to hypothesis testing. · In the hypothesis-testing view, having an hypothesis to reject is fundamental to the scientific method. · And hypothesis testing has well-defined error rates. · Greenland also thinks inference should be reserved for a conclusion about an effect that takes into account all sources of uncertainty, not just sampling variation (uncertainty arising from the finite size of a sample). Example: the sample may not be representative of a population. Example: the model (equations or formulae) you use to derive the effect may be unrealistic. · MBI and NHST deal only with sampling variation. · MBI has therefore been rebranded as magnitude-based decisions (MBD). · I show here that the decision process and errors in MBD are equivalent to those of several hypothesis tests.
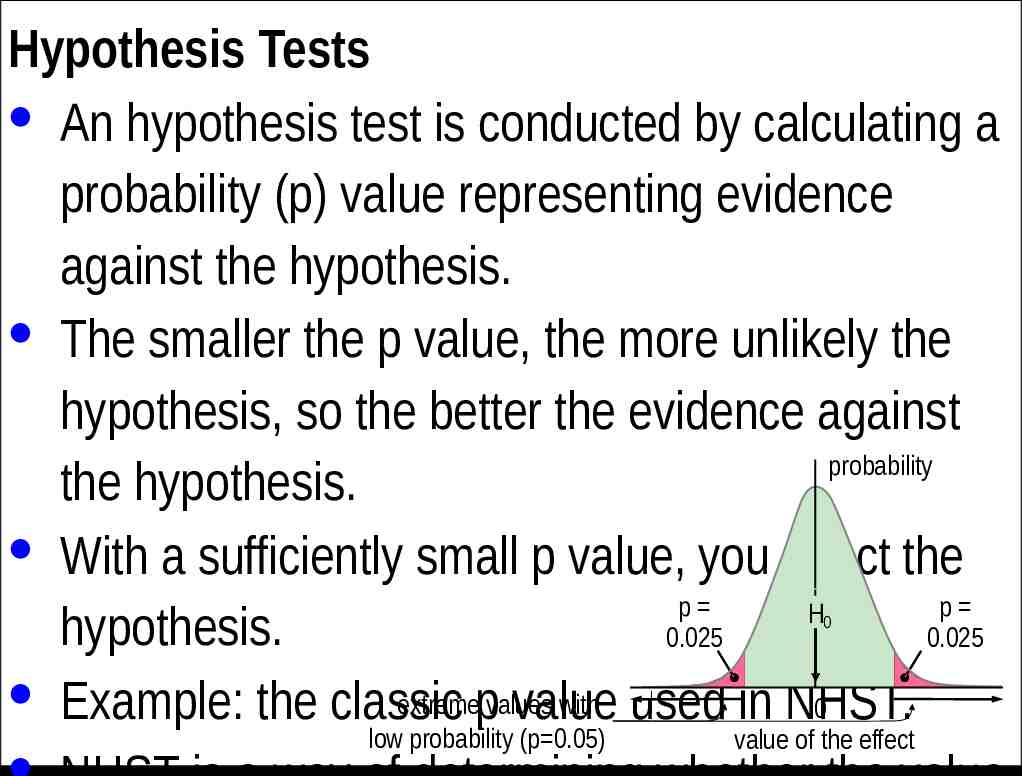
Hypothesis Tests · An hypothesis test is conducted by calculating a probability (p) value representing evidence against the hypothesis. · The smaller the p value, the more unlikely the hypothesis, so the better the evidence against probability the hypothesis. · With a sufficiently small p value, you reject the p p H hypothesis. 0.025 0.025 · Example: the classic extremepvalues with used in NHST. 0 value 0 low probability (p 0.05) value of the effect
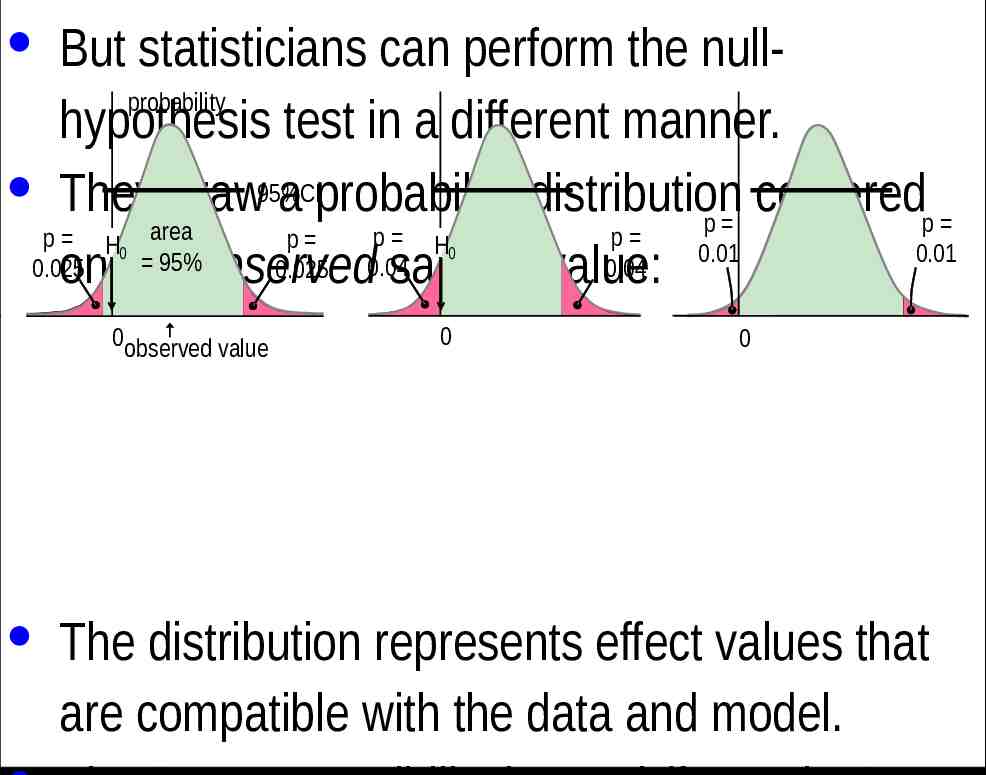
· But statisticians can perform the nullprobability hypothesis test in a different manner. · They draw95%CI a probability distribution centered p p area p p p H p H 0.01 0.01 95% 0.04 0.025 0.025 0.04 on the observed sample value: 0 0observed value 0 0 0 · The distribution represents effect values that are compatible with the data and model.
· The Bayesian interpretation of the 95%CI is the range in which the true effect is 95% likely to fall. · If the range includes zero, the true effect "could be" zero. · Of course, no effect can be exactly any value, so it is incorrect to say that the true effect could be zero. · However, it is equally incorrect to state an hypothesis that the true effect is zero, because no effect can ever have a true value of exactly
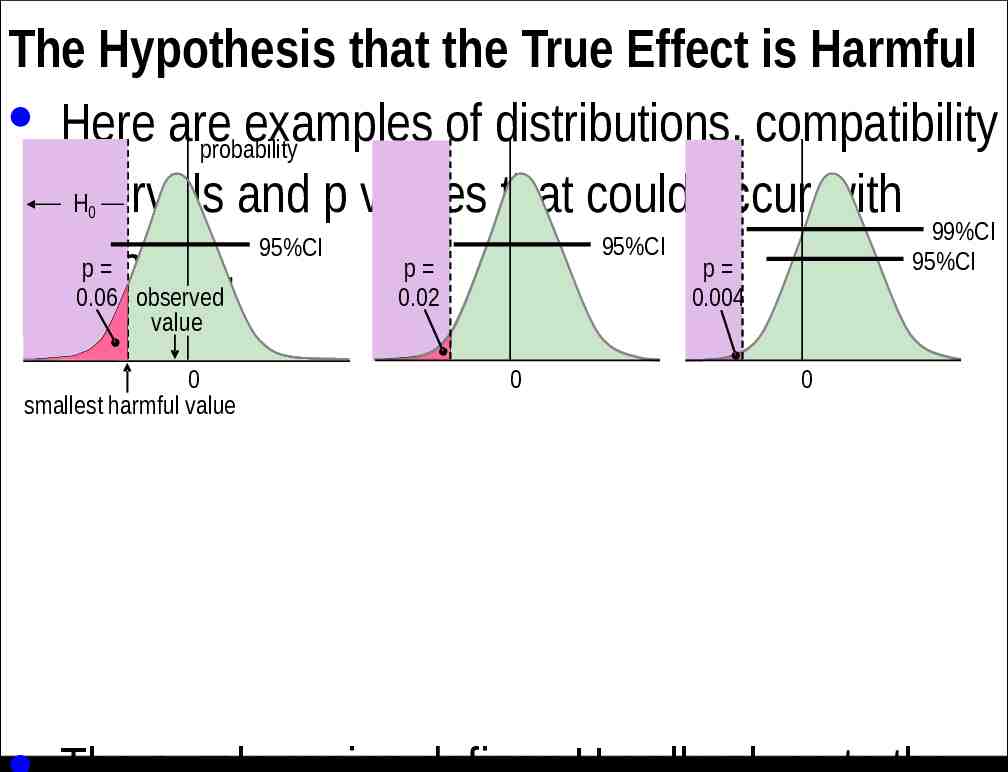
The Hypothesis that the True Effect is Harmful · Here are examples of distributions, compatibility probability H intervals and p values that could occur with 99%CI 95%CI 95%CI 95%CI p p p samples. 0.06 observed 0.02 0.004 0 value 0 smallest harmful value 0 0
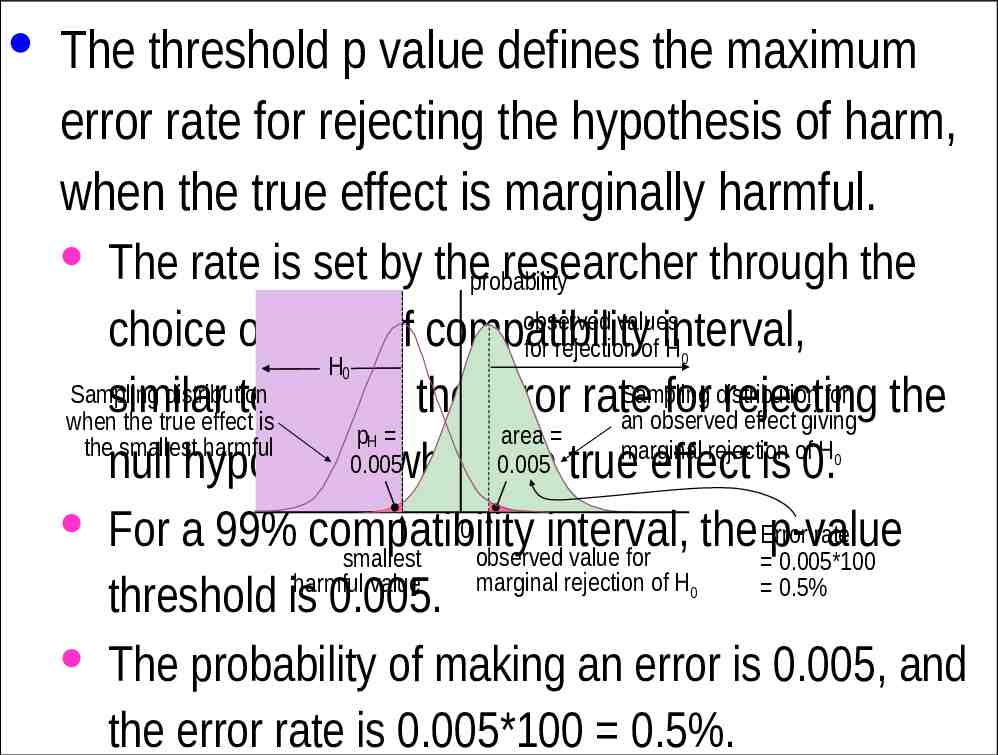
· The threshold p value defines the maximum error rate for rejecting the hypothesis of harm, when the true effect is marginally harmful. · The rate is set by theprobability researcher through the observed values choice of level of compatibility for rejection of interval, H H Sampling distribution for Sampling distribution similar to setting the error rate for rejecting the an observed effect giving when the true effect is p area the smallest harmful marginal rejection of H 0.005 0.005 null hypothesis when the true effect is 0. 0 · For a 99% compatibility Error rate interval, the p-value observed value for smallest 0.005*100 marginal rejection of H harmful value 0.5% threshold is 0.005. · The probability of making an error is 0.005, and the error rate is 0.005*100 0.5%. 0 0 H 0 0
· In the clinical version of MBD, the p value for the test of harm is given a Bayesian interpretation: the probability that the true effect is harmful. · An effect is considered for implementation when the probability of harm is 0.005 ( 0.5%). · This requirement is therefore equivalent to rejecting the hypothesis of harm with p 0.005 in a one-sided interval test. · This equivalence holds, even if the Bayesian interpretation is not accepted by frequentists
· Does p 0.005 represent reasonable evidence against the hypothesis of harm? · Greenland supports converting p values to S or "surprisal" values. · The S value is the number of consecutive heads in coin tossing that would have the same probability as the p value. · The S value is given by ‑log2(p), and with p 0.005, the value is 7.6 head tosses. · So, saying that the treatment is not compatible with harmful values, when the p value is
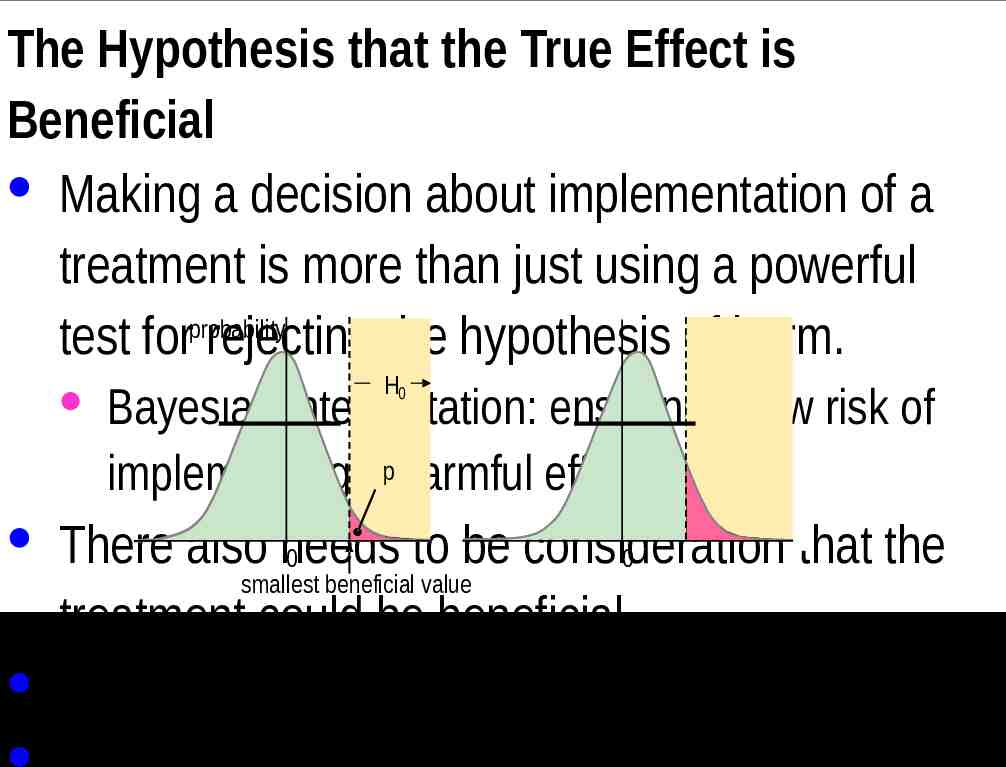
The Hypothesis that the True Effect is Beneficial · Making a decision about implementation of a treatment is more than just using a powerful probability test for rejecting the hypothesis of harm. H0 · Bayesian interpretation: ensuring a low risk of implementing ap harmful effect. · There also needs to be consideration that the 0 0 smallest beneficial value treatment could be beneficial. · Another one-sided test is involved.
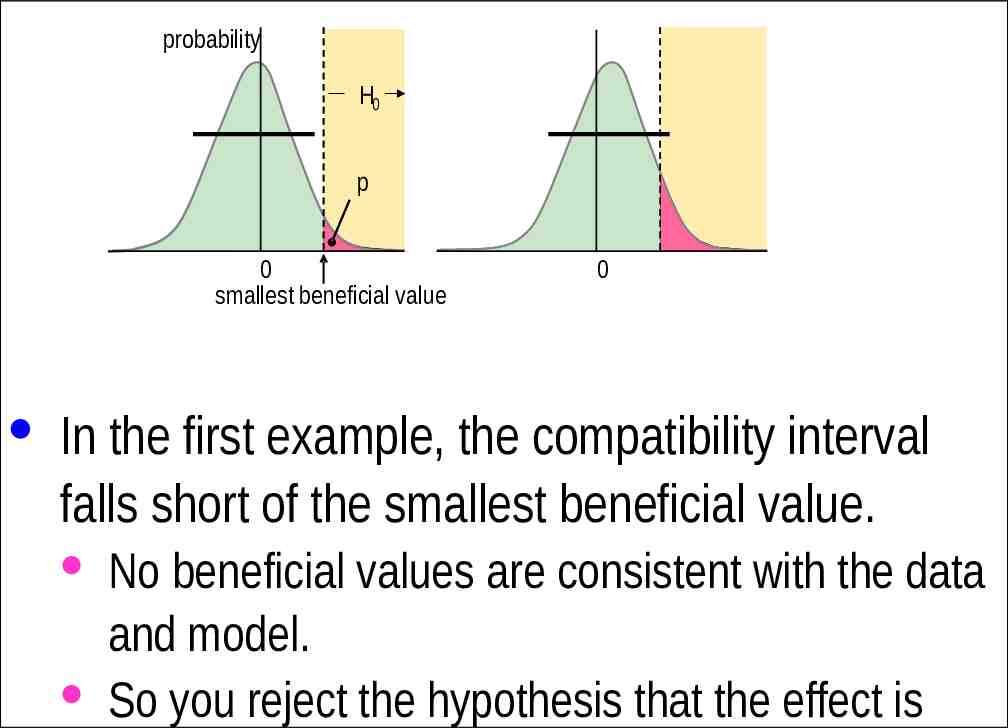
probability H0 p 0 smallest beneficial value 0 · In the first example, the compatibility interval falls short of the smallest beneficial value. · No beneficial values are consistent with the data and model. · So you reject the hypothesis that the effect is
· But what level should the researcher choose for the compatibility interval and the associated threshold p value? · In the calculation of sample size for NHST with 80% power, it is a 60% confidence interval. · The probability distribution of the effect when the observed value is marginally significant has a right-hand tail overlapping the smallest beneficial effect with a probability of 0.20. · Equivalently, there is 80% power or a probability of 0.80 of getting significance when the true effect is the smallest beneficial.
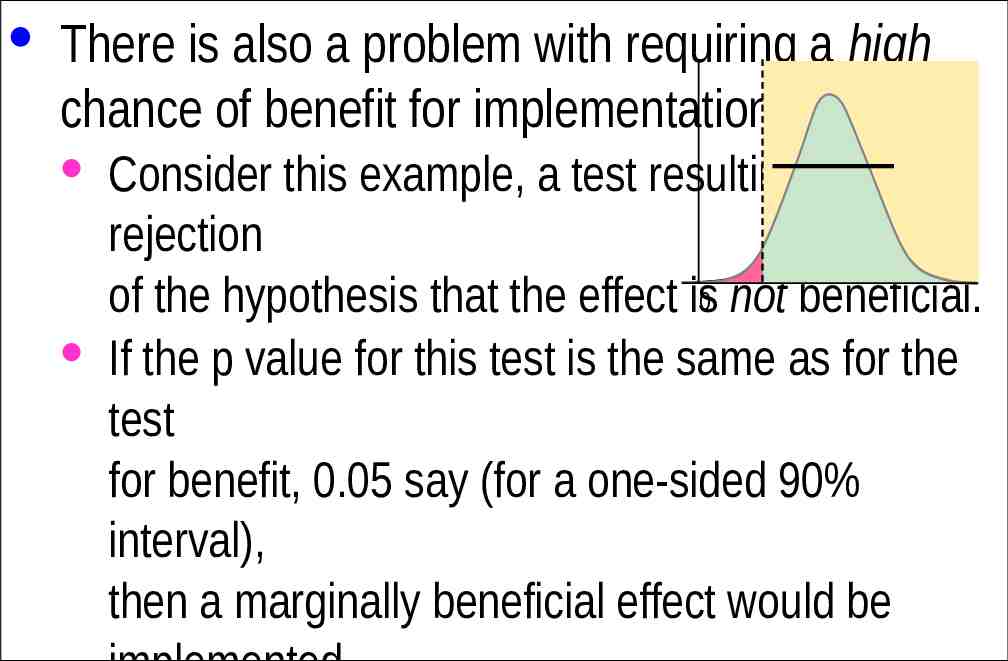
· There is also a problem with requiring a high chance of benefit for implementation. · Consider this example, a test resulting in rejection of the hypothesis that the effect is0 not beneficial. · If the p value for this test is the same as for the test for benefit, 0.05 say (for a one-sided 90% interval), then a marginally beneficial effect would be implemented only 5% of the time, regardless of the sample
Non-clinical MBD as Hypothesis Tests · Clinical MBD is used when an effect could result in a recommendation to implement a treatment. · Example: a new training strategy, which might impair rather than enhance performance compared with current best practice. · Implementing a harmful effect is more serious than failing to implement a beneficial effect. · Hence, with clinical MBD, the two one-sided tests differ in their threshold p values. · Non-clinical MBD is used when an effect could not result in implementation of a treatment.
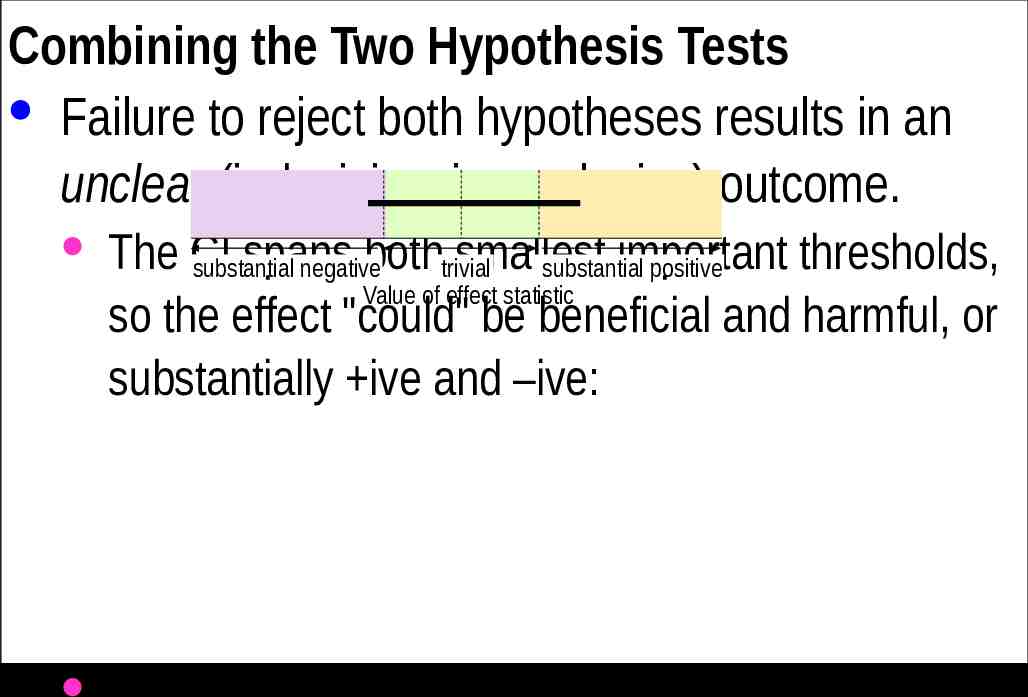
Combining the Two Hypothesis Tests · Failure to reject both hypotheses results in an unclear (indecisive, inconclusive) outcome. · The CI spans bothtrivial smallest important thresholds, substantial negative substantial positive Value of effect statistic so the effect "could" be beneficial and harmful, or substantially ive and –ive: · (For a clinical effect, the CI is 99% on the harm
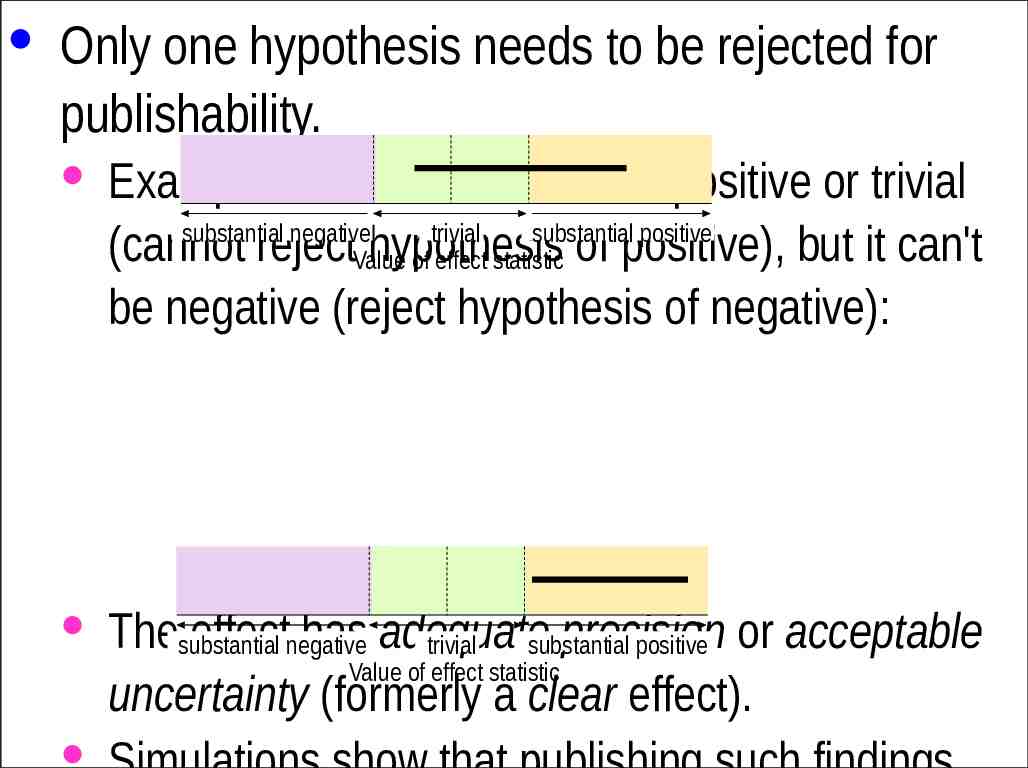
· Only one hypothesis needs to be rejected for publishability. · Example: this effect "could be" positive or trivial substantial negative trivial substantial positive (cannot rejectValue hypothesis of effect statistic of positive), but it can't be negative (reject hypothesis of negative): · Thesubstantial effectnegative has adequate precision trivial substantial positive or acceptable Value of effect statistic uncertainty (formerly a clear effect). · Simulations show that publishing such findings
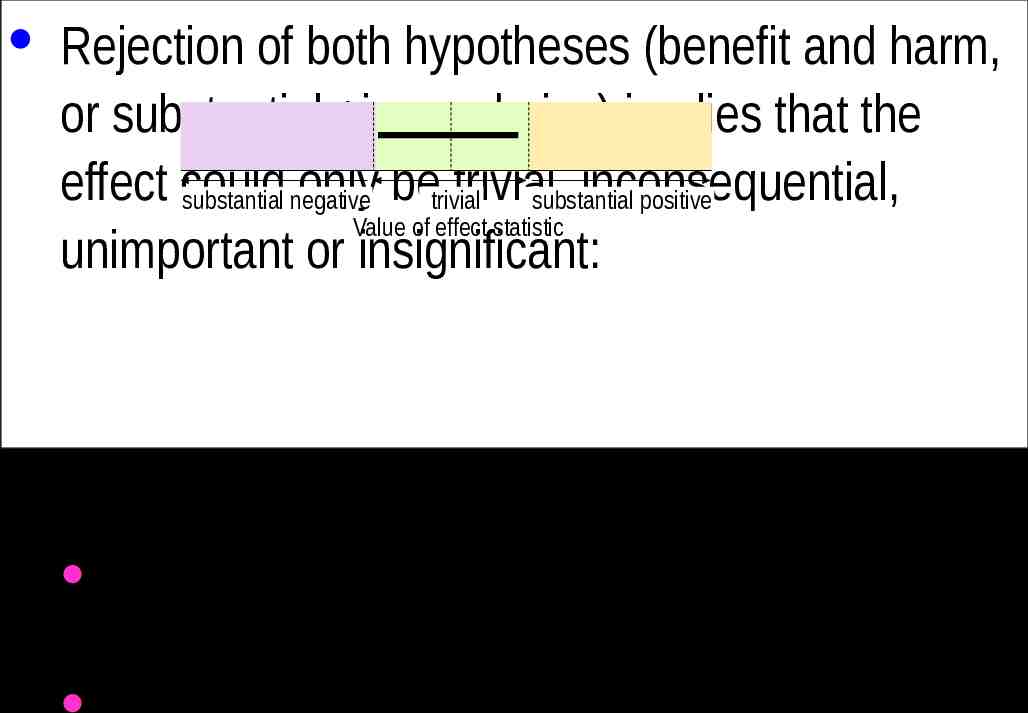
· Rejection of both hypotheses (benefit and harm, or substantial ive and –ive) implies that the effect could only betrivial trivial, inconsequential, substantial negative substantial positive Value of effect statistic unimportant or insignificant: · But with a 90%CI that just fits in the trivial region, the effect is only likely trivial. · For consistency with clearly positive meaning very
Type-1 Errors in MBD · A Type-1 error is a false positive or false discovery: a true trivial effect is deemed to be decisively non-trivial. · In NHST, a significant effect is usually assumed to be substantial, so the Type-1 error rate for a truly zero effect is set to 5% by the p value for statistical significance. · But the error rate approaches 80% for a marginally trivial true effect, depending on sample size.
More-Conservative P-value Thresholds? · The non-clinical threshold of 0.05 seems reasonable, expressed as one event in 20 trials. · But expressed as an S value, it represents only a little more than four heads in a row. · An advantage of 0.05 is approximately the same sample size as for clinical MBD. · If this threshold were revised downward, nonclinical sample size would be greater than that for clinical, which seems unreasonable. · So the probability thresholds in clinical MBD
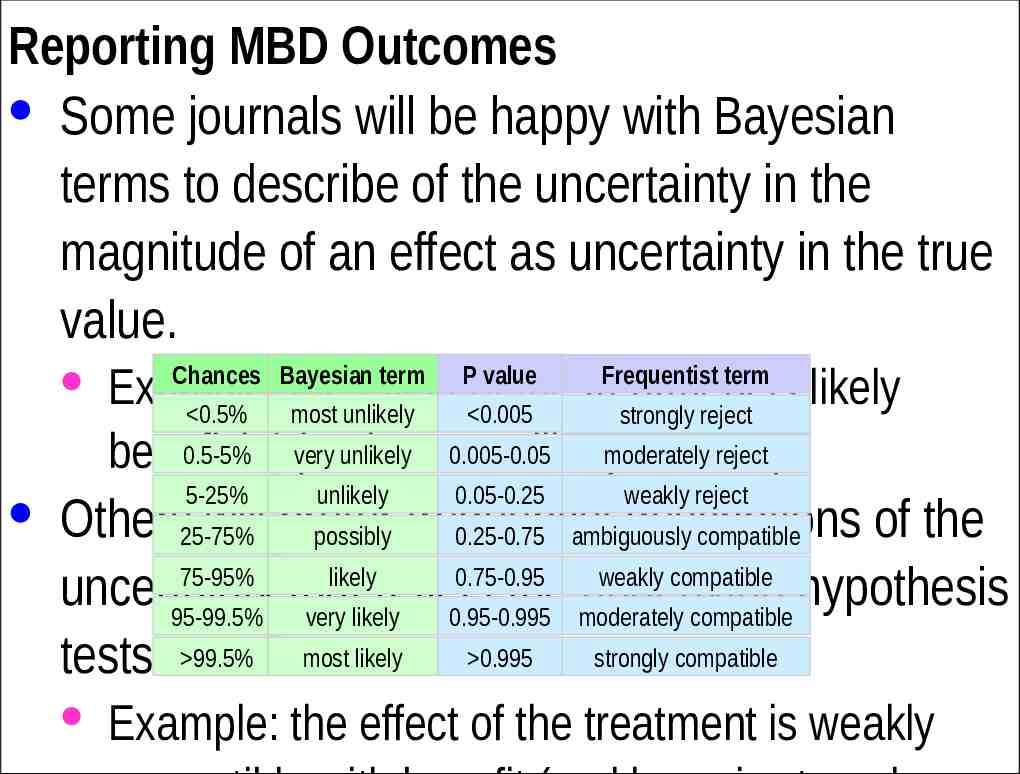
Reporting MBD Outcomes · Some journals will be happy with Bayesian terms to describe of the uncertainty in the magnitude of an effect as uncertainty in the true value. · Example: the effect of the treatment is likely 0.5% most unlikely 0.005 strongly reject 0.5-5% very unlikely 0.005-0.05 reject beneficial (and most unlikelymoderately harmful). Chances Bayesian term 5-25% unlikely P value Frequentist term 0.05-0.25 weakly reject · Others25-75% will prefer descriptions of the possibly frequentist 0.25-0.75 ambiguously compatible 75-95% likely 0.75-0.95 weakly compatible uncertainty that reflect the underlying hypothesis 95-99.5% very likely 0.95-0.995 moderately compatible tests. 99.5% most likely 0.995 strongly compatible · Example: the effect of the treatment is weakly
The following two slides introduce two relevant Sportscience spreadsheets. Converting P Values to Magnitude-Based Decisions · Statistical significance is on the way out, but the associated classic p values will be around for years to come. · The p value alone does not provide enough information about the uncertainty in the true magnitude of the effect. · To get the uncertainty expressed as compatibility limits or interval, you need also the sample value of the effect. · Put the p value and sample value into the spreadsheet Convert p values to MBD. · The upper and lower limits of the compatibility interval tell you how big or small the true effect could be, numerically. · But are those limits important? To answer that, you need to know the smallest important value of the effect. · You can then see whether the compatibility limits are important to decide how important the effect could be. · That’s OK for non-clinical effects, but if the effect represents a treatment or strategy that could be beneficial or harmful, you have to be really careful about avoiding harm. · For such clinical effects, it’s better to work out the chances of harm and benefit before you make a decision about using the effect. · Even for non-clinical effects, it’s important to know the chances that the effect is substantial (and trivial).
· And if there is too much uncertainty, you have to decide that the effect is unclear. · More data are needed to reduce the uncertainty. · The spreadsheet works out the likelihoods from the p value, the sample value of the effect, and the smallest important effect. · Deciding on the smallest important is not easy. See Lectures 4, 5 and 10. · The spreadsheet has frequentist and Bayesian versions. Converting Compatibility Intervals into Magnitude-Based Decisions · Some authors no longer provide p values, or they may provide only an unusable p-value inequality: p 0.05. · If they provide p 0.05, you can do MBD by assuming p 0.05. · But if they provide compatibility intervals or limits, you can do MBD. · Once again you need the smallest important value of the effect. · You could use the previous spreadsheet, by trying different p values to home in on the same compatibility limits. · Or a spreadsheet designed to Combine/compare effects can be used to derive the magnitude-based decision for a single effect. · A spreadsheet in this workbook also does a Bayesian analysis with an informative prior. · You have to provide prior information/belief about the effect as a mean and compatibility limits. · The spreadsheet shows that realistic weakly informative priors produce a posterior compatibility interval that is practically the same as the original, for effects with the kind of CI you get with the usual small samples in sport research. · Read the article on the Bayesian analysis link for more.