Lead Score Case Study


14 Slides364.04 KB
Lead Score Case Study
Problem Statement X Education sells online courses to industry professionals. X Education gets a lot of leads, its lead conversion rate is very poor. For example, if, say, they acquire 100 leads in a day, only about 30 of them are converted. To make this process more efficient, the company wishes to identify the most potential leads, also known as ‘Hot Leads’. If they successfully identify this set of leads, the lead conversion rate should go up as the sales team will now be focusing more on communicating with the potential leads rather than making calls to everyone. Business Objective: X education wants to know most promising leads. For that they want to build a Model which identifies the hot leads. Deployment of the model for the future use.
Solution Methodology Data cleaning and data manipulation. Check and handle duplicate data. Check and handle NA values and missing values. Drop columns, if it contains large amount of missing values and not useful for the analysis. Imputation of the values, if necessary. Check and handle outliers in data. EDA Univariate data analysis: value count, distribution of variable etc. Bivariate data analysis: correlation coefficients and pattern between the variables etc. Feature Scaling & Dummy Variables and encoding of the data. Classification technique: logistic regression used for the model making and prediction. Validation of the model. Model presentation. Conclusions and recommendations.
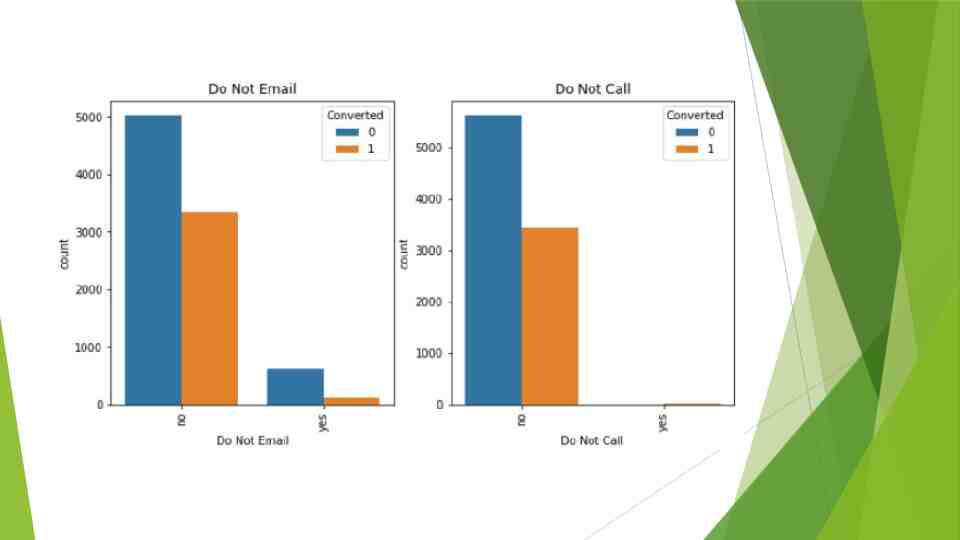
Data Manipulation Total Number of Rows 37, Total Number of Columns 9240. Single value features like “Magazine”, “Receive More Updates About Our Courses”, “Update me on Supply” Chain Content”, “Get updates on DM Content”, “I agree to pay the amount through cheque” etc. have been dropped. Removing the “Prospect ID” and “Lead Number” which is not necessary for the analysis. After checking for the value counts for some of the object type variables, we find some of the features which has no enough variance, which we have dropped, the features are: “Do Not Call”, “What matters most to you in choosing course”, “Search”, “Newspaper Article”, “X Education Forums”, “Newspaper”, “Digital Advertisement” etc. Dropping the columns having more than 35% as missing value such as ‘How did you hear about X Education’ and ‘Lead Profile’
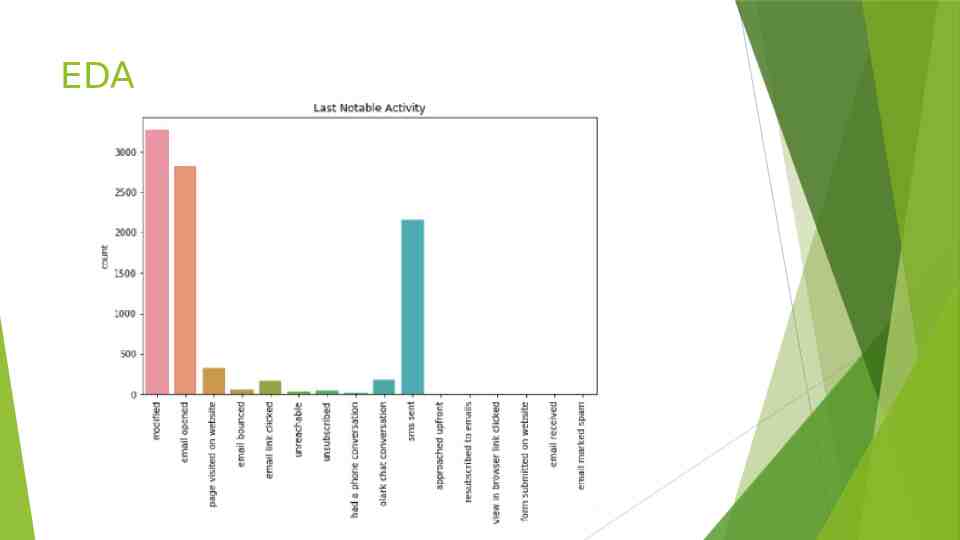
EDA
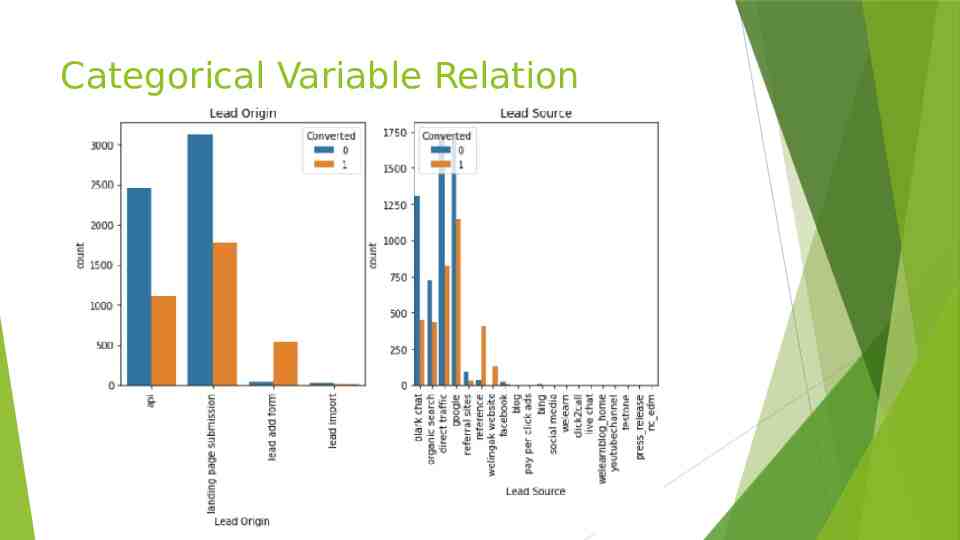
Categorical Variable Relation
Data Conversion Numerical Variables are Normalised. Dummy Variables are created for object type variables. Total Rows for Analysis: 8792 Total Columns for Analysis: 43
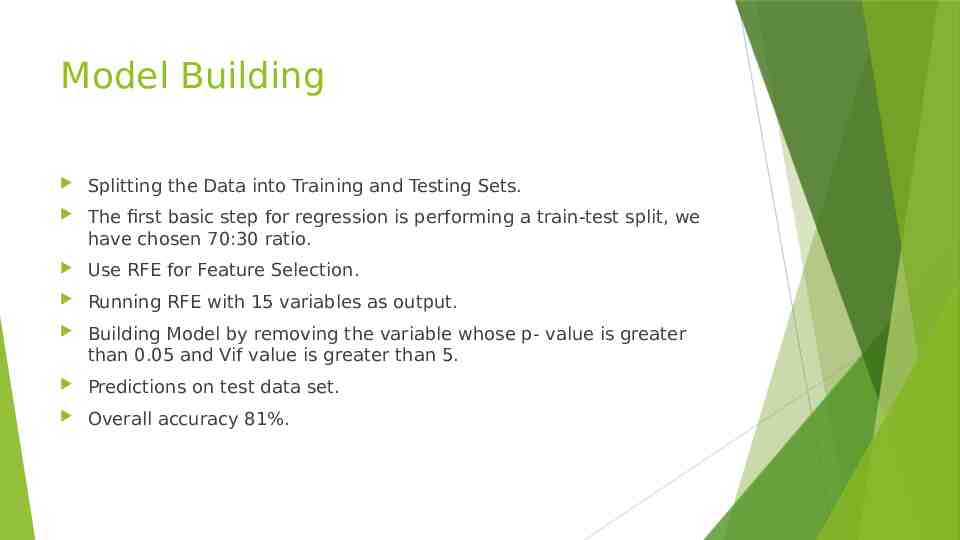
Model Building Splitting the Data into Training and Testing Sets. The first basic step for regression is performing a train-test split, we have chosen 70:30 ratio. Use RFE for Feature Selection. Running RFE with 15 variables as output. Building Model by removing the variable whose p- value is greater than 0.05 and Vif value is greater than 5. Predictions on test data set. Overall accuracy 81%.
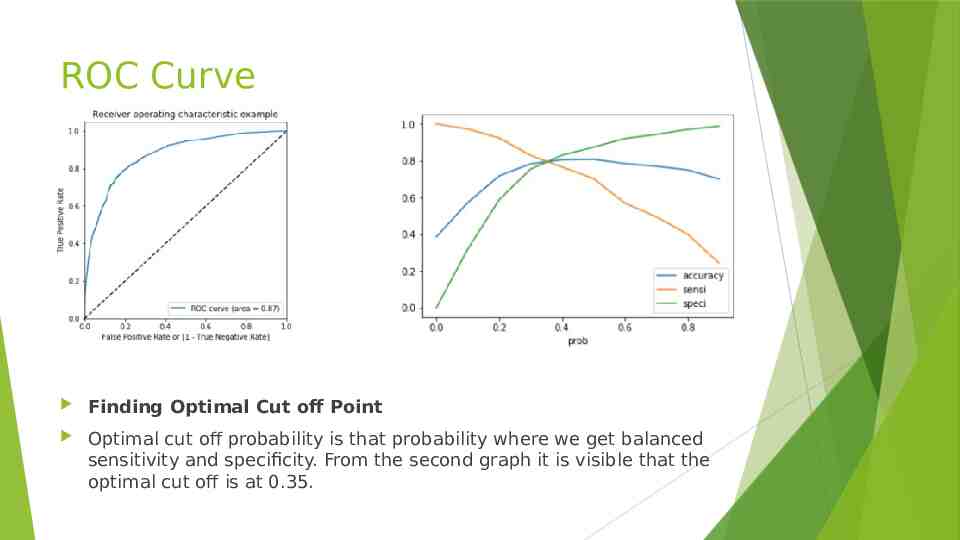
ROC Curve Finding Optimal Cut off Point Optimal cut off probability is that probability where we get balanced sensitivity and specificity. From the second graph it is visible that the optimal cut off is at 0.35.
Conclusion It was found that the variables that mattered the most in the potential buyers are (In descending order) : The total time spend on the Website. Total number of visits. When the lead source was: Google Direct traffic Organic search Welingak website When the last activity was: SMS Olark chat conversation When the lead origin is Lead add format. When their current occupation is as a working professional. Keeping these in mind the X Education can flourish as they have a very high chance to get almost all the potential buyers to change their mind and buy their courses
Thank You