PORTFOLIO MANAGEMENT AND EVALUATING INVESTMENTS

43 Slides136.34 KB
PORTFOLIO MANAGEMENT AND EVALUATING INVESTMENTS
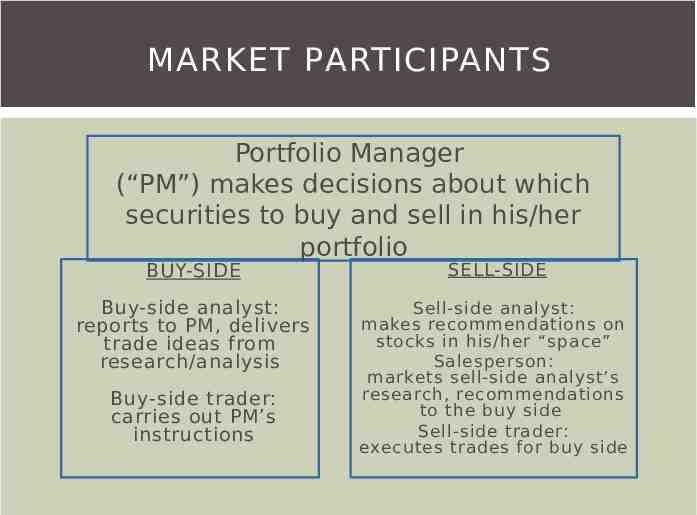
MARKET PARTICIPANTS Portfolio Manager (“PM”) makes decisions about which securities to buy and sell in his/her portfolio BUY-SIDE SELL-SIDE Buy-side analyst: reports to PM, delivers trade ideas from research/analysis Sell-side analyst: makes recommendations on stocks in his/her “space” Salesperson: markets sell-side analyst’s research, recommendations to the buy side Sell-side trader: executes trades for buy side Buy-side trader: carries out PM’s instructions
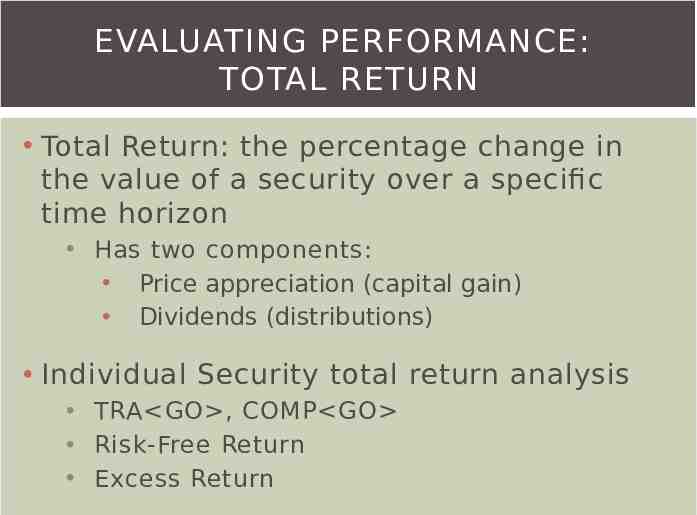
EVALUATING PERFORMANCE: TOTAL RETURN Total Return: the percentage change in the value of a security over a specific time horizon Has two components: Price appreciation (capital gain) Dividends (distributions) Individual Security total return analysis TRA GO , COMP GO Risk-Free Return Excess Return
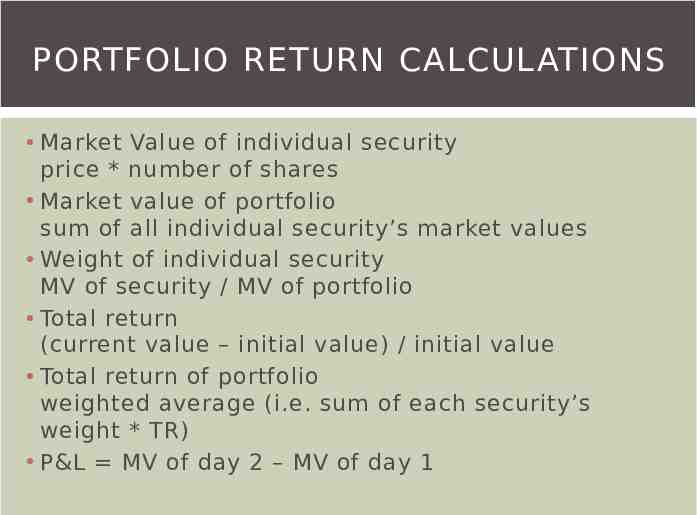
PORTFOLIO RETURN CALCULATIONS Market Value of individual security price * number of shares Market value of portfolio sum of all individual security’s market values Weight of individual security MV of security / MV of portfolio Total return (current value – initial value) / initial value Total return of portfolio weighted average (i.e. sum of each security’s weight * TR) P&L MV of day 2 – MV of day 1
RELATIVE RETURNS A PM uses a benchmark to determine if the return on their portfolio over a specific time period was relatively good or bad Active strategy: Attempt to beat the benchmark in risk-adjusted return Alpha/Active Return Passive strategy: Attempt to replicate the risk/return of the benchmark Tracking Error
RISK MEASURES Beta: correlation of the returns of a stock with the returns of the overall market; BETA GO , HRA GO The percent change in price of a stock given a 1% change in the price of the overall market Beta 1 Beta 1 Beta 1 Portfolio Beta: weighted average
REVIEW OF PORTFOLIO THEORY What is a portfolio? Who are the market players? Why is diversification important? What are the two approaches of asset allocation? What are the two components of an individual security’s total return? If I am a passive portfolio manager what is my goal? Would I track alpha or tracking error?
CREATING A PORTFOLIO PRTU: You can manually enter in your positions and costs on PRTU. Excel Drag & Drop into PRTU BBU GO upload
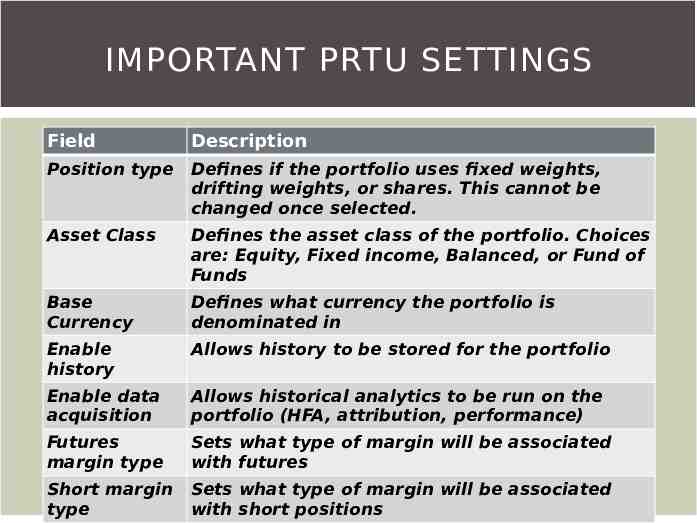
IMPORTANT PRTU SETTINGS Field Description Position type Defines if the portfolio uses fixed weights, drifting weights, or shares. This cannot be changed once selected. Asset Class Defines the asset class of the portfolio. Choices are: Equity, Fixed income, Balanced, or Fund of Funds Base Currency Defines what currency the portfolio is denominated in Enable history Allows history to be stored for the portfolio Enable data acquisition Allows historical analytics to be run on the portfolio (HFA, attribution, performance) Futures margin type Sets what type of margin will be associated with futures Short margin type Sets what type of margin will be associated with short positions
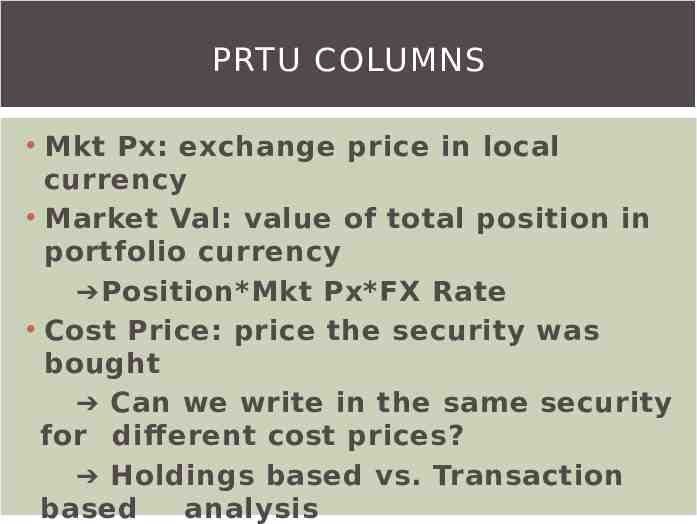
PRTU COLUMNS Mkt Px: exchange price in local currency Market Val: value of total position in portfolio currency Position*Mkt Px*FX Rate Cost Price: price the security was bought Can we write in the same security for different cost prices? Holdings based vs. Transaction based analysis
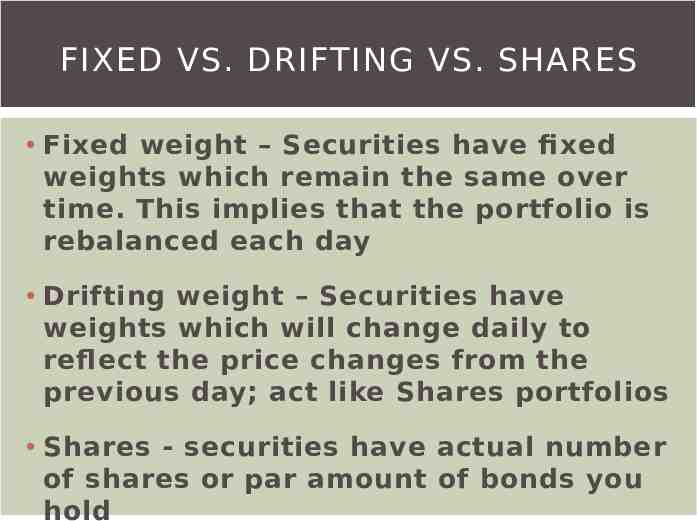
FIXED VS. DRIFTING VS. SHARES Fixed weight – Securities have fixed weights which remain the same over time. This implies that the portfolio is rebalanced each day Drifting weight – Securities have weights which will change daily to reflect the price changes from the previous day; act like Shares portfolios Shares - securities have actual number of shares or par amount of bonds you hold
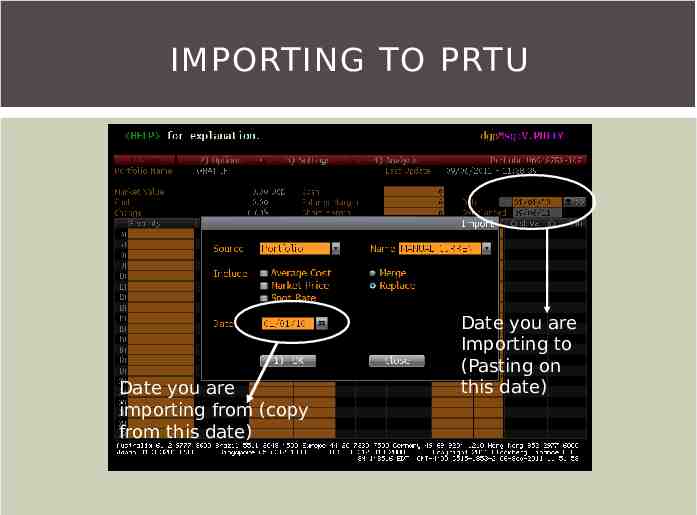
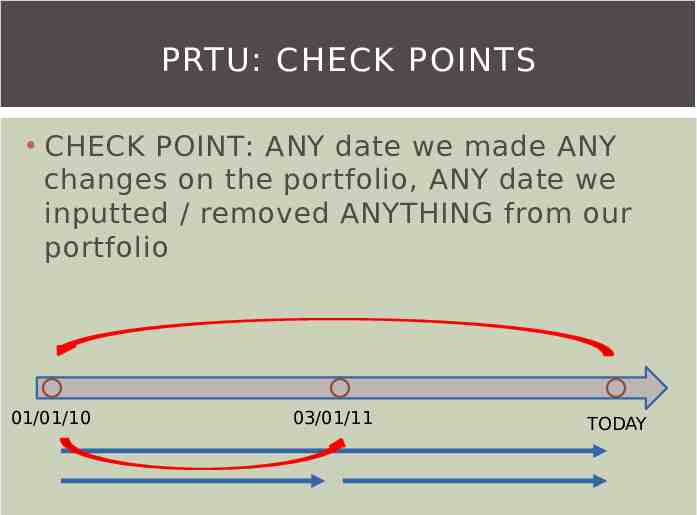
IMPORTING TO PRTU Date you are importing from (copy from this date) Date you are Importing to (Pasting on this date)
PRTU: CHECK POINTS CHECK POINT: ANY date we made ANY changes on the portfolio, ANY date we inputted / removed ANYTHING from our portfolio 01/01/10 03/01/11 TODAY
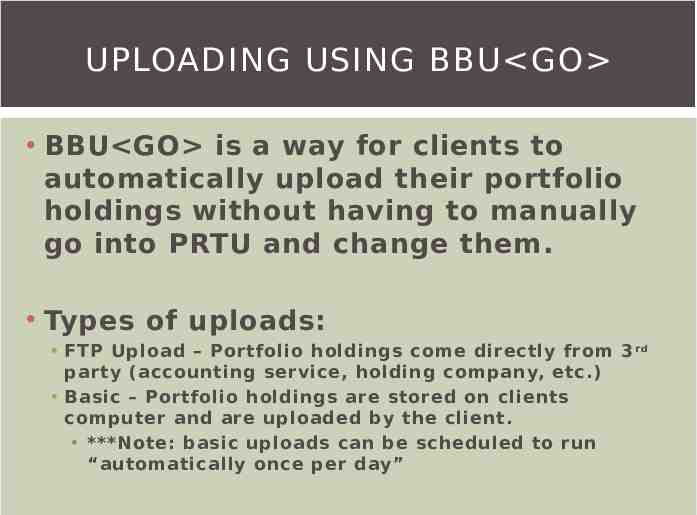
UPLOADING USING BBU GO BBU GO is a way for clients to automatically upload their portfolio holdings without having to manually go into PRTU and change them. Types of uploads: FTP Upload – Portfolio holdings come directly from 3 rd party (accounting service, holding company, etc.) Basic – Portfolio holdings are stored on clients computer and are uploaded by the client. ***Note: basic uploads can be scheduled to run “automatically once per day”
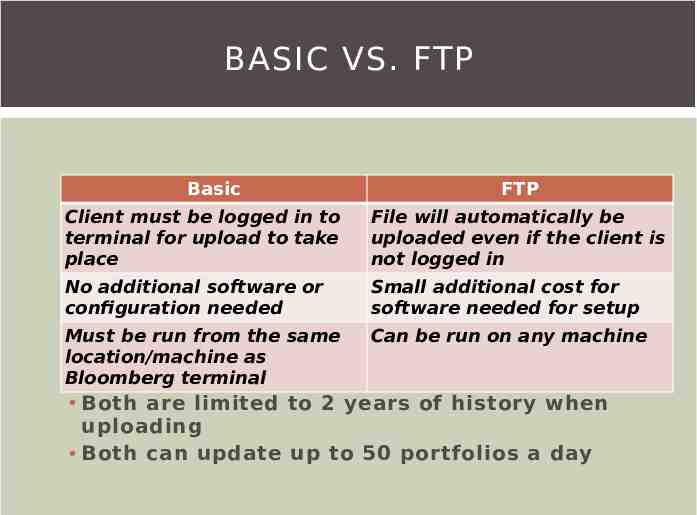
BASIC VS. FTP Basic FTP Client must be logged in to terminal for upload to take place File will automatically be uploaded even if the client is not logged in No additional software or configuration needed Small additional cost for software needed for setup Must be run from the same location/machine as Bloomberg terminal Can be run on any machine Both are limited to 2 years of history when uploading Both can update up to 50 portfolios a day
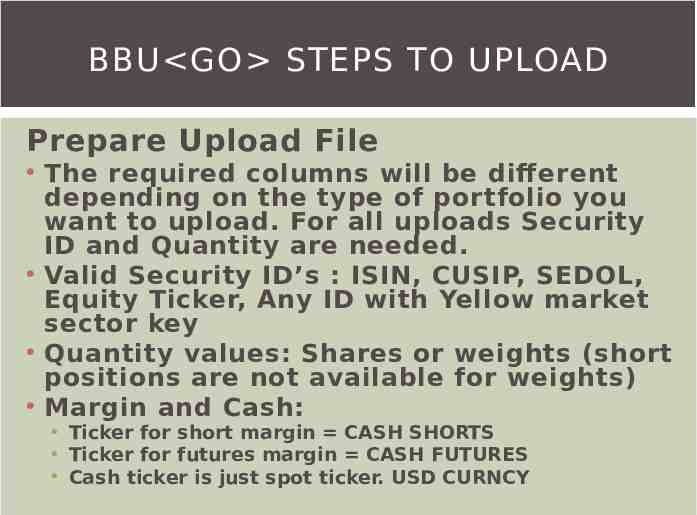
BBU GO STEPS TO UPLOAD Prepare Upload File The required columns will be different depending on the type of portfolio you want to upload. For all uploads Security ID and Quantity are needed. Valid Security ID’s : ISIN, CUSIP, SEDOL, Equity Ticker, Any ID with Yellow market sector key Quantity values: Shares or weights (short positions are not available for weights) Margin and Cash: Ticker for short margin CASH SHORTS Ticker for futures margin CASH FUTURES Cash ticker is just spot ticker. USD CURNCY
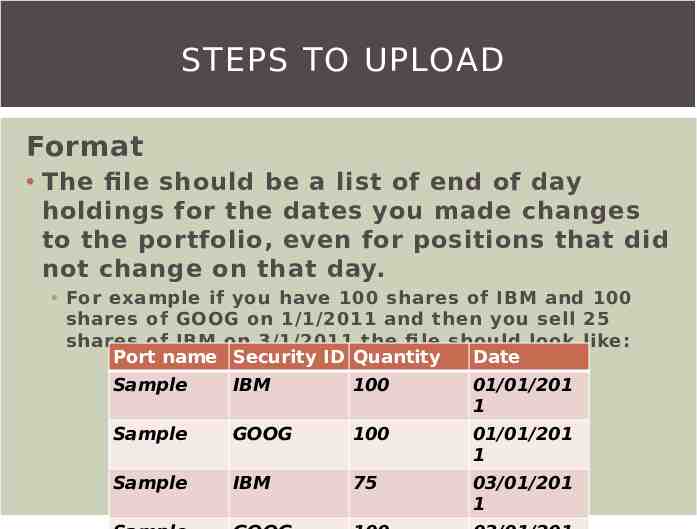
STEPS TO UPLOAD Format The file should be a list of end of day holdings for the dates you made changes to the portfolio, even for positions that did not change on that day. For example if you have 100 shares of IBM and 100 shares of GOOG on 1/1/2011 and then you sell 25 shares of IBM on 3/1/2011 the fi le should look like: Port name Security ID Quantity Date Sample IBM 100 01/01/201 1 Sample GOOG 100 01/01/201 1 Sample IBM 75 03/01/201 1
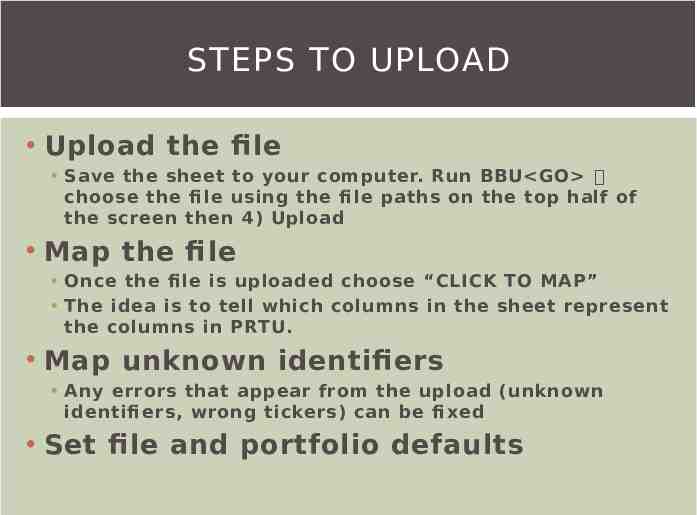
STEPS TO UPLOAD Upload the file Save the sheet to your computer. Run BBU GO choose the fi le using the fi le paths on the top half of the screen then 4) Upload Map the file Once the fi le is uploaded choose “CLICK TO MAP” The idea is to tell which columns in the sheet represent the columns in PRTU. Map unknown identifiers Any errors that appear from the upload (unknown identifi ers, wrong tickers) can be fi xed Set file and portfolio defaults
REVIEW OF CREATING PORTFOLIOS What are the two tools we can use to create a portfolio? How do they differ? If I want to upload two portfolios with history, how many columns do I need in my excel sheet? If I create a portfolio today and want to see my total return for the last year, how do I go about doing this?
CLASSIFICATIONS Classification: a way to place a security in a particular group according to their characteristics Examples: GICS sectors, market cap, analyst PCLS GO You can also upload custom classification using BBU GO uploads
MARGIN TYPES Cash Margin – a dollar amount . They type is mainly used when clients get their daily holdings from their back offi ce and they simply upload this to our system. Percentage – Allows users to assume that they are posting x% of the total market value of the short positions without having to calc the dollar amount.
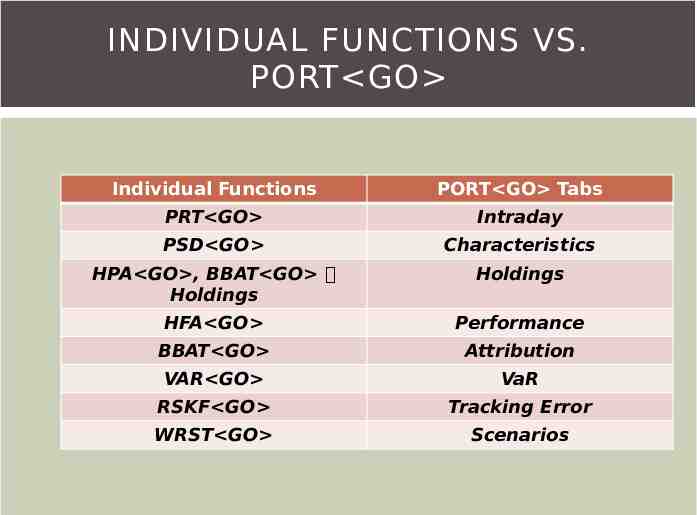
INDIVIDUAL FUNCTIONS VS. PORT GO Individual Functions PORT GO Tabs PRT GO Intraday PSD GO Characteristics HPA GO , BBAT GO Holdings Holdings HFA GO Performance BBAT GO Attribution VAR GO VaR RSKF GO Tracking Error WRST GO Scenarios
ANALYZING RETURNS- ATTRIBUTION Attribution: BBAT GO or Attribution tab Definition: Analysis of the impact of a portfolio manager’s decisions Looks at both Allocation and Selection effects of active return Helps to determine whether investing with a specific fund has been money well spent
ANALYZING RISK - VAR Value at Risk Technique used to analyze potential portfolio losses. Portfolio is subjected to a series of scenarios in order to simulate returns over a given period. Two primary methodologies in calculating VaR: Monte Carlo Historical
PRTU REVIEW Shares/Par amount, Fixed or Drifting weight Review of the columns on PRTU Being able to back date to generate history Importing option on PRTU and “checkpoints”
PORTFOLIO MAINTENANCE PRTU GO does NOT automatically adjust for corporate actions Two ways to fix this Go to PRTU GO and manually adjust for your corporate actions Use PMNT GO to adjust for your corporate actions Sharing portfolios: PDIS GO
FIXED INCOME PORTFOLIOS Fixed Income View on PORT GO Released to all clients with no additional cost Currently we do not support balanced portfolios, equity and fixed income on separate views COMING SOON!
CREATING AND SETTING UP FIXED INCOME PORTFOLIO PRTU Settings: need to ensure that the asset class of the portfolio is set to Fixed Income Entry of position Divide by 1000 on PRTU Option on BBU divide by 1000 Entry of a unique ID: ex. VOD 4.625 Corp, VOD 7 7/8 2030 Corp Position types supported for Fixed Income No shorts Only Cash/Par amount (no weighted portfolios)
WHAT DO FIXED INCOME PORTFOLIO MANAGERS LOOK AT? Assess total return of portfolio Absolute Relative to benchmark Assess risk of portfolio Interest rate risk Sensitivity to curve changes Sensitivity to tenor changes Credit risk Sensitivity to credit spread changes
LETS START WITH ONE BOND YAS GO What is Duration (Macauley’s)? What is modified duration? What is DV01? Is yield to maturity accurate? Is it realistic? Credit spread What is Spread to benchmark? What is G spread, I spread? Why do we have OAS (conceptually)? This is standard when looking at portfolios (most logical)
CHARACTERISTICS TAB Basics of the overall portfolio Yield, Average life, Coupon (ALM) Want to see this compared to the benchmark? How do I want to defi ne relative characteristics? Credit (overall) OAS Composite credit rating Interest rate sensitivity measures (overall) DV01 Modified Duration This is a current snapshot, Use “As of” date on top right to see historical
HISTORICAL PERFORMANCE How has my portfolio done? What is the total return? How much have I outperformed / tracked the benchmark? Total return for a FI portfolio: Where does it come from? How to break it down? Can I see components of total return?
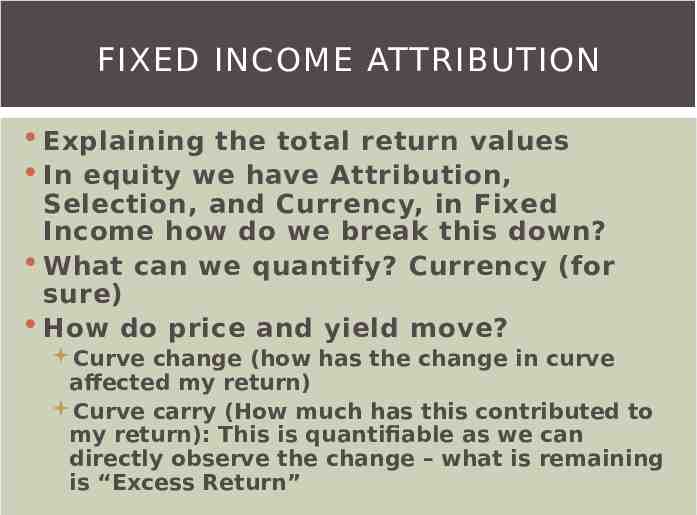
FIXED INCOME ATTRIBUTION Explaining the total return values In equity we have Attribution, Selection, and Currency, in Fixed Income how do we break this down? What can we quantify? Currency (for sure) How do price and yield move? Curve change (how has the change in curve affected my return) Curve carry (How much has this contributed to my return): This is quantifiable as we can directly observe the change – what is remaining is “Excess Return”
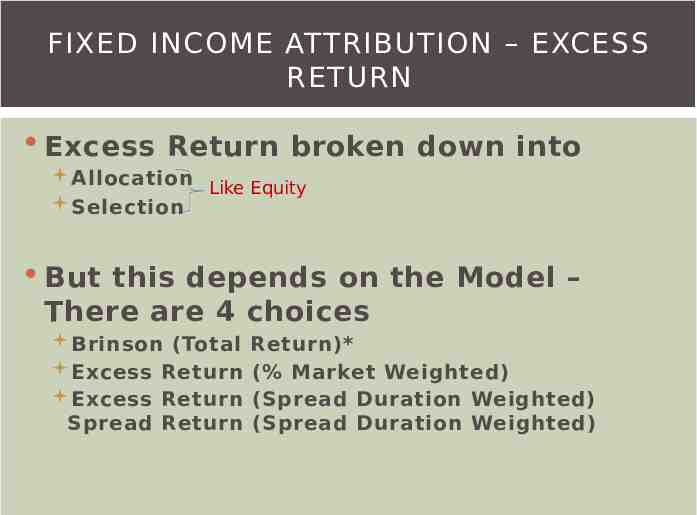
FIXED INCOME ATTRIBUTION – EXCESS RETURN Excess Return broken down into Allocation Like Equity Selection But this depends on the Model – There are 4 choices Brinson (Total Excess Return Excess Return Spread Return Return)* (% Market Weighted) (Spread Duration Weighted) (Spread Duration Weighted)
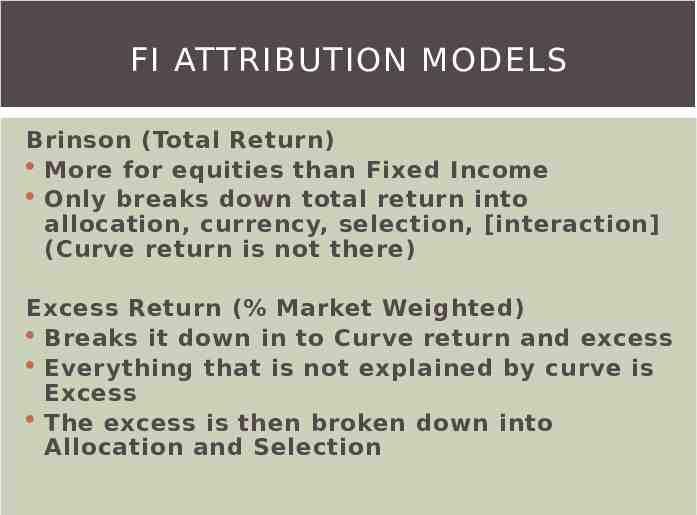
FI ATTRIBUTION MODELS Brinson (Total Return) More for equities than Fixed Income Only breaks down total return into allocation, currency, selection, [interaction] (Curve return is not there) Excess Return (% Market Weighted) Breaks it down in to Curve return and excess Everything that is not explained by curve is Excess The excess is then broken down into Allocation and Selection
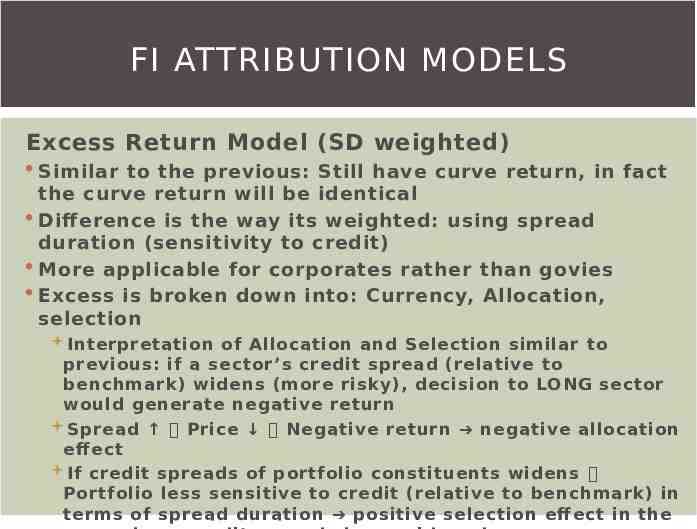
FI ATTRIBUTION MODELS Excess Return Model (SD weighted) Similar to the previous: Still have curve return, in fact the curve return will be identical Difference is the way its weighted: using spread duration (sensitivity to credit) More applicable for corporates rather than govies Excess is broken down into: Currency, Allocation, selection Interpretation of Allocation and Selection similar to previous: if a sector’s credit spread (relative to benchmark) widens (more risky), decision to LONG sector would generate negative return Spread Price Negative return negative allocation eff ect If credit spreads of portfolio constituents widens Portfolio less sensitive to credit (relative to benchmark) in terms of spread duration positive selection eff ect in the
FI ATTRIBUTION MODELS Spread Return (Spread duration weighted) Again – curve Return is the same Weighting are the same as previous Only difference is that Attribution and Selection effects now broken down further Allocation (spread) carry, Allocation (spread) change Selection (spread) carry, Selection (spread) Change Don’t worry about this, specifics not in exam, BUT if curious: IDOC 2065864 GO
KEY RATES ON PORT Assessing sensitivity: See which sector/group/breakdown has the highest sensitivity so you know what to address fi rst Identify where your interest risk is highly concentrated Identify versus benchmark where your interest risk lies Passive PM does not want diff erences between benchmark (immunization) Active PM will want to outperform the benchmark (therefore want negative) Key rates – partial sensitivity Relative to benchmark – Long or Short duration? What is my expectation? Why have I taken this bet? How to configure which curve? What is Key rate and what is DV01? How to show DV01?
KEY RATES ON KRR GO Similar to PORT Shift in interest rates is 1BP UPWARD shift Cannot do it relative to a benchmark Shows dollar/monetary sensitivity (can see this on PORT as well, cannot change on KRR) Algorithmics (supports Swaps as well which PORT does not)
TRACKING ERROR Similar to equity, factors are different Spread Yield Curve Currency Decompose risk to these factors Non-factor: cannot be explained
VAR ON PORT Same as equities in methodology Only factors used in the model are different Currency Yield curve Spread NOTE: If portfolio has swaps and other non-cash instruments, use VAR GO instead
SCENARIOS ON BSA GO Look at scenarios and how that will affect your position Assessing how your return changes pending the different scenarios You expect Market value to go UP when interest rates go DOWN (vice versa) Can it be that Market value go UP when interest rate go UP? WHY? HINT: Think of what is contributing to my returns Creating Custom Scenarios Can change the nature of the shock Instantaneous At horizon date Security list supported on BSA GO help pages
SCENARIOS (PORT) Can do custom shifts like BSA, but also have preset scenarios (Scenario detail tab) Can stress other factors too (FX rates, Macro etc) Same reasons/rationale as BSA essentially