I. Trends in Number of High School Graduates


85 Slides4.56 MB
I. Trends in Number of High School Graduates
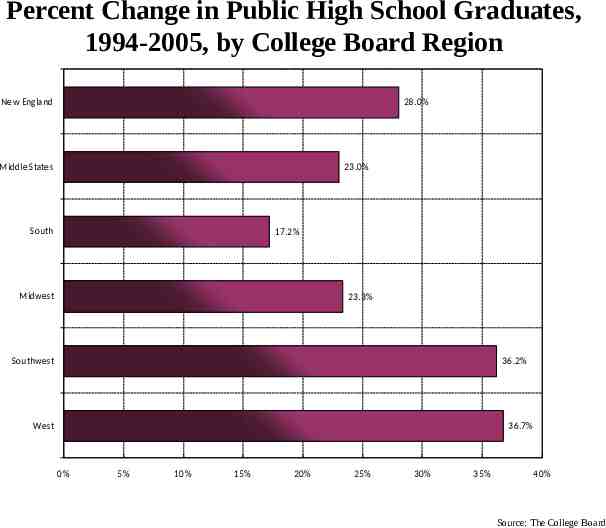
Percent Change in Public High School Graduates, 1994-2005, by College Board Region New England 28.0% Middle States 23.0% South 17.2% Midwest 23.3% Southwest 36.2% West 36.7% 0% 5% 10% 15% 20% 25% 30% 35% 40% Source: The College Board
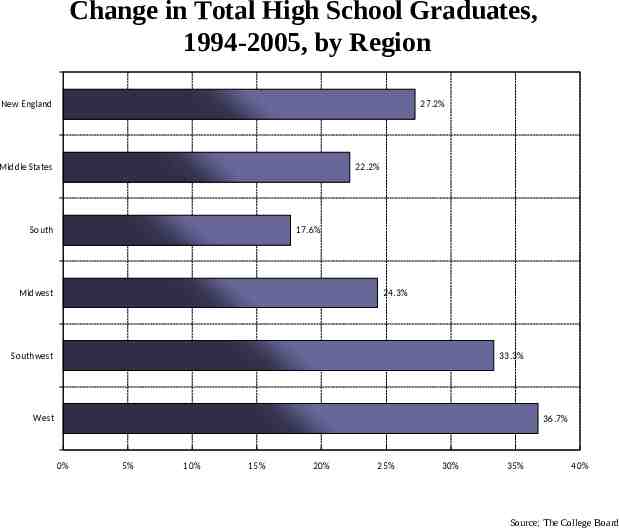
Change in Total High School Graduates, 1994-2005, by Region New England 27.2% Middle States 22.2% South 17.6% Midwest 24.3% Southwest 33.3% West 36.7% 0% 5% 10% 15% 20% 25% 30% 35% 40% Source: The College Board
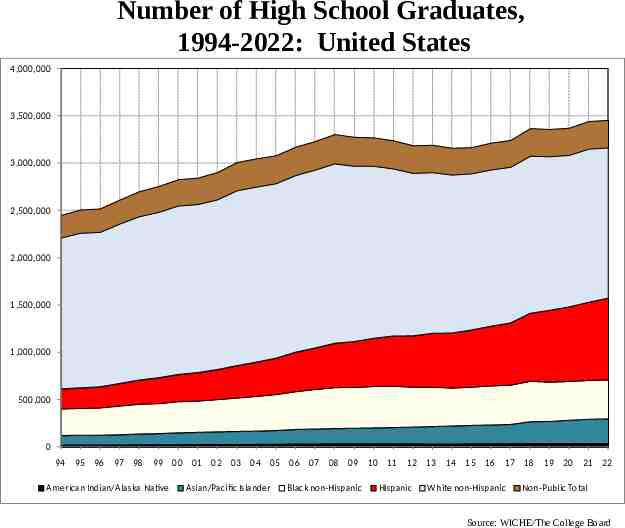
Number of High School Graduates, 1994-2022: United States 4,000,000 3,500,000 3,000,000 2,500,000 2,000,000 1,500,000 1,000,000 500,000 0 94 95 96 97 98 99 00 01 02 03 04 05 06 07 08 09 10 11 12 13 14 15 16 17 18 19 20 21 22 American Indian/Alaska Native Asian/Pacific Islander Black non-Hispanic Hispanic White non-Hispanic Non-Public Total Source: WICHE/The College Board
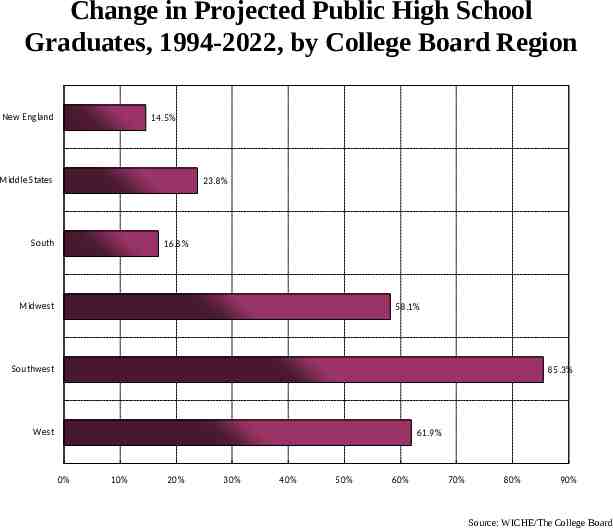
Change in Projected Public High School Graduates, 1994-2022, by College Board Region New England 14.5% Middle States 23.8% South 16.8% Midwest 58.1% Southwest 85.3% West 61.9% 0% 10% 20% 30% 40% 50% 60% 70% 80% 90% Source: WICHE/The College Board
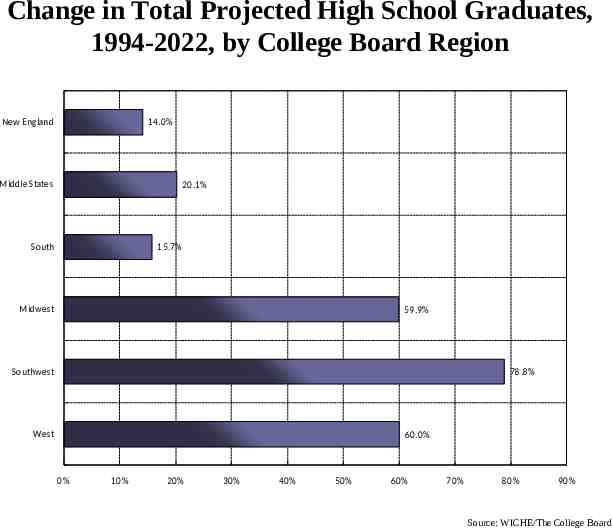
Change in Total Projected High School Graduates, 1994-2022, by College Board Region New England 14.0% Middle States 20.1% South 15.7% Midwest 59.9% Southwest 78.8% West 60.0% 0% 10% 20% 30% 40% 50% 60% 70% 80% 90% Source: WICHE/The College Board
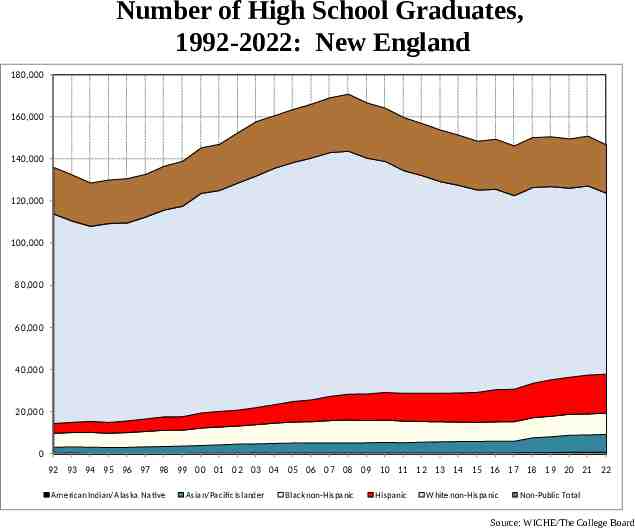
Number of High School Graduates, 1992-2022: New England 180,000 160,000 140,000 120,000 100,000 80,000 60,000 40,000 20,000 0 92 93 94 95 96 97 98 99 00 01 02 03 04 05 06 07 08 09 10 11 12 13 14 15 16 17 18 19 20 21 22 American Indian/Alaska Native Asian/Pacific Islander Black non-Hispanic Hispanic White non-Hispanic Non-Public Total Source: WICHE/The College Board
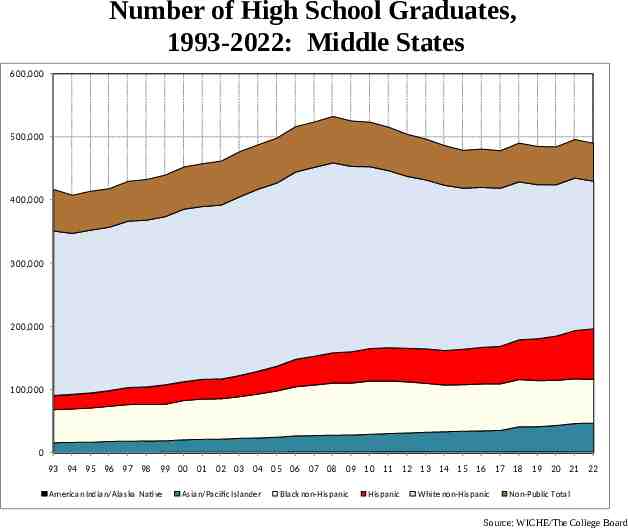
Number of High School Graduates, 1993-2022: Middle States 600,000 500,000 400,000 300,000 200,000 100,000 0 93 94 95 96 97 98 99 00 01 02 03 04 05 06 07 08 09 10 11 12 13 14 15 16 17 18 19 20 21 22 American Indian/Alaska Native Asian/Pacific Islander Black non-Hispanic Hispanic White non-Hispanic Non-Public Total Source: WICHE/The College Board
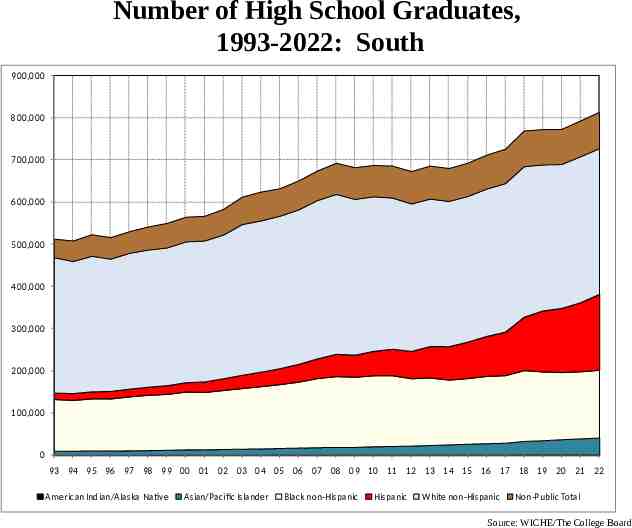
Number of High School Graduates, 1993-2022: South 900,000 800,000 700,000 600,000 500,000 400,000 300,000 200,000 100,000 0 93 94 95 96 97 98 99 00 01 02 03 04 05 06 07 08 09 10 11 12 13 14 15 16 17 18 19 20 21 22 American Indian/Alaska Native Asian/Pacific Islander Black non-Hispanic Hispanic White non-Hispanic Non-Public Total Source: WICHE/The College Board
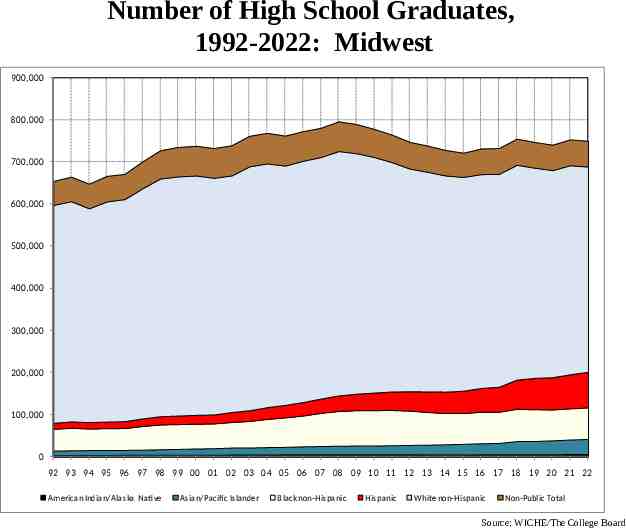
Number of High School Graduates, 1992-2022: Midwest 900,000 800,000 700,000 600,000 500,000 400,000 300,000 200,000 100,000 0 92 93 94 95 96 97 98 99 00 01 02 03 04 05 06 07 08 09 10 11 12 13 14 15 16 17 18 19 20 21 22 American Indian/Alaska Native Asian/Pacific Islander Black non-Hispanic Hispanic White non-Hispanic Non-Public Total Source: WICHE/The College Board
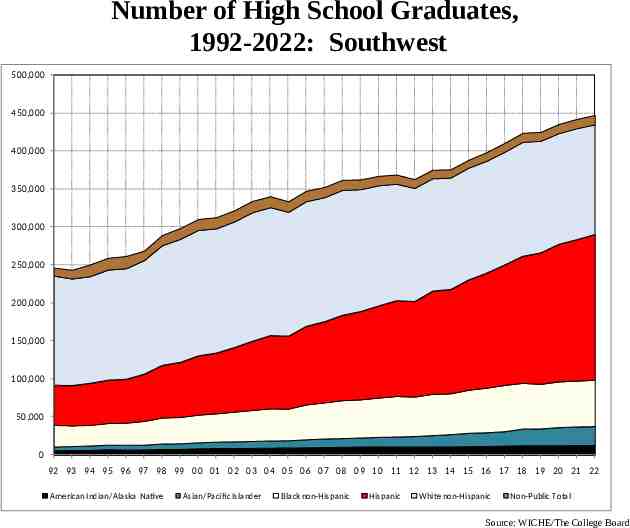
Number of High School Graduates, 1992-2022: Southwest 500,000 450,000 400,000 350,000 300,000 250,000 200,000 150,000 100,000 50,000 0 92 93 94 95 96 97 98 99 00 01 02 03 04 05 06 07 08 09 10 11 12 13 14 15 16 17 18 19 20 21 22 American Indian/Alaska Native Asian/Pacific Islander Black non-Hispanic Hispanic White non-Hispanic Non-Public Total Source: WICHE/The College Board
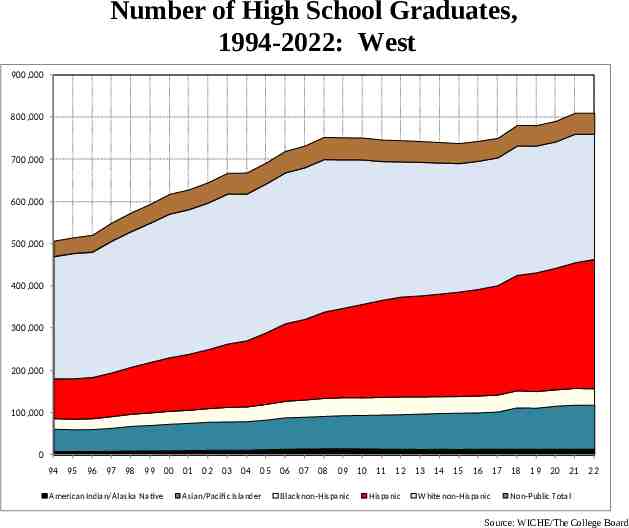
Number of High School Graduates, 1994-2022: West 900,000 800,000 700,000 600,000 500,000 400,000 300,000 200,000 100,000 0 94 95 96 97 98 99 00 01 02 03 04 05 06 07 08 09 10 11 12 13 14 15 16 17 18 19 20 21 22 American Indian/Alaska Native Asian/Pacific Islander Black non-Hispanic Hispanic White non-Hispanic Non-Public Total Source: WICHE/The College Board
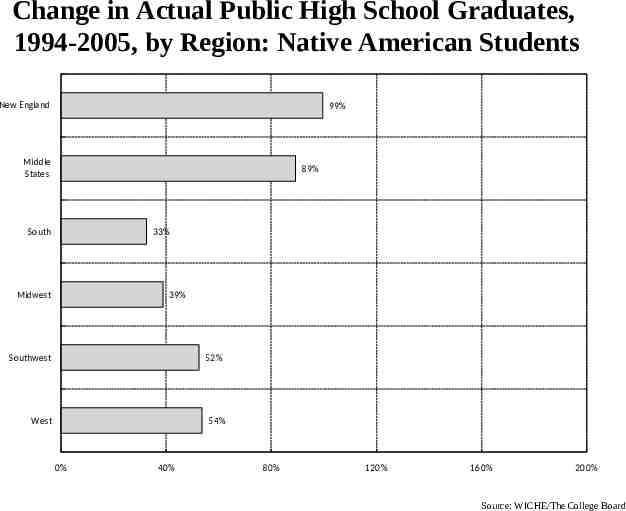
Change in Actual Public High School Graduates, 1994-2005, by Region: Native American Students New England 99% Middle States 89% South 33% Midwest 39% Southwest 52% West 54% 0% 40% 80% 120% 160% 200% Source: WICHE/The College Board
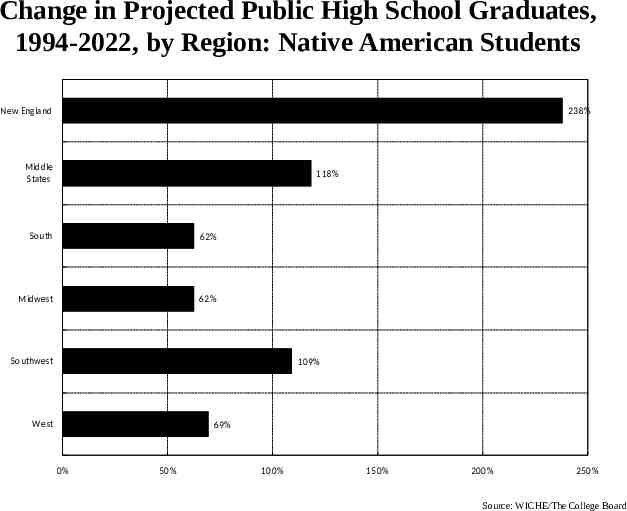
Change in Projected Public High School Graduates, 1994-2022, by Region: Native American Students New England 238% Middle States 118% South 62% Midwest 62% Southwest 109% West 69% 0% 50% 100% 150% 200% 250% Source: WICHE/The College Board
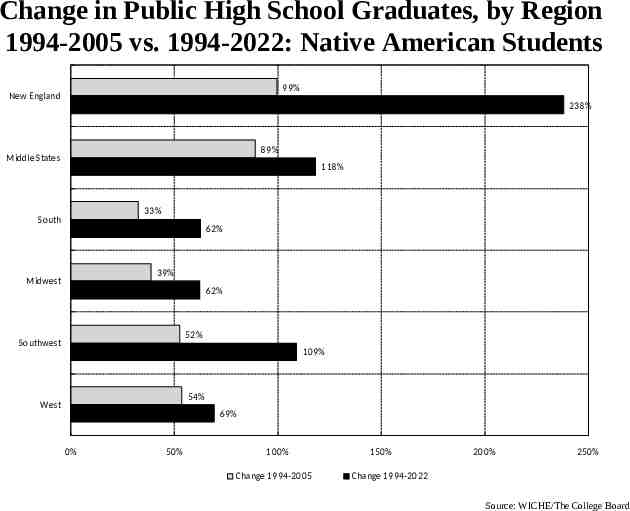
Change in Public High School Graduates, by Region 1994-2005 vs. 1994-2022: Native American Students 99% New England 238% 89% Middle States 118% 33% South 62% 39% Midwest 62% 52% Southwest 109% 54% West 69% 0% 50% 100% Change 1994-2005 150% 200% 250% Change 1994-2022 Source: WICHE/The College Board
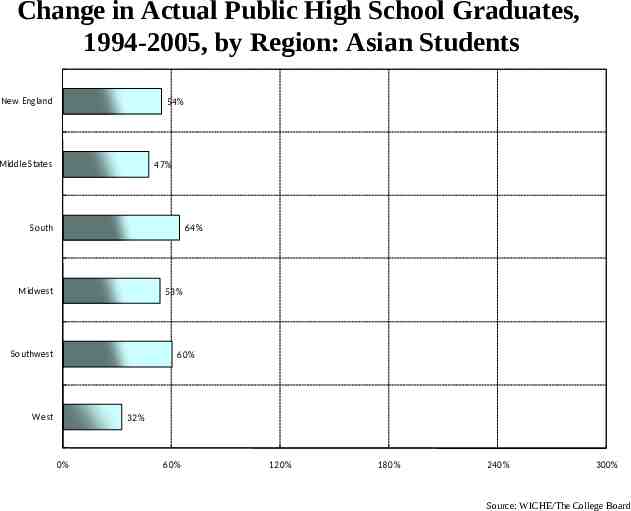
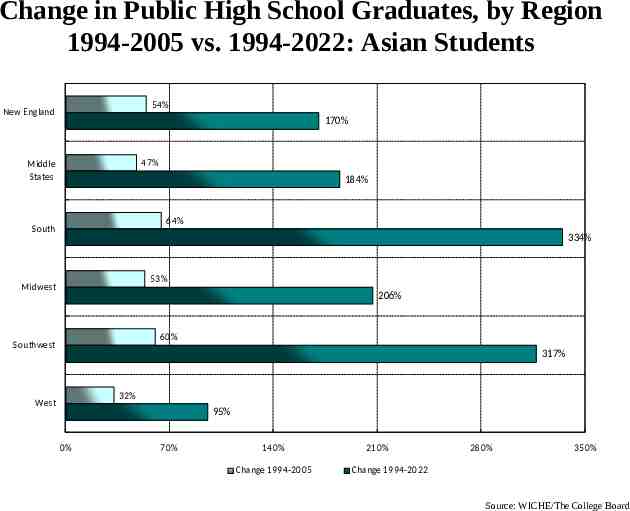
Change in Actual Public High School Graduates, 1994-2005, by Region: Asian Students New England 54% Middle States 47% South 64% Midwest 53% Southwest 60% West 32% 0% 60% 120% 180% 240% 300% Source: WICHE/The College Board
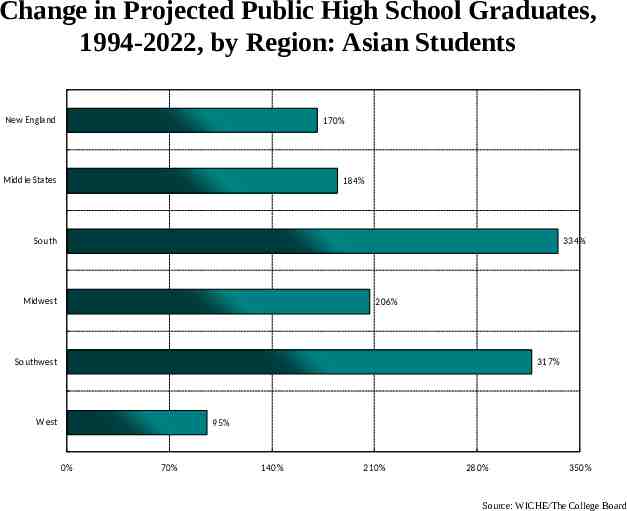
Change in Projected Public High School Graduates, 1994-2022, by Region: Asian Students New England 170% Middle States 184% South 334% Midwest 206% Southwest 317% West 95% 0% 70% 140% 210% 280% 350% Source: WICHE/The College Board
Change in Public High School Graduates, by Region 1994-2005 vs. 1994-2022: Asian Students 54% New England 170% 47% Middle States 184% 64% South 334% 53% Midwest 206% 60% Southwest 317% 32% West 95% 0% 70% 140% Change 1994-2005 210% 280% 350% Change 1994-2022 Source: WICHE/The College Board
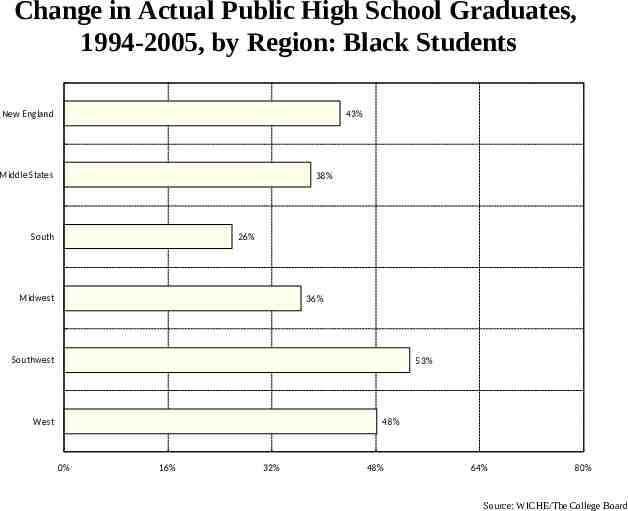
Change in Actual Public High School Graduates, 1994-2005, by Region: Black Students New England 43% Middle States 38% South 26% Midwest 36% Southwest 53% West 48% 0% 16% 32% 48% 64% 80% Source: WICHE/The College Board
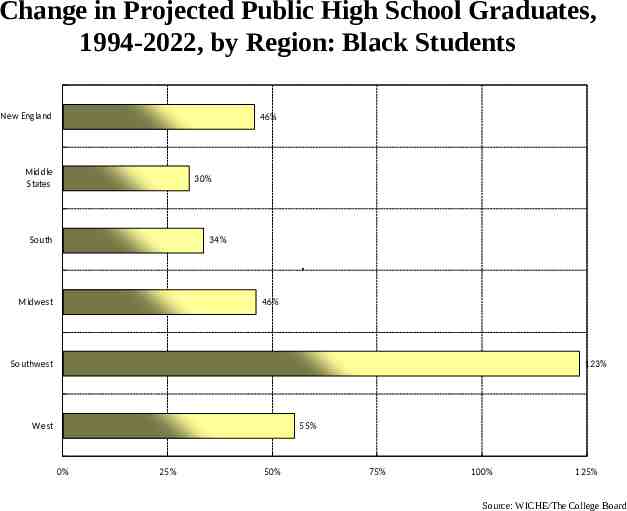
Change in Projected Public High School Graduates, 1994-2022, by Region: Black Students New England 46% Middle States 30% South 34% W M NS Midwest 46% Southwest 123% West 55% 0% 25% 50% 75% 100% 125% Source: WICHE/The College Board
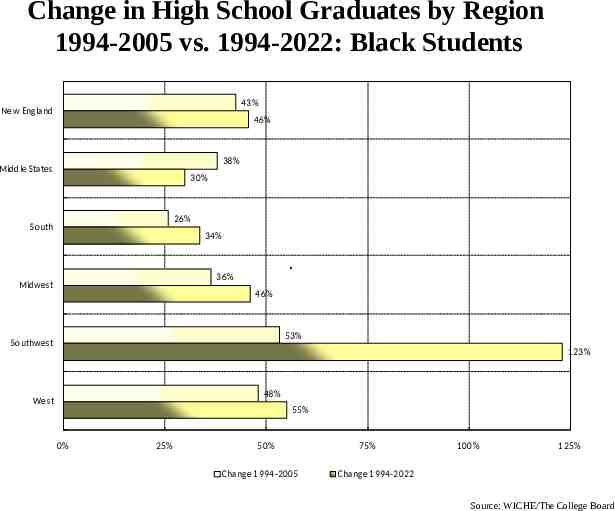
Change in High School Graduates by Region 1994-2005 vs. 1994-2022: Black Students 43% New England 46% 38% Middle States 30% 26% South 34% W M NS 36% Midwest 46% 53% Southwest 123% 48% West 55% 0% 25% 50% Change 1994-2005 75% 100% 125% Change 1994-2022 Source: WICHE/The College Board
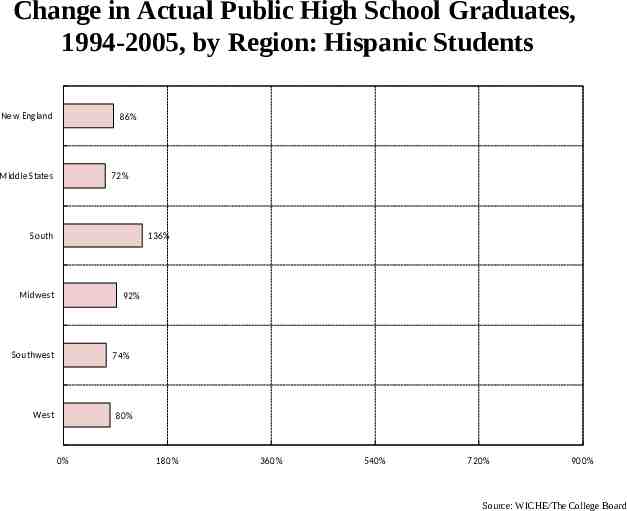
Change in Actual Public High School Graduates, 1994-2005, by Region: Hispanic Students New England 86% Middle States 72% South 136% Midwest 92% Southwest 74% West 80% 0% 180% 360% 540% 720% 900% Source: WICHE/The College Board
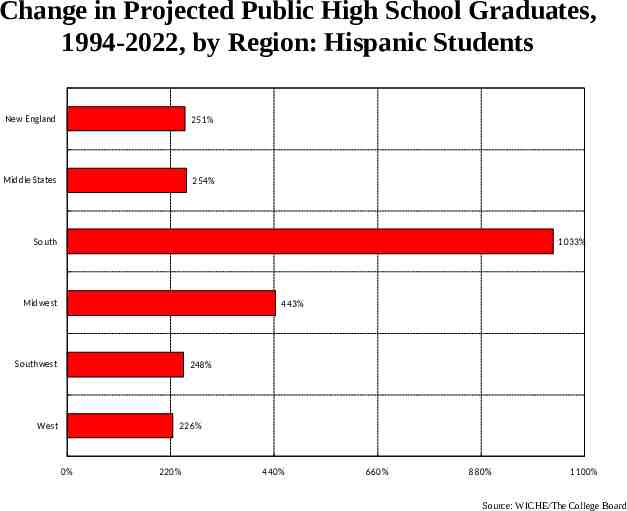
Change in Projected Public High School Graduates, 1994-2022, by Region: Hispanic Students New England 251% Middle States 254% South 1033% Midwest 443% Southwest 248% West 226% 0% 220% 440% 660% 880% 1100% Source: WICHE/The College Board
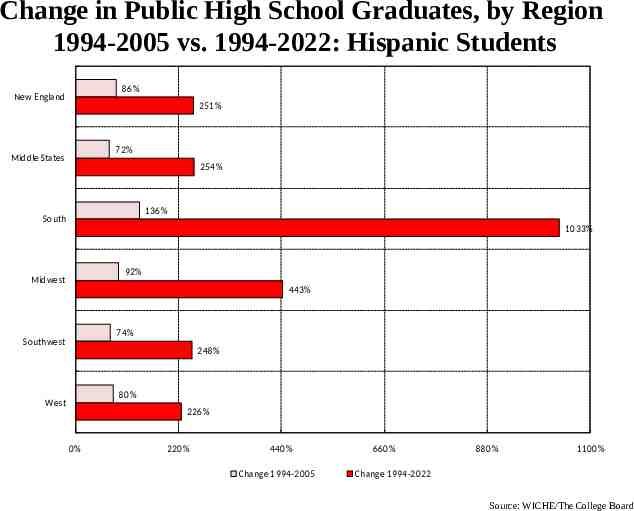
Change in Public High School Graduates, by Region 1994-2005 vs. 1994-2022: Hispanic Students 86% New England 251% 72% Middle States 254% 136% South 1033% 92% Midwest 443% 74% Southwest 248% 80% West 226% 0% 220% 440% Change 1994-2005 660% 880% 1100% Change 1994-2022 Source: WICHE/The College Board
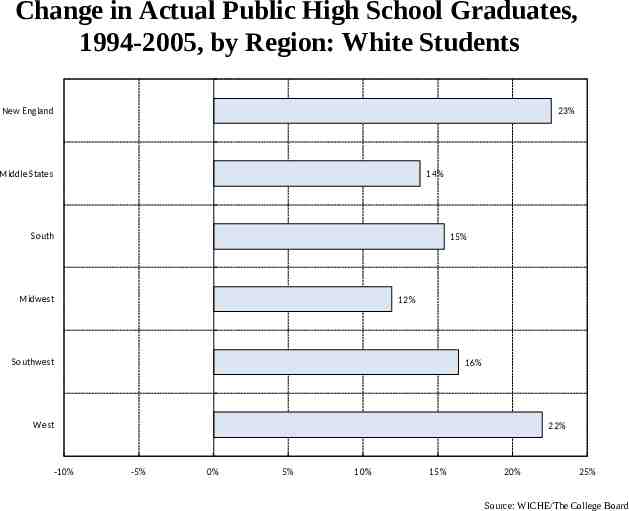
Change in Actual Public High School Graduates, 1994-2005, by Region: White Students New England 23% Middle States 14% South 15% Midwest 12% Southwest 16% West -10% 22% -5% 0% 5% 10% 15% 20% 25% Source: WICHE/The College Board
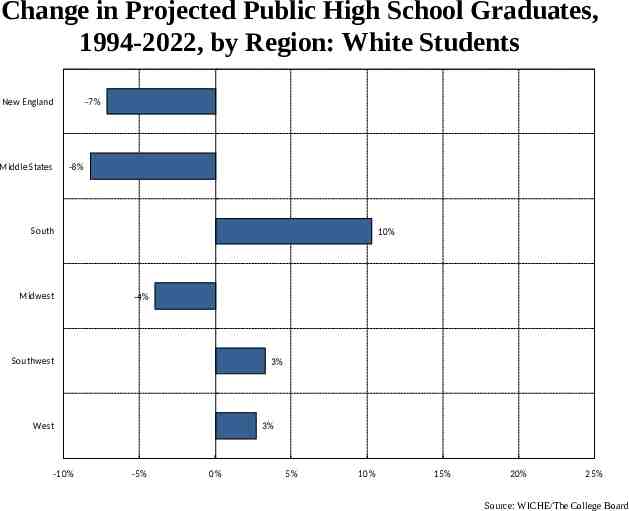
Change in Projected Public High School Graduates, 1994-2022, by Region: White Students New England Middle States -7% -8% South Midwest 10% -4% Southwest 3% West -10% 3% -5% 0% 5% 10% 15% 20% 25% Source: WICHE/The College Board
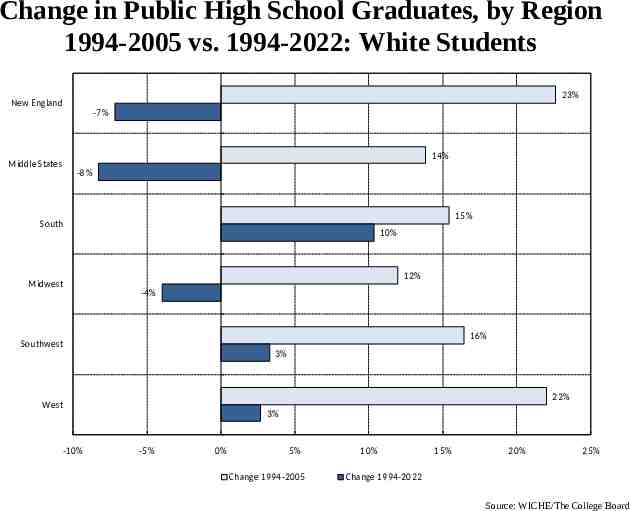
Change in Public High School Graduates, by Region 1994-2005 vs. 1994-2022: White Students 23% New England -7% 14% Middle States -8% 15% South 10% 12% Midwest -4% 16% Southwest 3% 22% West -10% 3% -5% 0% 5% Change 1994-2005 10% 15% 20% 25% Change 1994-2022 Source: WICHE/The College Board
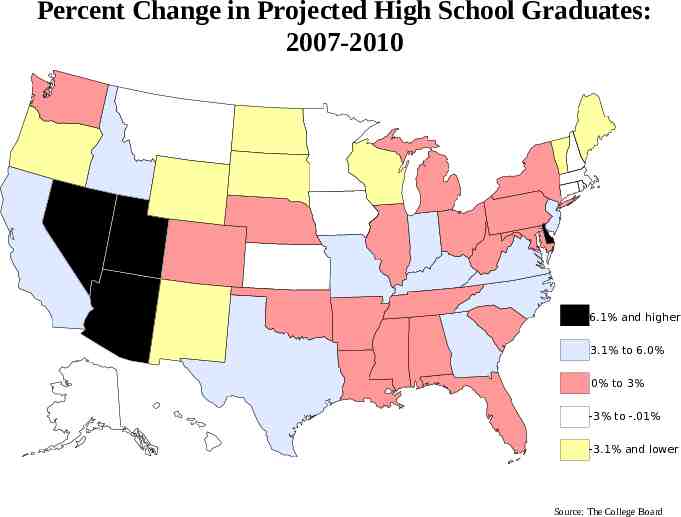
Percent Change in Projected High School Graduates: 2007-2010 6.1% and higher 3.1% to 6.0% 0% to 3% -3% to -.01% -3.1% and lower Source: The College Board
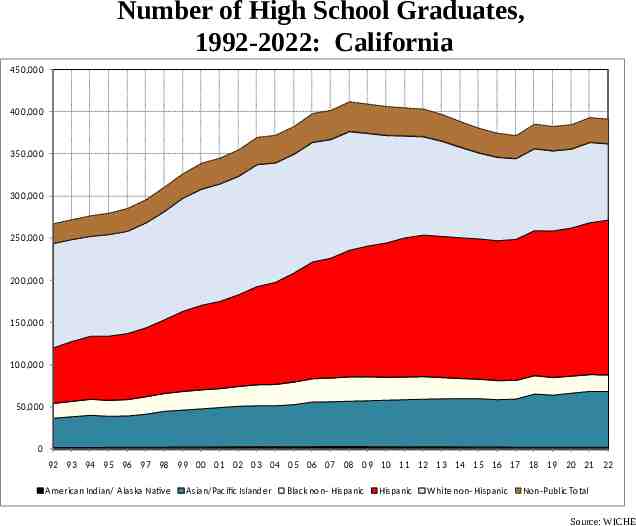
Number of High School Graduates, 1992-2022: California 450,000 400,000 350,000 300,000 250,000 200,000 150,000 100,000 50,000 0 92 93 94 95 96 97 98 99 00 01 02 03 04 05 06 07 08 09 10 11 12 13 14 15 16 17 18 19 20 21 22 American Indian/ Alaska Native Asian/Pacific Islander Black non- Hispanic Hispanic White non- Hispanic Non-Public Total Source: WICHE
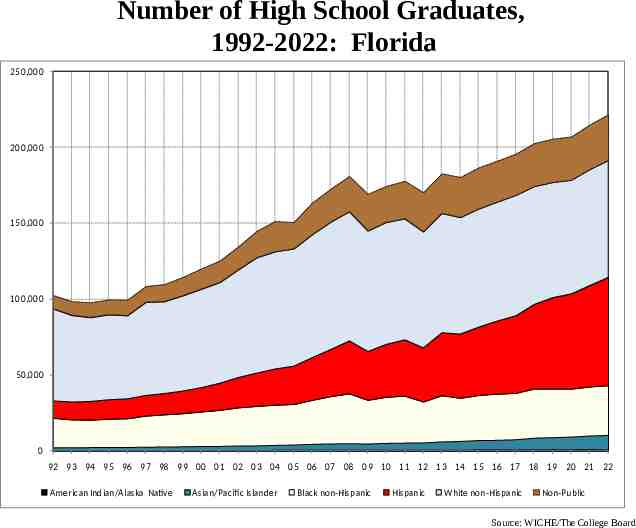
Number of High School Graduates, 1992-2022: Florida 250,000 200,000 150,000 100,000 50,000 0 92 93 94 95 96 97 98 99 00 01 02 03 04 05 06 07 08 09 10 11 12 13 14 15 16 17 18 19 20 21 22 American Indian/Alaska Native Asian/Pacific Islander Black non-Hispanic Hispanic White non-Hispanic Non-Public Source: WICHE/The College Board
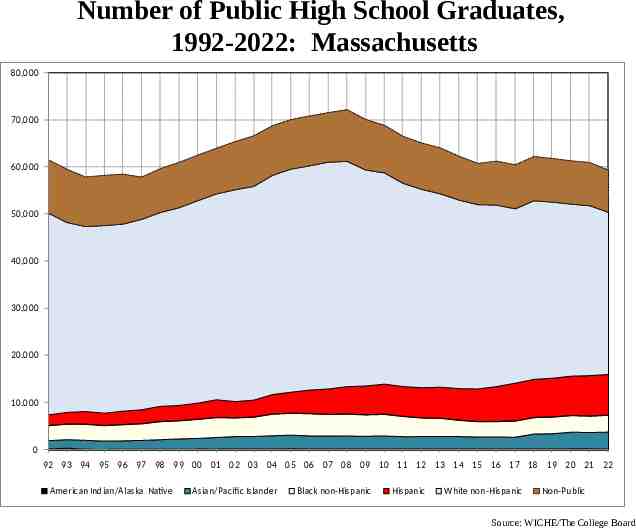
Number of Public High School Graduates, 1992-2022: Massachusetts 80,000 70,000 60,000 50,000 40,000 30,000 20,000 10,000 0 92 93 94 95 96 97 98 99 00 01 02 03 04 05 06 07 08 09 10 11 12 13 14 15 16 17 18 19 20 21 22 American Indian/Alaska Native Asian/Pacific Islander Black non-Hispanic Hispanic White non-Hispanic Non-Public Source: WICHE/The College Board
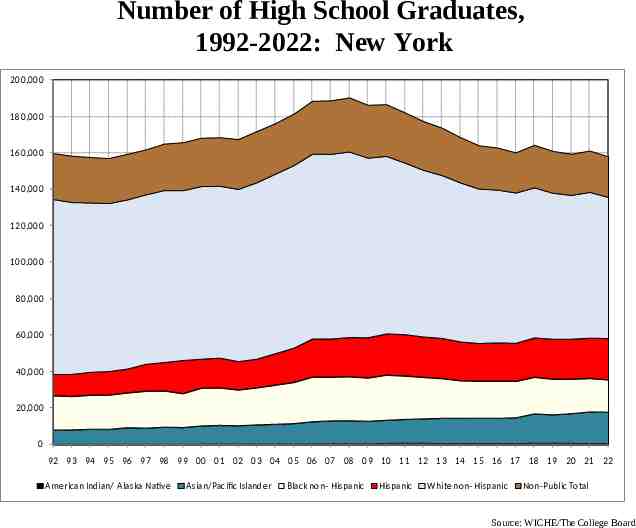
Number of High School Graduates, 1992-2022: New York 200,000 180,000 160,000 140,000 120,000 100,000 80,000 60,000 40,000 20,000 0 92 93 94 95 96 97 98 99 00 01 02 03 04 05 06 07 08 09 10 11 12 13 14 15 16 17 18 19 20 21 22 American Indian/ Alaska Native Asian/Pacific Islander Black non- Hispanic Hispanic White non- Hispanic Non-Public Total Source: WICHE/The College Board
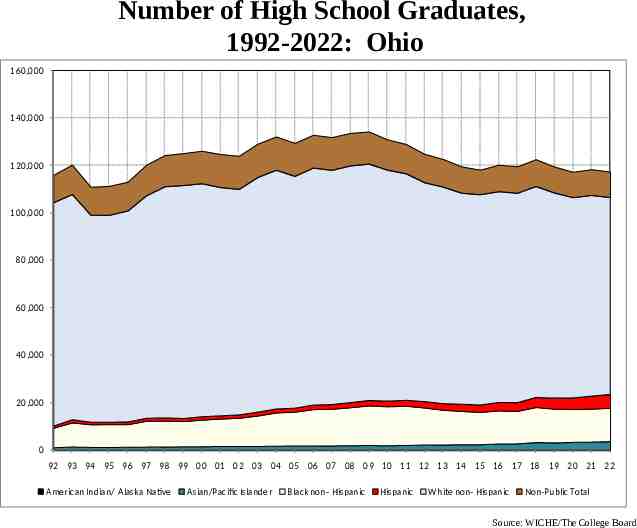
Number of High School Graduates, 1992-2022: Ohio 160,000 140,000 120,000 100,000 80,000 60,000 40,000 20,000 0 92 93 94 95 96 97 98 99 00 01 02 03 04 05 06 07 08 09 10 11 12 13 14 15 16 17 18 19 20 21 22 American Indian/ Alaska Native Asian/Pacific Islander Black non- Hispanic Hispanic White non- Hispanic Non-Public Total Source: WICHE/The College Board
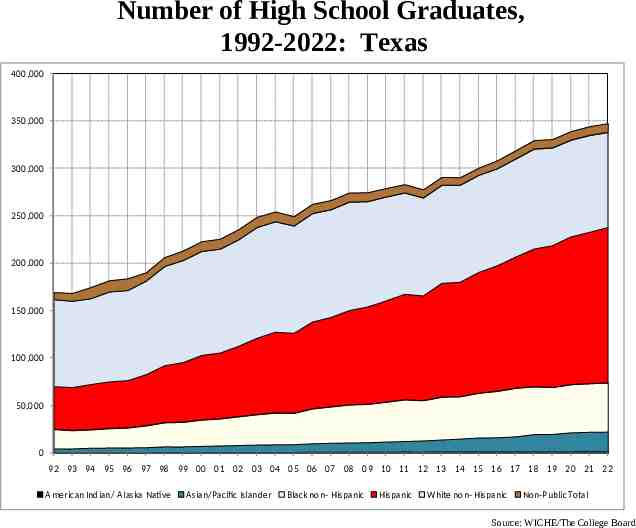
Number of High School Graduates, 1992-2022: Texas 400,000 350,000 300,000 250,000 200,000 150,000 100,000 50,000 0 92 93 94 95 96 97 98 99 00 01 02 03 04 05 06 07 08 09 10 11 12 13 14 15 16 17 18 19 20 21 22 American Indian/ Alaska Native Asian/Pacific Islander Black non- Hispanic Hispanic White non- Hispanic Non-Public Total Source: WICHE/The College Board
II. The Aging Population
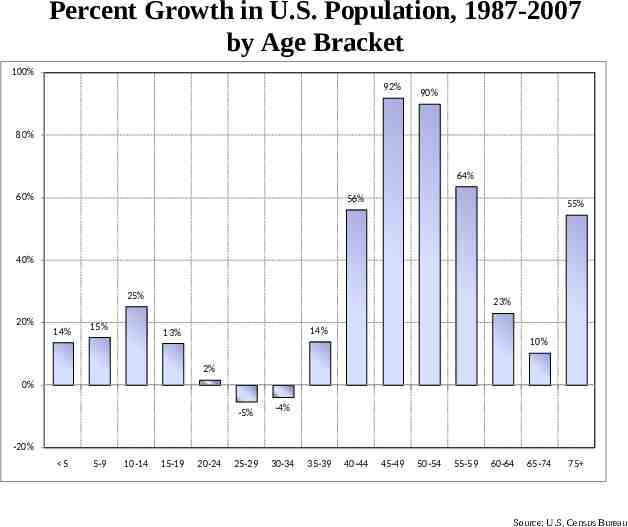
Percent Growth in U.S. Population, 1987-2007 by Age Bracket 100% 92% 90% 80% 64% 60% 56% 55% 40% 25% 20% 14% 15% 23% 14% 13% 10% 2% 0% -5% -4% 25-29 30-34 -20% 5 5-9 10-14 15-19 20-24 35-39 40-44 45-49 50-54 55-59 60-64 65-74 75 Source: U.S. Census Bureau
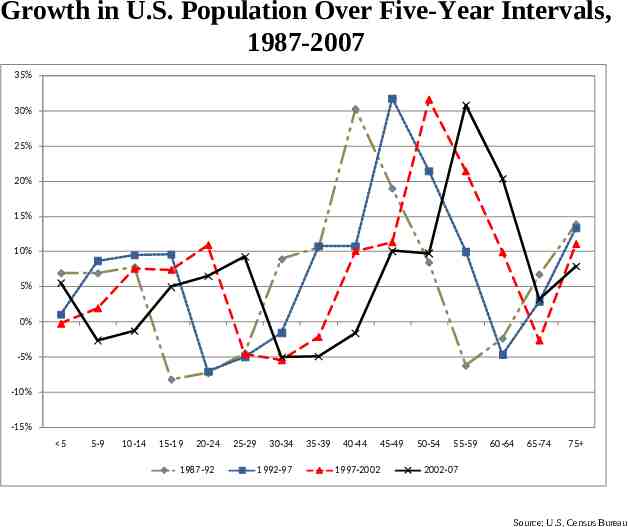
Growth in U.S. Population Over Five-Year Intervals, 1987-2007 35% 30% 25% 20% 15% 10% 5% 0% -5% -10% -15% 5 5-9 10-14 15-19 20-24 1987-92 25-29 30-34 1992-97 35-39 40-44 1997-2002 45-49 50-54 55-59 60-64 65-74 75 2002-07 Source: U.S. Census Bureau
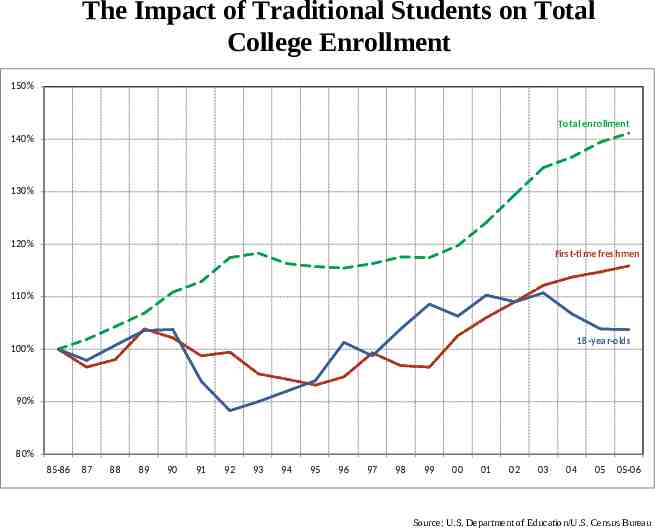
The Impact of Traditional Students on Total College Enrollment 150% Total enrollment 140% 130% 120% First-time freshmen 110% 18-year-olds 100% 90% 80% 85-86 87 88 89 90 91 92 93 94 95 96 97 98 99 00 01 02 03 04 05 05-06 Source: U.S. Department of Education/U.S. Census Bureau
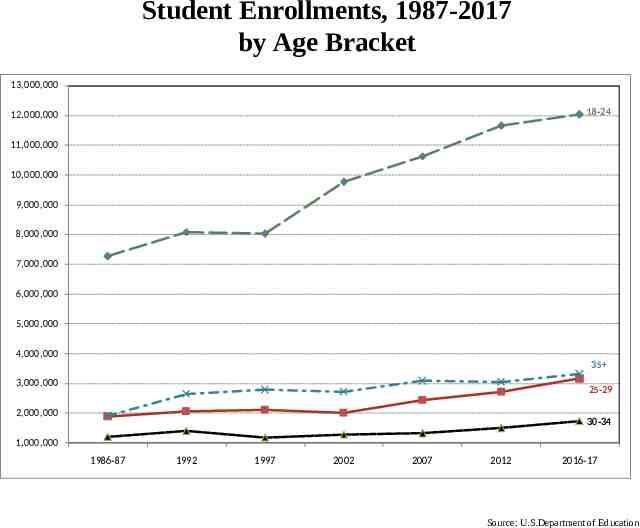
Student Enrollments, 1987-2017 by Age Bracket 13,000,000 18-24 12,000,000 11,000,000 10,000,000 9,000,000 8,000,000 7,000,000 6,000,000 5,000,000 4,000,000 35 3,000,000 25-29 2,000,000 30-34 1,000,000 1986-87 1992 1997 2002 2007 2012 2016-17 Source: U.S.Department of Education
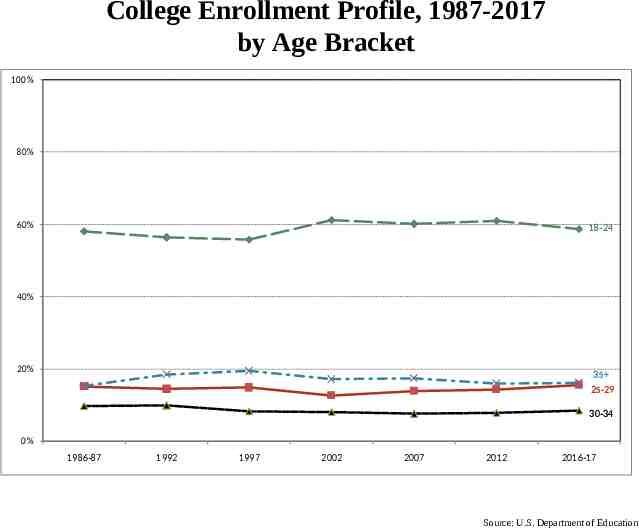
College Enrollment Profile, 1987-2017 by Age Bracket 100% 80% 60% 18-24 40% 20% 35 25-29 30-34 0% 1986-87 1992 1997 2002 2007 2012 2016-17 Source: U.S. Department of Education
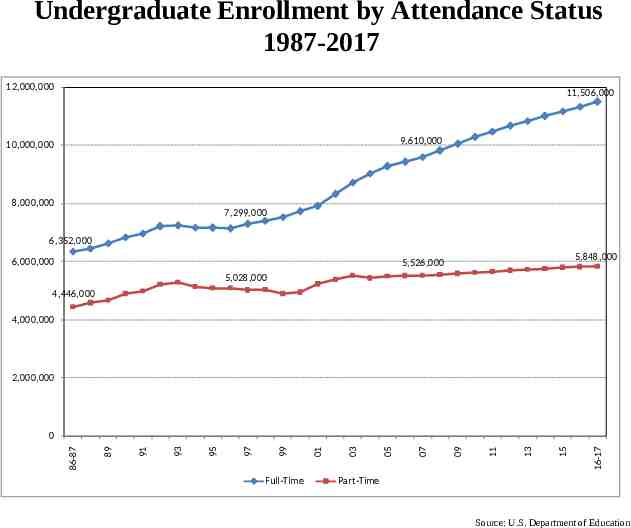
Undergraduate Enrollment by Attendance Status 1987-2017 12,000,000 11,506,000 9,610,000 10,000,000 8,000,000 7,299,000 6,352,000 6,000,000 5,848,000 5,526,000 5,028,000 4,446,000 4,000,000 2,000,000 Full-Time 16-17 15 13 11 09 07 05 03 01 99 97 95 93 91 89 86-87 0 Part-Time Source: U.S. Department of Education
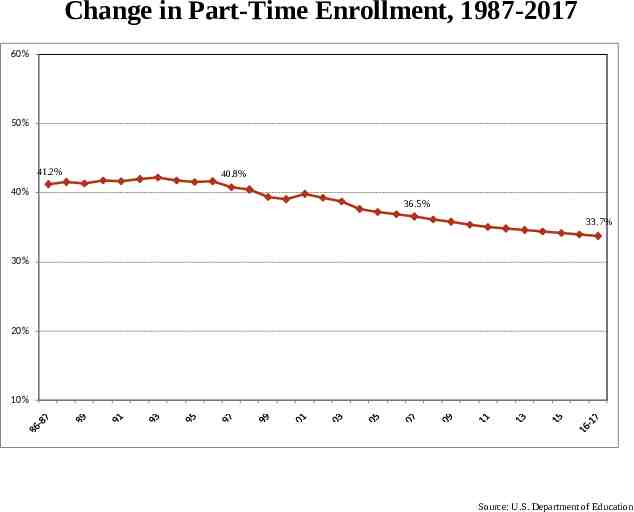
Change in Part-Time Enrollment, 1987-2017 60% 50% 41.2% 40.8% 40% 36.5% 33.7% 30% 20% 10% Source: U.S. Department of Education
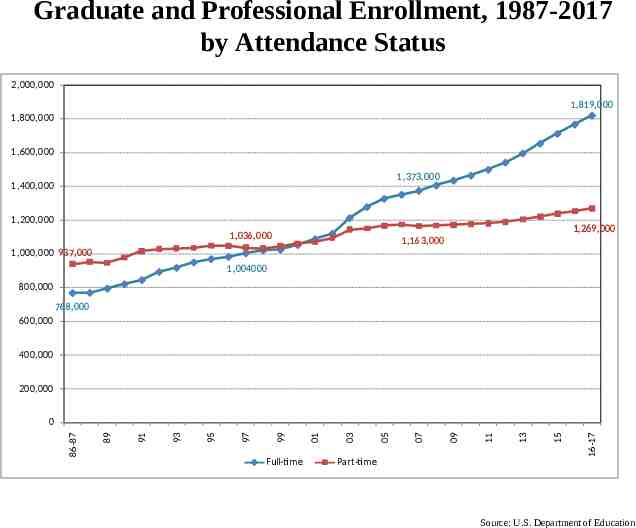
Graduate and Professional Enrollment, 1987-2017 by Attendance Status 2,000,000 1,819,000 1,800,000 1,600,000 1,373,000 1,400,000 1,200,000 1,269,000 1,036,000 1,163,000 1,000,000 937,000 1,004000 800,000 768,000 600,000 400,000 200,000 Full-time 16-17 15 13 11 09 07 05 03 01 99 97 95 93 91 89 86-87 0 Part-time Source: U.S. Department of Education
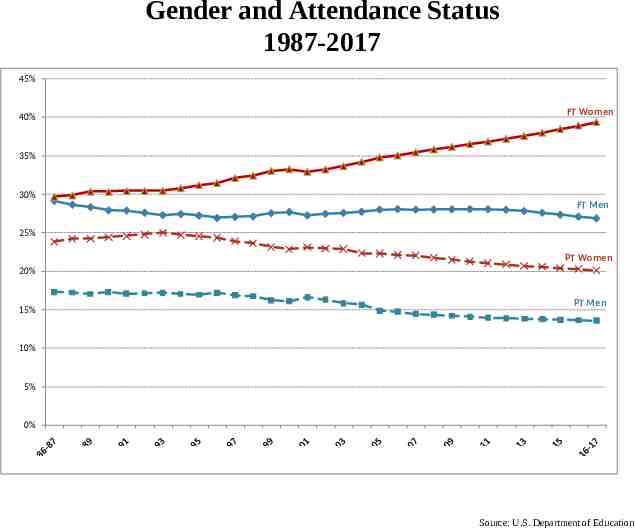
Gender and Attendance Status 1987-2017 45% 40% FT Women 35% 30% FT Men 25% PT Women 20% 15% PT Men 10% 5% 0% Source: U.S. Department of Education
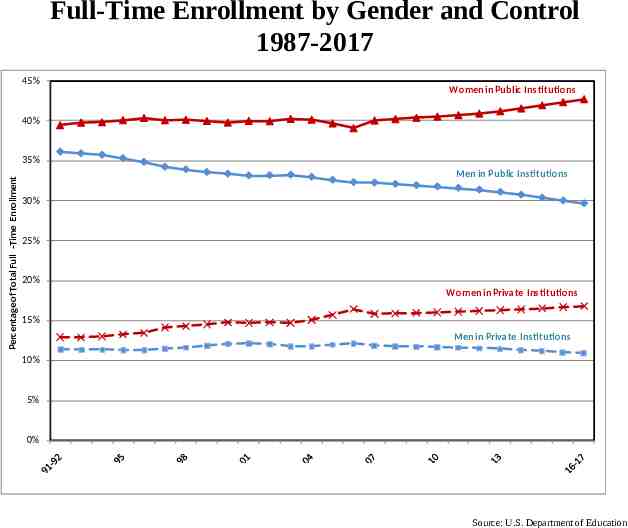
Full-Time Enrollment by Gender and Control 1987-2017 45% Women in Public Institutions 40% Percentage of Total Full -Time Enrollment 35% Men in Public Institutions 30% 25% 20% Women in Private Institutions 15% Men in Private Institutions 10% 5% 0% Source: U.S. Department of Education
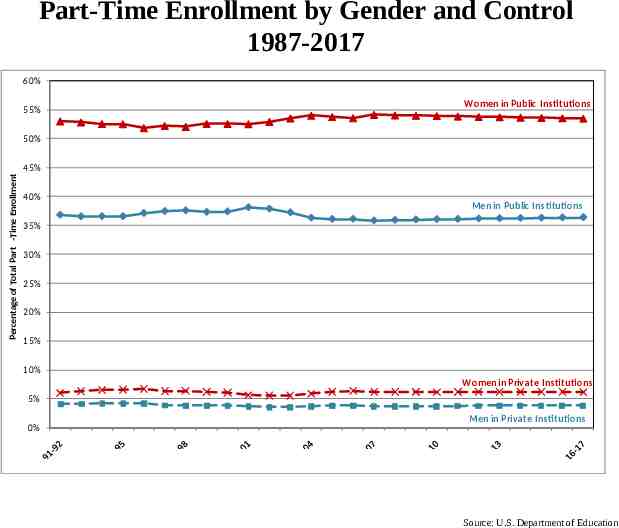
Part-Time Enrollment by Gender and Control 1987-2017 60% 55% Women in Public Institutions 50% Percentage of Total Part -Time Enrollment 45% 40% Men in Public Institutions 35% 30% 25% 20% 15% 10% Women in Private Institutions 5% 0% Men in Private Institutions Source: U.S. Department of Education
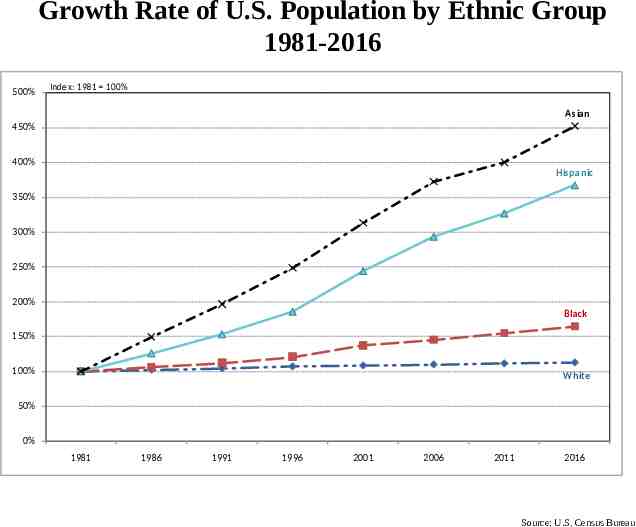
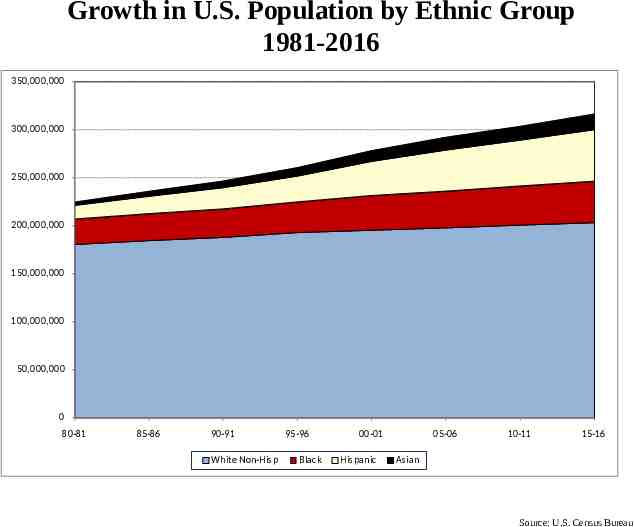
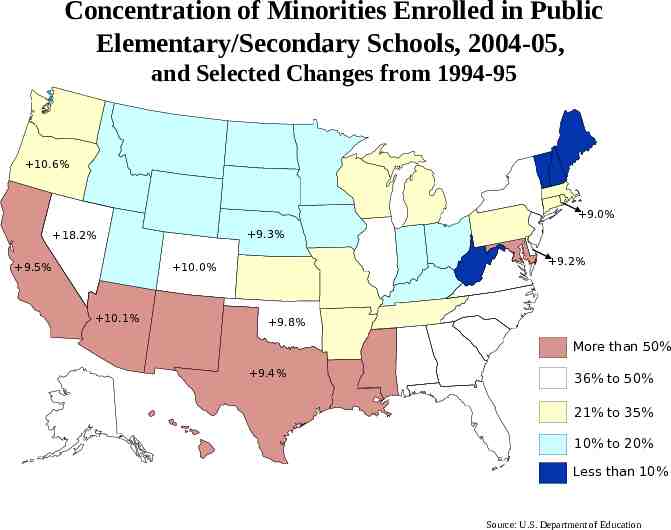
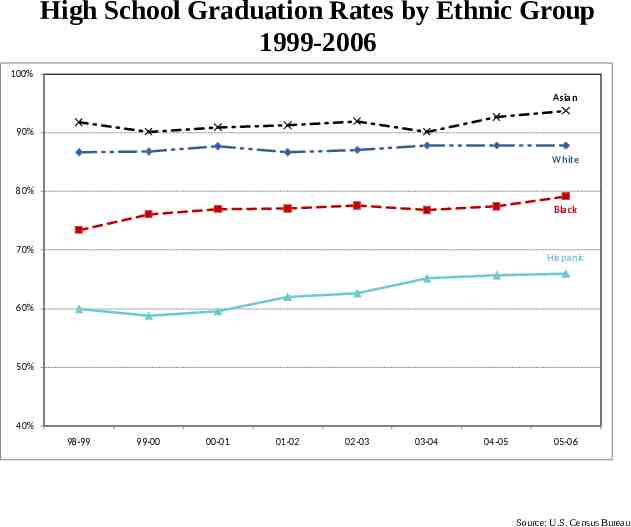
III. Growing Ethnic Diversity
Growth Rate of U.S. Population by Ethnic Group 1981-2016 500% Index: 1981 100% Asian 450% 400% Hispanic 350% 300% 250% 200% Black 150% 100% White 50% 0% 1981 1986 1991 1996 2001 2006 2011 2016 Source: U.S. Census Bureau
Growth in U.S. Population by Ethnic Group 1981-2016 350,000,000 300,000,000 250,000,000 200,000,000 150,000,000 100,000,000 50,000,000 0 80-81 85-86 90-91 White Non-Hisp 95-96 Black 00-01 Hispanic 05-06 10-11 15-16 Asian Source: U.S. Census Bureau
Concentration of Minorities Enrolled in Public Elementary/Secondary Schools, 2004-05, and Selected Changes from 1994-95 10.6% 9.0% 9.3% 18.2% 9.5% 9.2% 10.0% 10.1% 9.8% More than 50% 9.4% 36% to 50% 21% to 35% 10% to 20% Less than 10% Source: U.S. Department of Education
High School Graduation Rates by Ethnic Group 1999-2006 100% Asian 90% White 80% Black 70% Hispanic 60% 50% 40% 98-99 99-00 00-01 01-02 02-03 03-04 04-05 05-06 Source: U.S. Census Bureau
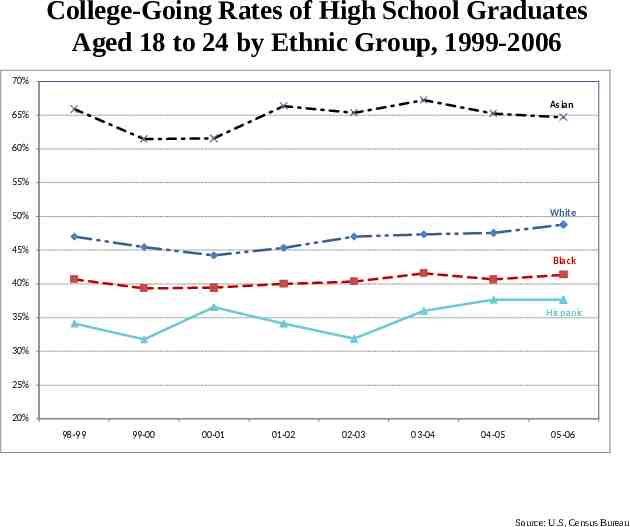
College-Going Rates of High School Graduates Aged 18 to 24 by Ethnic Group, 1999-2006 70% Asian 65% 60% 55% White 50% 45% Black 40% Hispanic 35% 30% 25% 20% 98-99 99-00 00-01 01-02 02-03 03-04 04-05 05-06 Source: U.S. Census Bureau
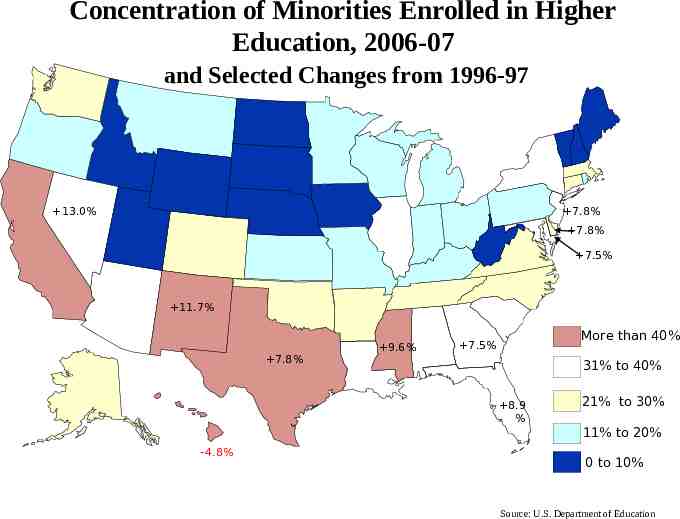
Concentration of Minorities Enrolled in Higher Education, 2006-07 and Selected Changes from 1996-97 7.8% 13.0% 7.8% 7.5% 11.7% 7.8% 9.6% More than 40% 7.5% 31% to 40% 8.9 % -4.8% 21% to 30% 11% to 20% 0 to 10% Source: U.S. Department of Education
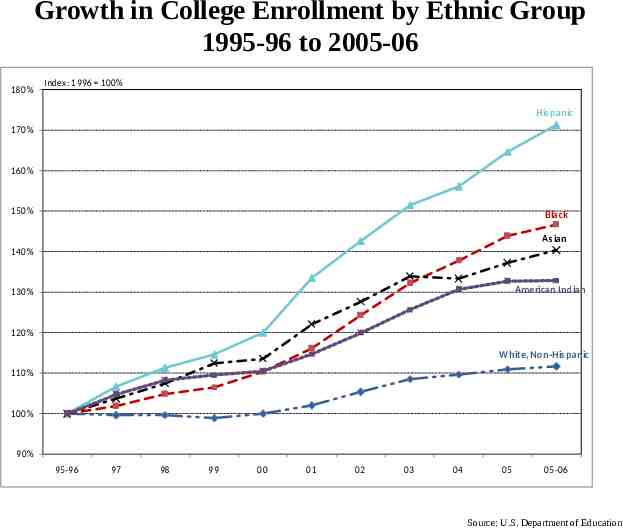
Growth in College Enrollment by Ethnic Group 1995-96 to 2005-06 180% Index: 1996 100% Hispanic 170% 160% 150% Black Asian 140% American Indian 130% 120% White, Non-Hispanic 110% 100% 90% 95-96 97 98 99 00 01 02 03 04 05 05-06 Source: U.S. Department of Education
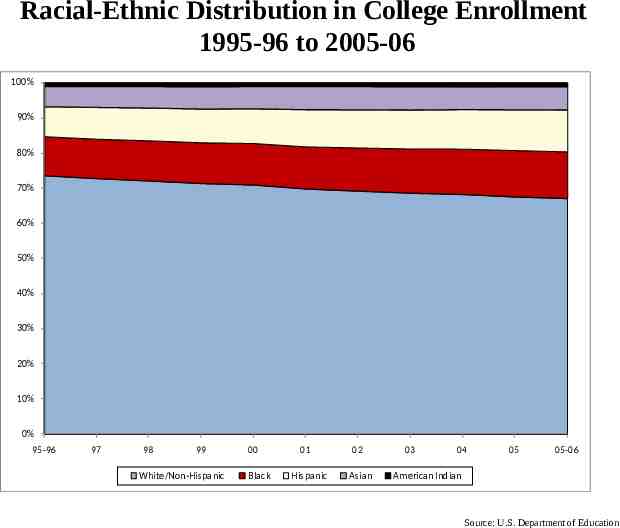
Racial-Ethnic Distribution in College Enrollment 1995-96 to 2005-06 100% 90% 80% 70% 60% 50% 40% 30% 20% 10% 0% 95-96 97 98 99 White/Non-Hispanic 00 Black 01 Hispanic 02 Asian 03 04 05 05-06 American Indian Source: U.S. Department of Education
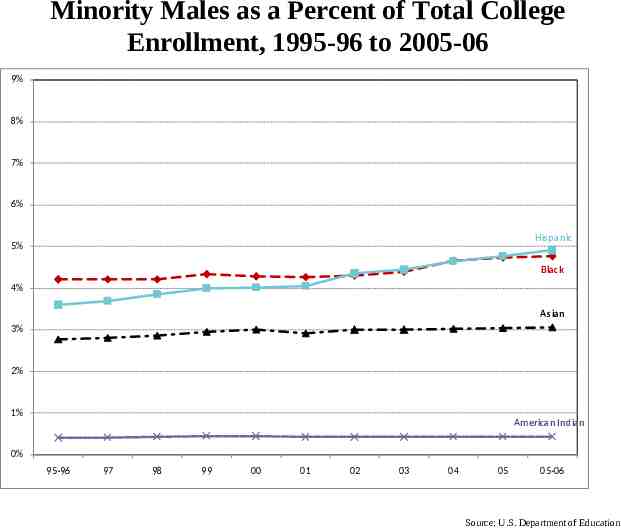
Minority Males as a Percent of Total College Enrollment, 1995-96 to 2005-06 9% 8% 7% 6% Hispanic 5% Black 4% Asian 3% 2% 1% American Indian 0% 95-96 97 98 99 00 01 02 03 04 05 05-06 Source: U.S. Department of Education
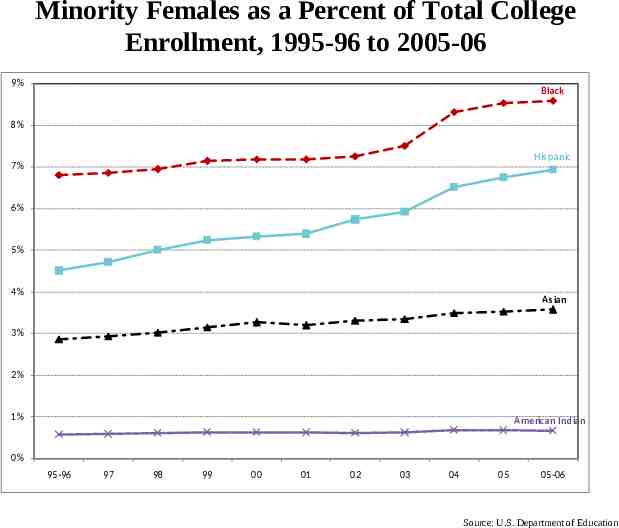
Minority Females as a Percent of Total College Enrollment, 1995-96 to 2005-06 9% Black 8% Hispanic 7% 6% 5% 4% Asian 3% 2% 1% American Indian 0% 95-96 97 98 99 00 01 02 03 04 05 05-06 Source: U.S. Department of Education
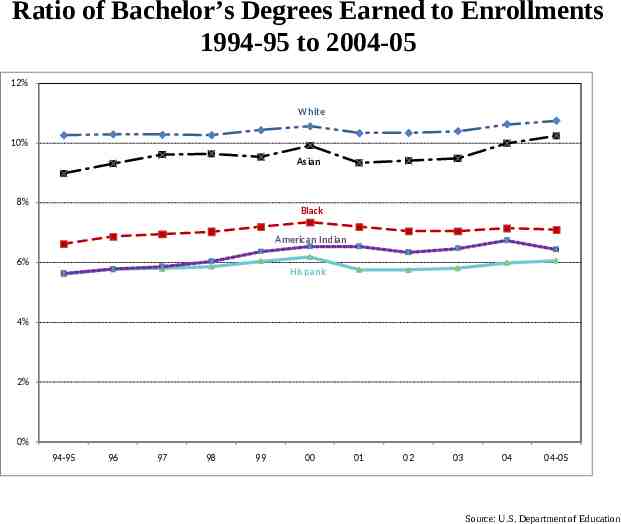
Ratio of Bachelor’s Degrees Earned to Enrollments 1994-95 to 2004-05 12% White 10% Asian 8% Black American Indian 6% Hispanic 4% 2% 0% 94-95 96 97 98 99 00 01 02 03 04 04-05 Source: U.S. Department of Education
IV. 2007 High School Seniors: Graduation and Four-Year College Enrollment Selected States
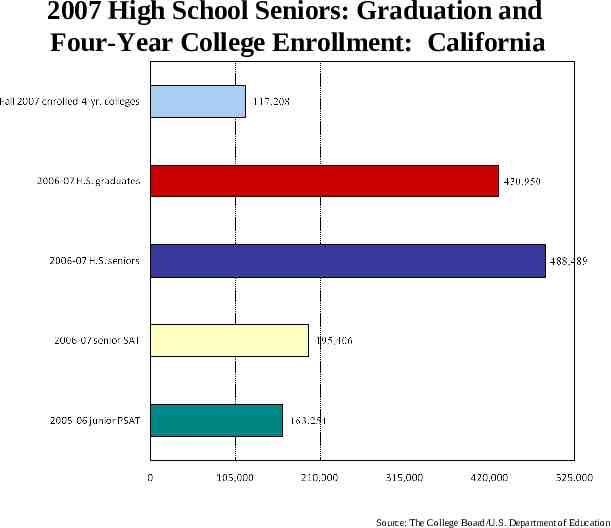
2007 High School Seniors: Graduation and Four-Year College Enrollment: California Source: The College Board/U.S. Department of Education
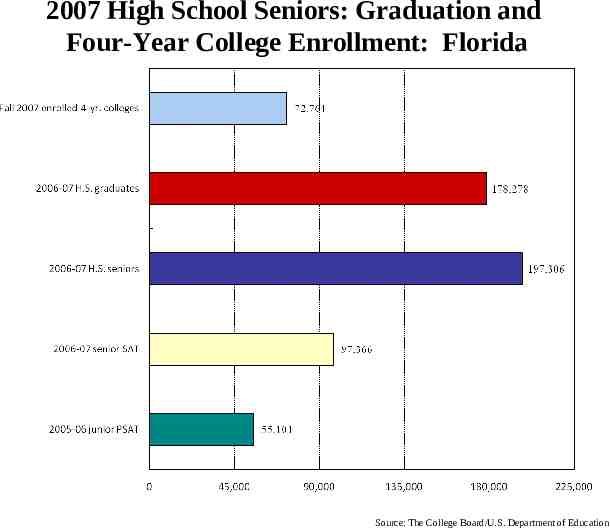
2007 High School Seniors: Graduation and Four-Year College Enrollment: Florida Source: The College Board/U.S. Department of Education
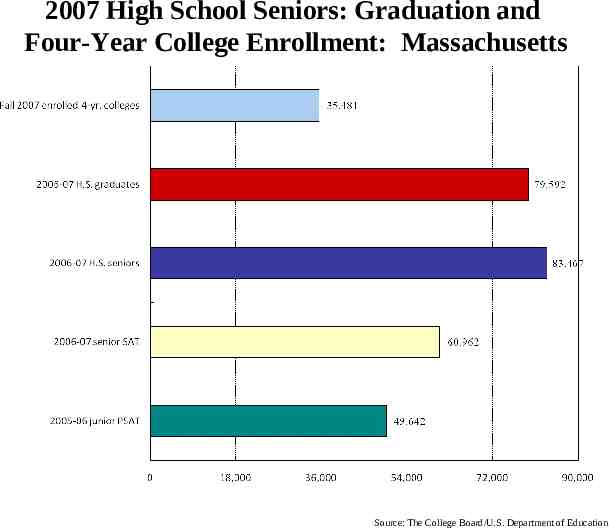
2007 High School Seniors: Graduation and Four-Year College Enrollment: Massachusetts Source: The College Board/U.S. Department of Education
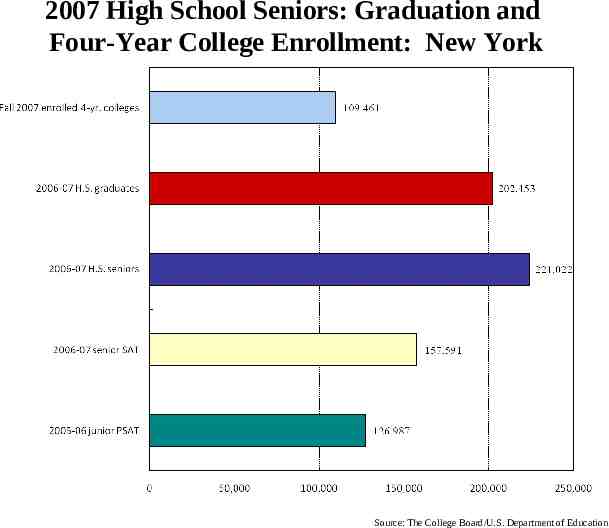
2007 High School Seniors: Graduation and Four-Year College Enrollment: New York Source: The College Board/U.S. Department of Education
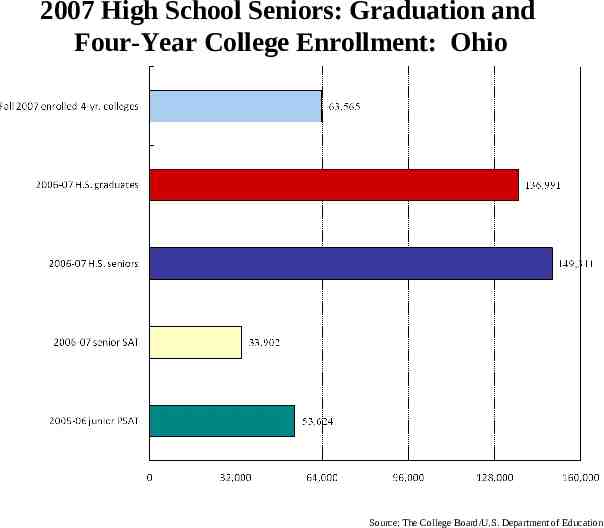
2007 High School Seniors: Graduation and Four-Year College Enrollment: Ohio Source: The College Board/U.S. Department of Education
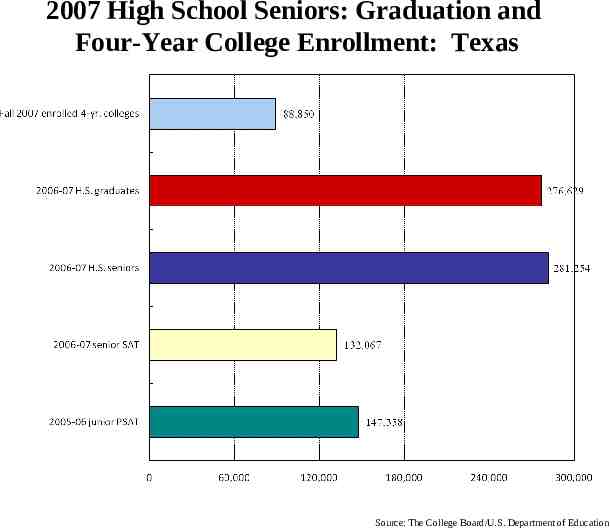
2007 High School Seniors: Graduation and Four-Year College Enrollment: Texas Source: The College Board/U.S. Department of Education
V. Other Trends Affecting Higher Education
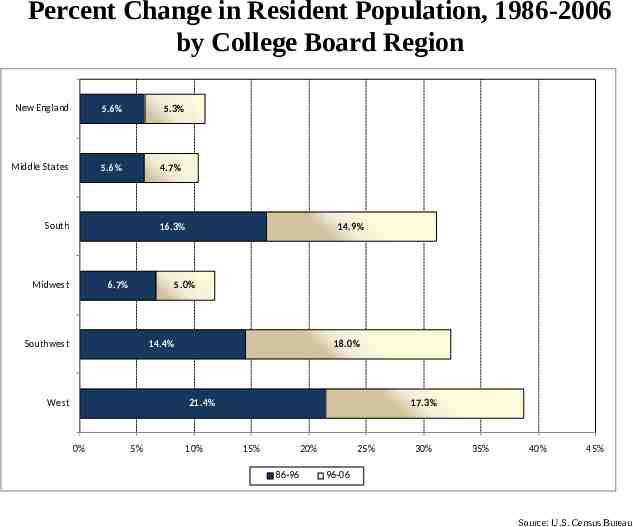
Percent Change in Resident Population, 1986-2006 by College Board Region New England 5.6% Middle States 5.6% 5.3% 4.7% South 16.3% Midwest 6.7% 14.9% 5.0% Southwest 14.4% West 18.0% 21.4% 0% 5% 10% 17.3% 15% 20% 86-96 25% 30% 35% 40% 45% 96-06 Source: U.S. Census Bureau
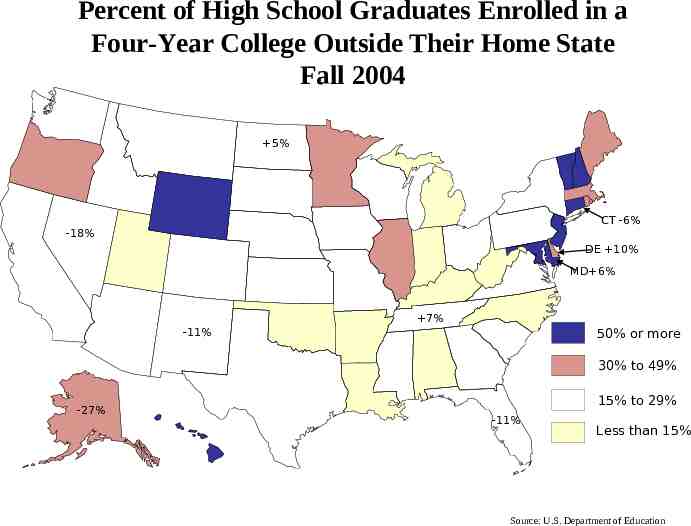
Percent of High School Graduates Enrolled in a Four-Year College Outside Their Home State Fall 2004 5% CT -6% -18% -9% DE 10% MD 6% 7% 50% or more -6% -11% 30% to 49% -27% 15% to 29% -11% Less than 15% Source: U.S. Department of Education
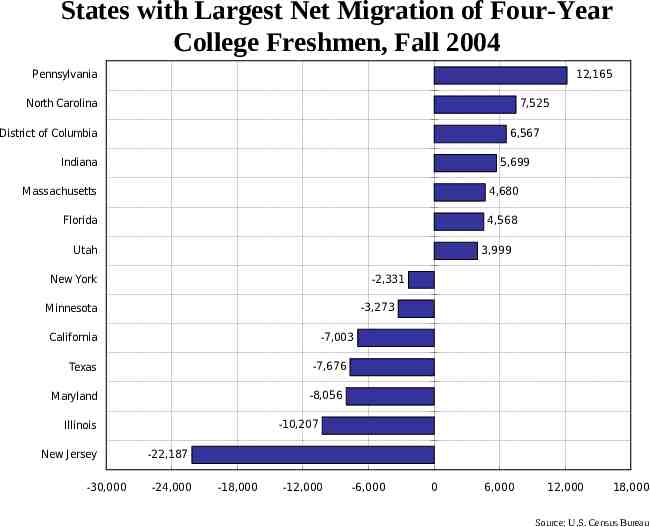
States with Largest Net Migration of Four-Year College Freshmen, Fall 2004 Pennsylvania 12,165 North Carolina 7,525 District of Columbia 6,567 Indiana 5,699 Massachusetts 4,680 Florida 4,568 Utah 3,999 New York -2,331 -3,273 Minnesota -7,003 California -7,676 Texas -8,056 Maryland -10,207 Illinois New J ersey -30,000 -22,187 -24,000 -18,000 -12,000 -6,000 0 6,000 12,000 18,000 Source: U.S. Census Bureau
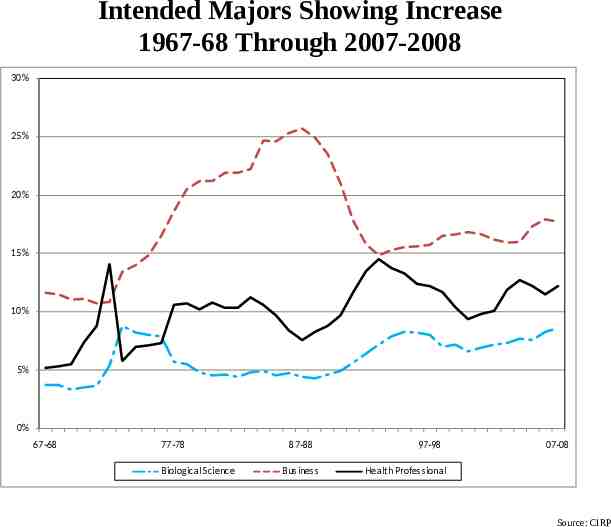
Intended Majors Showing Increase 1967-68 Through 2007-2008 30% 25% 20% 15% 10% 5% 0% 67-68 77-78 Biological Science 87-88 Business 97-98 07-08 Health Professional Source: CIRP
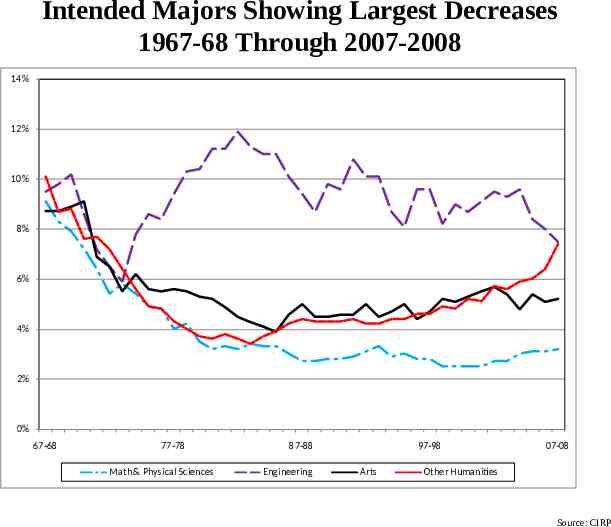
Intended Majors Showing Largest Decreases 1967-68 Through 2007-2008 14% 12% 10% 8% 6% 4% 2% 0% 67-68 77-78 Math & Physical Sciences 87-88 Engineering 97-98 Arts 07-08 Other Humanities Source: CIRP
VI. Trends in College Costs and Financial Aid
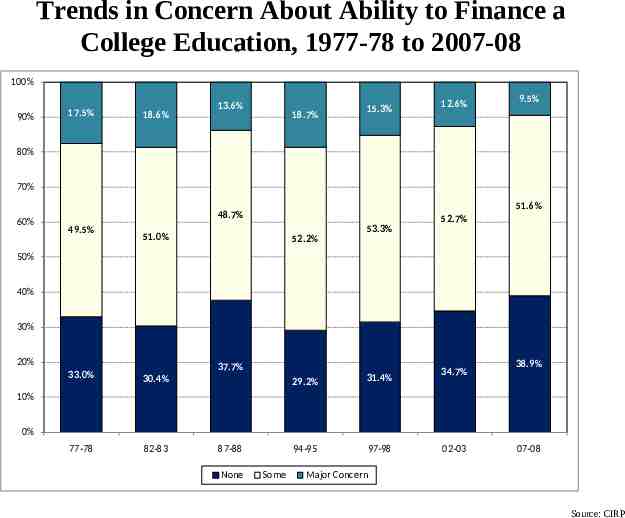
Trends in Concern About Ability to Finance a College Education, 1977-78 to 2007-08 100% 90% 17.5% 18.6% 13.6% 18.7% 15.3% 12.6% 9.5% 80% 70% 60% 51.6% 48.7% 49.5% 51.0% 52.2% 53.3% 52.7% 50% 40% 30% 20% 37.7% 33.0% 30.4% 77-78 82-83 29.2% 31.4% 94-95 97-98 34.7% 38.9% 10% 0% 87-88 None Some 02-03 07-08 Major Concern Source: CIRP
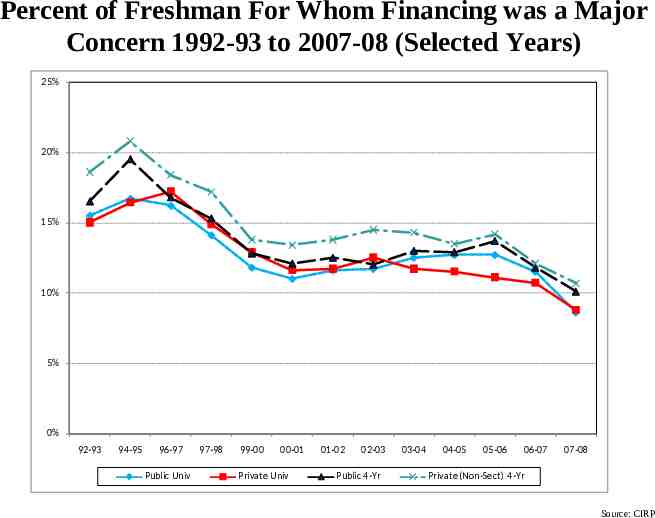
Percent of Freshman For Whom Financing was a Major Concern 1992-93 to 2007-08 (Selected Years) 25% 20% 15% 10% 5% 0% 92-93 94-95 96-97 Public Univ 97-98 99-00 00-01 Private Univ 01-02 02-03 Public 4-Yr 03-04 04-05 05-06 06-07 07-08 Private (Non-Sect) 4-Yr Source: CIRP
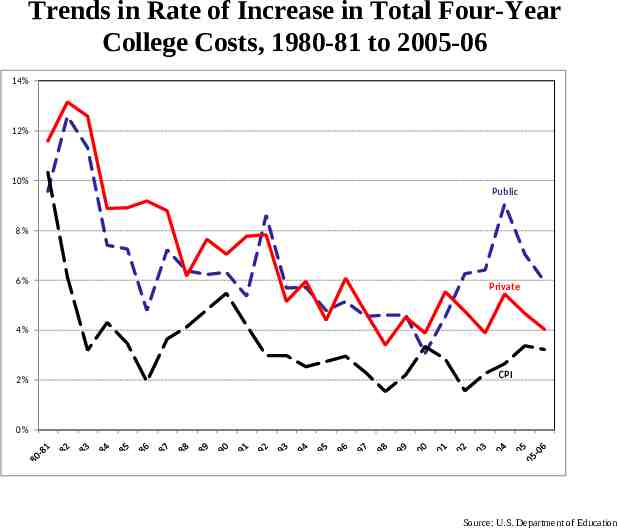
Trends in Rate of Increase in Total Four-Year College Costs, 1980-81 to 2005-06 14% 12% 10% Public 8% 6% Private 4% 2% CPI 0% Source: U.S. Department of Education
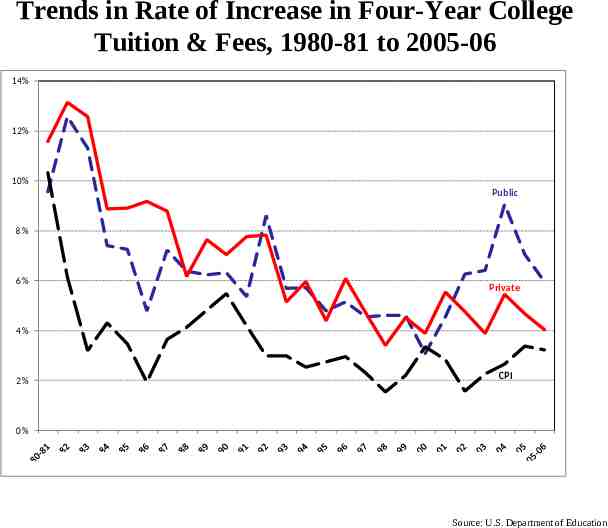
Trends in Rate of Increase in Four-Year College Tuition & Fees, 1980-81 to 2005-06 14% 12% 10% Public 8% 6% Private 4% 2% CPI 0% Source: U.S. Department of Education
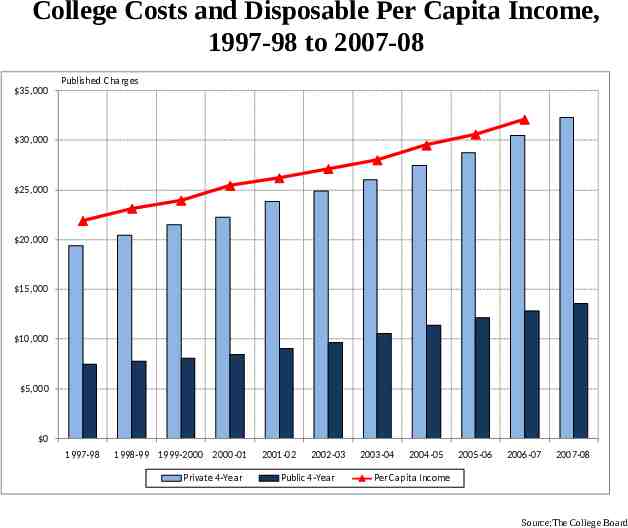
College Costs and Disposable Per Capita Income, 1997-98 to 2007-08 35,000 Published Charges 30,000 25,000 20,000 15,000 10,000 5,000 0 1997-98 1998-99 1999-2000 2000-01 Private 4-Year 2001-02 2002-03 Public 4-Year 2003-04 2004-05 2005-06 2006-07 2007-08 Per Capita Income Source:The College Board
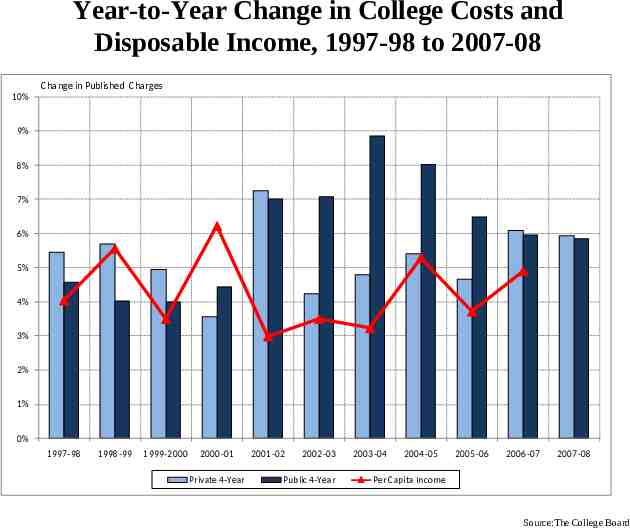
Year-to-Year Change in College Costs and Disposable Income, 1997-98 to 2007-08 Change in Published Charges 10% 9% 8% 7% 6% 5% 4% 3% 2% 1% 0% 1997-98 1998-99 1999-2000 2000-01 Private 4-Year 2001-02 2002-03 Public 4-Year 2003-04 2004-05 2005-06 2006-07 2007-08 Per Capita Income Source:The College Board
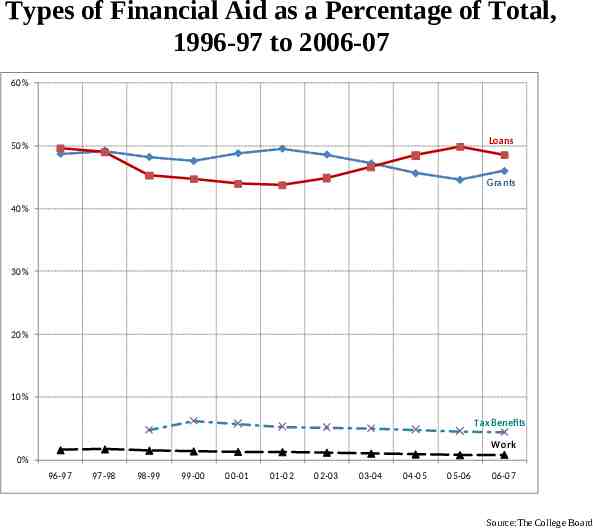
Types of Financial Aid as a Percentage of Total, 1996-97 to 2006-07 60% Loans 50% Grants 40% 30% 20% 10% Tax Benefits Work 0% 96-97 97-98 98-99 99-00 00-01 01-02 02-03 03-04 04-05 05-06 06-07 Source:The College Board
Intended Majors Showing Largest Decreases 1967-68 Through 2007-2008 14% 12% 10% 8% 6% 4% 2% 0% 67-68 77-78 Math & Physical Sciences 87-88 Engineering 97-98 Arts 07-08 Other Humanities Source: CIRP
VI. Trends in College Costs and Financial Aid
Trends in Concern About Ability to Finance a College Education, 1977-78 to 2007-08 100% 90% 17.5% 18.6% 13.6% 18.7% 15.3% 12.6% 9.5% 80% 70% 60% 51.6% 48.7% 49.5% 51.0% 52.2% 53.3% 52.7% 50% 40% 30% 20% 37.7% 33.0% 30.4% 77-78 82-83 29.2% 31.4% 94-95 97-98 34.7% 38.9% 10% 0% 87-88 None Some 02-03 07-08 Major Concern Source: CIRP
Year-to-Year Change in College Costs and Disposable Income, 1997-98 to 2007-08 Change in Published Charges 10% 9% 8% 7% 6% 5% 4% 3% 2% 1% 0% 1997-98 1998-99 1999-2000 2000-01 Private 4-Year 2001-02 2002-03 Public 4-Year 2003-04 2004-05 2005-06 2006-07 2007-08 Per Capita Income Source:The College Board
Types of Financial Aid as a Percentage of Total, 1996-97 to 2006-07 60% Loans 50% Grants 40% 30% 20% 10% Tax Benefits Work 0% 96-97 97-98 98-99 99-00 00-01 01-02 02-03 03-04 04-05 05-06 06-07 Source:The College Board
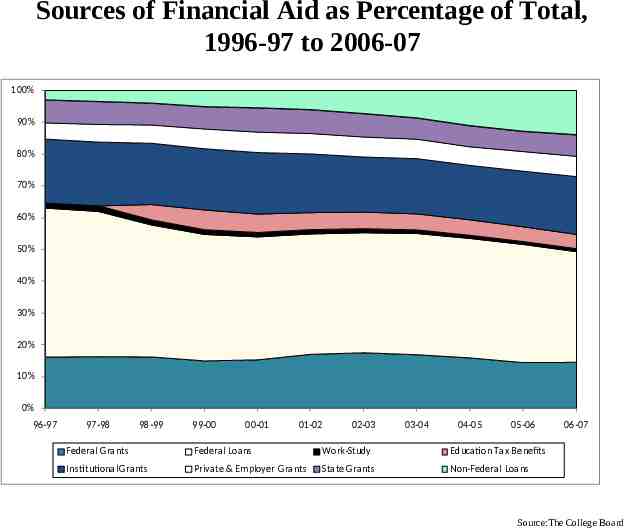
Sources of Financial Aid as Percentage of Total, 1996-97 to 2006-07 100% 90% 80% 70% 60% 50% 40% 30% 20% 10% 0% 96-97 97-98 98-99 99-00 00-01 01-02 02-03 03-04 04-05 05-06 Federal Grants Federal Loans Work-Study Education Tax Benefits Institutional Grants Private & Employer Grants State Grants Non-Federal Loans 06-07 Source:The College Board