Practical Guidance on the Use of PeopleSoft Performance Monitor David


55 Slides573.00 KB
Practical Guidance on the Use of PeopleSoft Performance Monitor David Kurtz Go-Faster Consultancy Ltd. [email protected] www.go-faster.co.uk Practical PSFT PPM UKOUG2008 www.go-faster.co.uk 1
Who Am I? Oracle Database Specialist – Independent consultant System Performance tuning Book – www.psftdba.com – PeopleSoft ERP – Oracle RDBMS Practical PSFT PPM UKOUG2008 www.go-faster.co.uk 2
Agenda Instrumentation – Oracle RDBMS – PeopleSoft PeopleTools Using PeopleSoft Performance Monitor – Problems – Performance Trace – Digging in the data Practical PSFT PPM UKOUG2008 www.go-faster.co.uk 3
Resources If you can’t hear me say so now. Please feel free to ask questions as we go along. The presentation will be available from Conference website www.go-faster.co.uk Article in UKOUG Oracle Scene magazine Practical PSFT PPM UKOUG2008 www.go-faster.co.uk 4
Performance Tuning We do not use ratio based tuning any more. – Especially the buffer cache hit ratio We do use timed event based tuning. Further reading: – YAPP – Kolk, Yamaguchi, and Viscusi – Optimising Oracle Performance - Millsap & Holt www.method-r.com, www.hotsos.com, www.oreilley.com – The Goal – Eli Goldratt Practical PSFT PPM UKOUG2008 www.go-faster.co.uk 5
Performance Instrumentation Oracle does understand instrumentation. – Instrumentation is built in throughout the database kernel. PeopleTools 8.44 upwards includes Performance Monitor. – Instrumentation built into PeopleSoft technology. Practical PSFT PPM UKOUG2008 www.go-faster.co.uk 6
Oracle RDBMS Instrumentation Dynamic Performance Views – Statspack – AWR / ADDM / ASH (licensed extras) Trace/Dump to operating system files – Enhanced by setting events – Profilers Practical PSFT PPM UKOUG2008 www.go-faster.co.uk 7
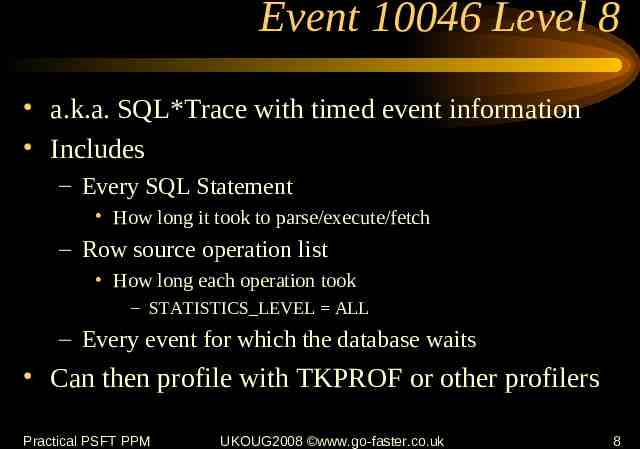
Event 10046 Level 8 a.k.a. SQL*Trace with timed event information Includes – Every SQL Statement How long it took to parse/execute/fetch – Row source operation list How long each operation took – STATISTICS LEVEL ALL – Every event for which the database waits Can then profile with TKPROF or other profilers Practical PSFT PPM UKOUG2008 www.go-faster.co.uk 8
What does this instrumentation do for us? If you have a performance problem, then you can determine exactly what the database is doing, and how long that is taking. – It can also prove that the problem is not located in the database! Hence, you can work out what to do about it. Practical PSFT PPM UKOUG2008 www.go-faster.co.uk 9
You get allevent you You probably probably won’t don’t need need from event 10046! SQL*Net Message from Client – Idle Event? – Database is Idle, but is the user idle? – Or is something else active in the technology stack (so the user is still waiting)? This event cannot distinguish between these conditions. Practical PSFT PPM UKOUG2008 www.go-faster.co.uk 11
Timed Event Information Oracle timed events tell us about the database. We need similar information for every element in the technology chain. PeopleSoft realised this and instrumented their entire technology stack. – And they got it right! Practical PSFT PPM UKOUG2008 www.go-faster.co.uk 12
PeopleTools Performance Utilities Instrumentation in PeopleTools 8.4 – Query Statistics 8.44, usable from 8.45 – PeopleSoft Ping 8.42, back-ported to 8.19 – Performance Monitor 8.44 Practical PSFT PPM UKOUG2008 www.go-faster.co.uk 13
Performance Monitor PeopleTools 8.44 – Fully instrumented – Including a timed-event interface – Event 10046 for the application – Useful PeopleBook – Additional analytics in PT8.45 Practical PSFT PPM UKOUG2008 www.go-faster.co.uk 14
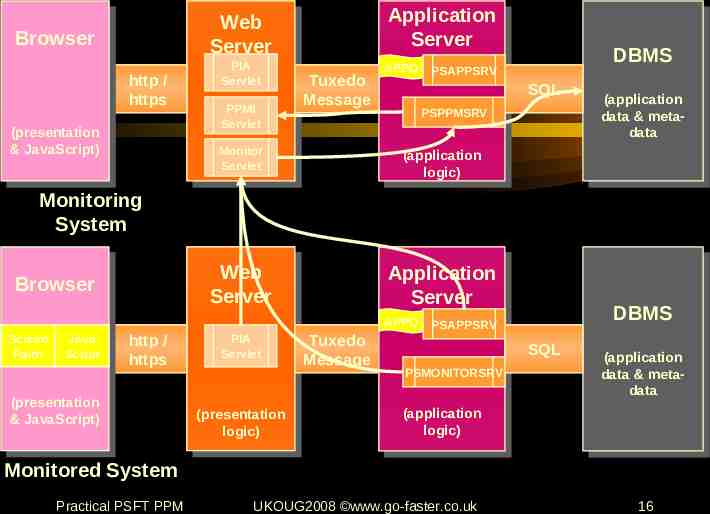
Performance Monitor Architecture Based upon existing PeopleSoft technology Monitored System – Send information to servlet in monitoring system Monitoring System – Monitor servlet writes results to database via PSPPMSRV process in application server Ideally PeopleTools only system database This minimises measurement intrusion effect Practical PSFT PPM UKOUG2008 www.go-faster.co.uk 15
Application Application Server Server Web Web Server Server Browser Browser http / https (presentation (presentation &&JavaScript) JavaScript) PIA Servlet PPMI Servlet Tuxedo Message APPQ DBMS DBMS PSAPPSRV SQL PSPPMSRV Monitor Servlet (application (application logic) logic) Web Web Server Server Application Application Server Server (application (application data data&&metametadata data Monitoring System Browser Browser APPQ Screen Paint Java Script http / https (presentation (presentation &&JavaScript) JavaScript) PIA Servlet (presentation (presentation logic) logic) Tuxedo Message DBMS DBMS PSAPPSRV SQL PSMONITORSRV (application (application data data&&metametadata data (application (application logic) logic) Monitored System Practical PSFT PPM UKOUG2008 www.go-faster.co.uk 16
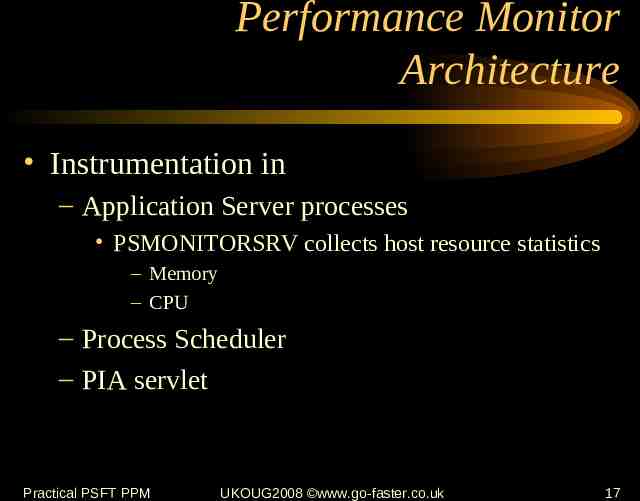
Performance Monitor Architecture Instrumentation in – Application Server processes PSMONITORSRV collects host resource statistics – Memory – CPU – Process Scheduler – PIA servlet Practical PSFT PPM UKOUG2008 www.go-faster.co.uk 17
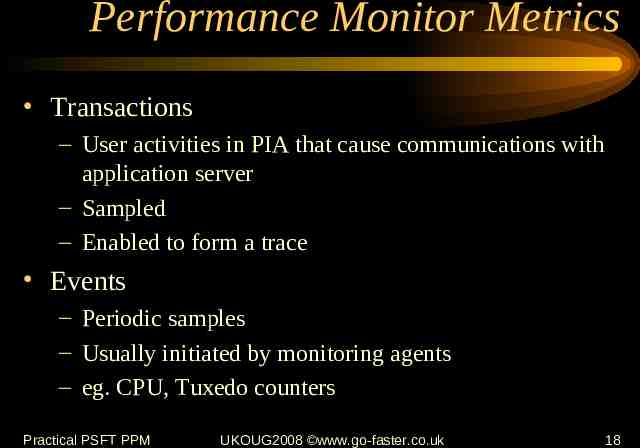
Performance Monitor Metrics Transactions – User activities in PIA that cause communications with application server – Sampled – Enabled to form a trace Events – Periodic samples – Usually initiated by monitoring agents – eg. CPU, Tuxedo counters Practical PSFT PPM UKOUG2008 www.go-faster.co.uk 18
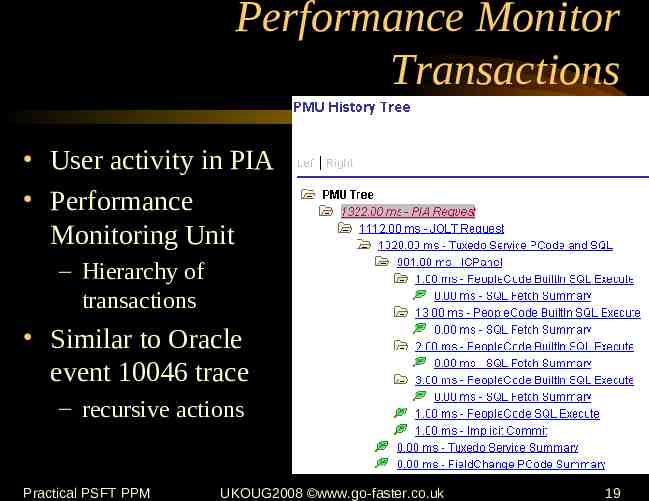
Performance Monitor Transactions User activity in PIA Performance Monitoring Unit – Hierarchy of transactions Similar to Oracle event 10046 trace – recursive actions Practical PSFT PPM UKOUG2008 www.go-faster.co.uk 19
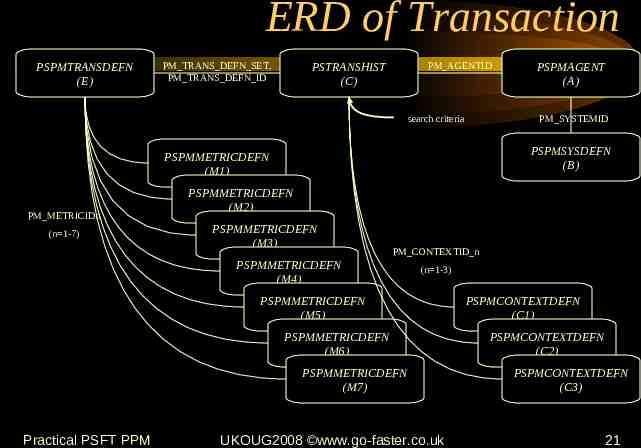
Transactions Stored to PSPMTRANSCURR table – As PMUs are closed moved to PSPMTRANSHIST – Later deleted or archived to PSPMTRANSARCH ERD downloadable from Customer Connection Practical PSFT PPM UKOUG2008 www.go-faster.co.uk 20
ERD of Transaction PSPMTRANSDEFN (E) PM TRANS DEFN SET, PM TRANS DEFN ID PM AGENTID PSTRANSHIST (C) search criteria PM SYSTEMID PSPMSYSDEFN (B) PSPMMETRICDEFN (M1) PM METRICIDn (n 1-7) PSPMMETRICDEFN (M2) PSPMMETRICDEFN (M3) PM CONTEXTID n PSPMMETRICDEFN (M4) (n 1-3) PSPMMETRICDEFN (M5) PSPMMETRICDEFN (M6) PSPMMETRICDEFN (M7) Practical PSFT PPM PSPMAGENT (A) UKOUG2008 www.go-faster.co.uk PSPMCONTEXTDEFN (C1) PSPMCONTEXTDEFN (C2) PSPMCONTEXTDEFN (C3) 21
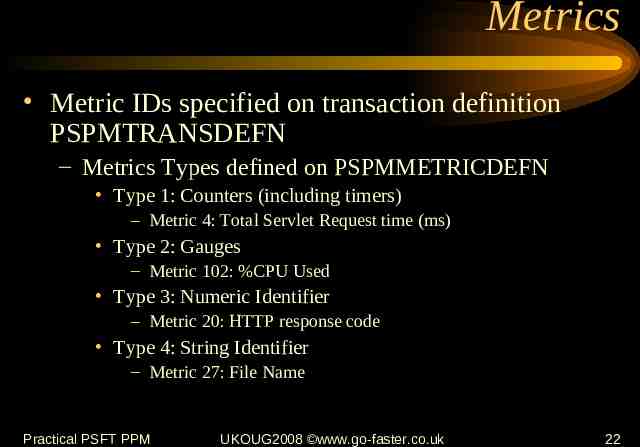
Metrics Metric IDs specified on transaction definition PSPMTRANSDEFN – Metrics Types defined on PSPMMETRICDEFN Type 1: Counters (including timers) – Metric 4: Total Servlet Request time (ms) Type 2: Gauges – Metric 102: %CPU Used Type 3: Numeric Identifier – Metric 20: HTTP response code Type 4: String Identifier – Metric 27: File Name Practical PSFT PPM UKOUG2008 www.go-faster.co.uk 22
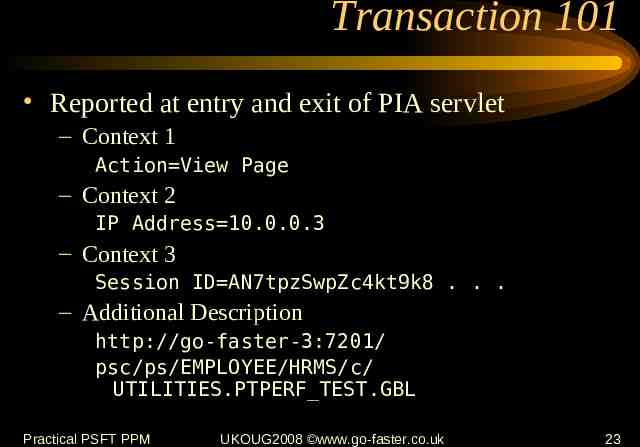
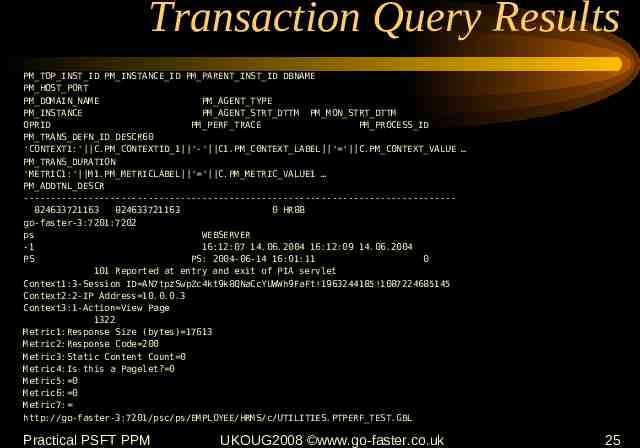
Transaction 101 Reported at entry and exit of PIA servlet – Context 1 Action View Page – Context 2 IP Address 10.0.0.3 – Context 3 Session ID AN7tpzSwpZc4kt9k8 . . . – Additional Description http://go-faster-3:7201/ psc/ps/EMPLOYEE/HRMS/c/ UTILITIES.PTPERF TEST.GBL Practical PSFT PPM UKOUG2008 www.go-faster.co.uk 23
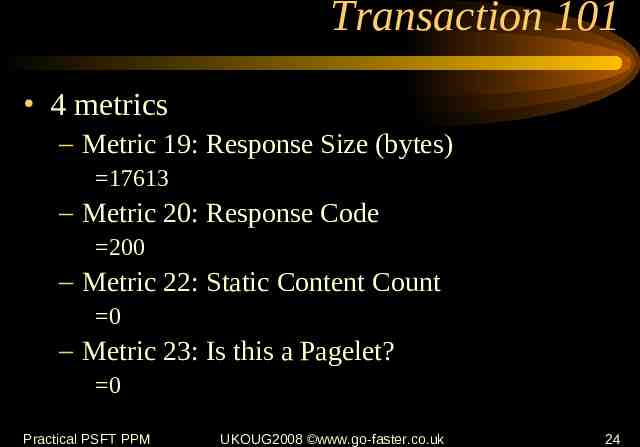
Transaction 101 4 metrics – Metric 19: Response Size (bytes) 17613 – Metric 20: Response Code 200 – Metric 22: Static Content Count 0 – Metric 23: Is this a Pagelet? 0 Practical PSFT PPM UKOUG2008 www.go-faster.co.uk 24
Transaction Query Results PM TOP INST ID PM INSTANCE ID PM PARENT INST ID DBNAME PM HOST PORT PM DOMAIN NAME PM AGENT TYPE PM INSTANCE PM AGENT STRT DTTM PM MON STRT DTTM OPRID PM PERF TRACE PM PROCESS ID PM TRANS DEFN ID DESCR60 'CONTEXT1:' C.PM CONTEXTID 1 '-' C1.PM CONTEXT LABEL ' ' C.PM CONTEXT VALUE PM TRANS DURATION 'METRIC1:' M1.PM METRICLABEL ' ' C.PM METRIC VALUE1 PM ADDTNL DESCR -------------------------------------------------------------------------------824633721163 824633721163 0 HR88 go-faster-3:7201:7202 ps WEBSERVER -1 16:12:07 14.06.2004 16:12:09 14.06.2004 PS PS: 2004-06-14 16:01:11 0 101 Reported at entry and exit of PIA servlet Context1:3-Session ID AN7tpzSwpZc4kt9k8QNaCcYUWWh9FaFt!1963244185!1087224685145 Context2:2-IP Address 10.0.0.3 Context3:1-Action View Page 1322 Metric1:Response Size (bytes) 17613 Metric2:Response Code 200 Metric3:Static Content Count 0 Metric4:Is this a Pagelet? 0 Metric5: 0 Metric6: 0 Metric7: http://go-faster-3:7201/psc/ps/EMPLOYEE/HRMS/c/UTILITIES.PTPERF TEST.GBL Practical PSFT PPM UKOUG2008 www.go-faster.co.uk 25
Events Certain events are defined for which the monitor agents collect metrics – Regular cycle Host resources – In response to user action PeopleSoft Ping – On an exception Jolt Exception or Query Timeout Practical PSFT PPM UKOUG2008 www.go-faster.co.uk 26
Events Do not have an explicit context – Collecting agent provide context Stored in PSPMEVENTHIST – Later deleted or archived to PSPMEVETARCH Practical PSFT PPM UKOUG2008 www.go-faster.co.uk 27
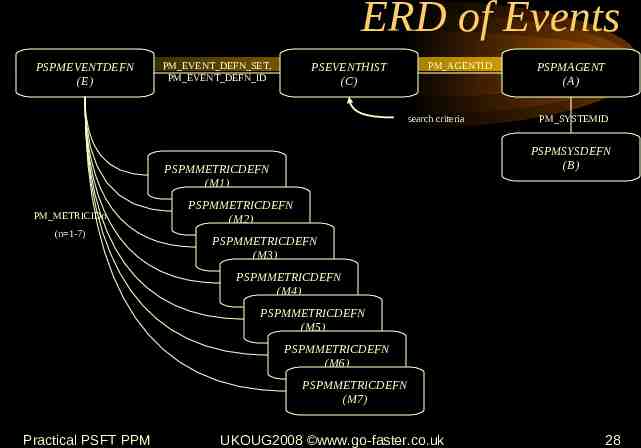
ERD of Events PSPMEVENTDEFN (E) PM EVENT DEFN SET, PM EVENT DEFN ID PSEVENTHIST (C) PM AGENTID search criteria (n 1-7) PM SYSTEMID PSPMSYSDEFN (B) PSPMMETRICDEFN (M1) PM METRICIDn PSPMAGENT (A) PSPMMETRICDEFN (M2) PSPMMETRICDEFN (M3) PSPMMETRICDEFN (M4) PSPMMETRICDEFN (M5) PSPMMETRICDEFN (M6) PSPMMETRICDEFN (M7) Practical PSFT PPM UKOUG2008 www.go-faster.co.uk 28
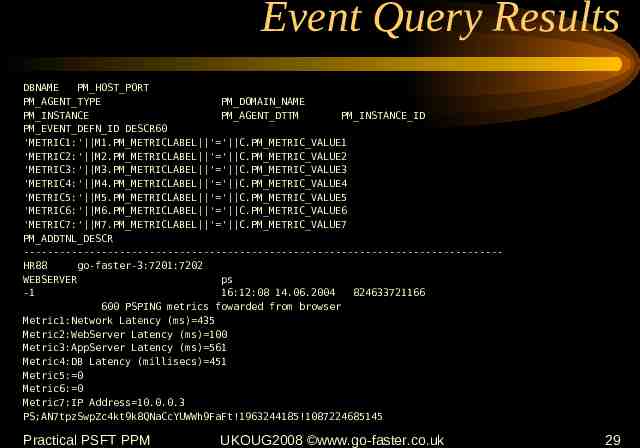
Event Query Results DBNAME PM HOST PORT PM AGENT TYPE PM DOMAIN NAME PM INSTANCE PM AGENT DTTM PM INSTANCE ID PM EVENT DEFN ID DESCR60 'METRIC1:' M1.PM METRICLABEL ' ' C.PM METRIC VALUE1 'METRIC2:' M2.PM METRICLABEL ' ' C.PM METRIC VALUE2 'METRIC3:' M3.PM METRICLABEL ' ' C.PM METRIC VALUE3 'METRIC4:' M4.PM METRICLABEL ' ' C.PM METRIC VALUE4 'METRIC5:' M5.PM METRICLABEL ' ' C.PM METRIC VALUE5 'METRIC6:' M6.PM METRICLABEL ' ' C.PM METRIC VALUE6 'METRIC7:' M7.PM METRICLABEL ' ' C.PM METRIC VALUE7 PM ADDTNL DESCR -------------------------------------------------------------------------------HR88 go-faster-3:7201:7202 WEBSERVER ps -1 16:12:08 14.06.2004 824633721166 600 PSPING metrics fowarded from browser Metric1:Network Latency (ms) 435 Metric2:WebServer Latency (ms) 100 Metric3:AppServer Latency (ms) 561 Metric4:DB Latency (millisecs) 451 Metric5: 0 Metric6: 0 Metric7:IP Address 10.0.0.3 PS;AN7tpzSwpZc4kt9k8QNaCcYUWWh9FaFt!1963244185!1087224685145 Practical PSFT PPM UKOUG2008 www.go-faster.co.uk 29
Using PeopleSoft Performance Monitor Bugs & Fixes Performance Tuning the Performance Monitor Purge Process Performance Trace Demo Network Latency Practical PSFT PPM UKOUG2008 www.go-faster.co.uk 30
Bugs and Fixes Ports left in CLOSE WAIT on Monitored System – Until Unix/Linux runs out of ports Windows doesn’t have a limit on number of ports – ‘Application Server is Down’ message Affects PT8.49 – From at least 8.49.06 – Fixed in 8.49.15 Practical PSFT PPM UKOUG2008 www.go-faster.co.uk 31
Tuning Performance Monitor Some of the delivered analytics do not perform well with even moderate data volumes – Set up the monitoring system to self monitor – Then you can generate PPM traces on the analytics – You will need additional indexes http://blog.psftdba.com/2006/04/performancetuning-performance-monitor.html (YMMV) Practical PSFT PPM UKOUG2008 www.go-faster.co.uk 32
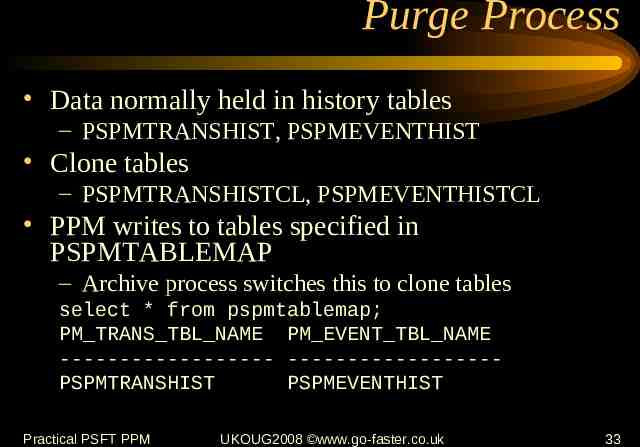
Purge Process Data normally held in history tables – PSPMTRANSHIST, PSPMEVENTHIST Clone tables – PSPMTRANSHISTCL, PSPMEVENTHISTCL PPM writes to tables specified in PSPMTABLEMAP – Archive process switches this to clone tables select * from pspmtablemap; PM TRANS TBL NAME PM EVENT TBL NAME ------------------ -----------------PSPMTRANSHIST PSPMEVENTHIST Practical PSFT PPM UKOUG2008 www.go-faster.co.uk 33
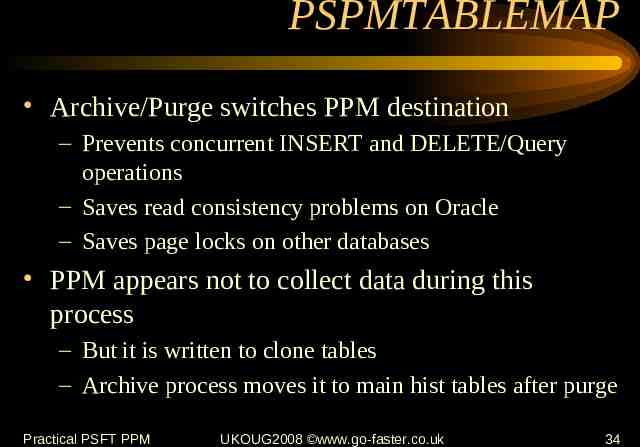
PSPMTABLEMAP Archive/Purge switches PPM destination – Prevents concurrent INSERT and DELETE/Query operations – Saves read consistency problems on Oracle – Saves page locks on other databases PPM appears not to collect data during this process – But it is written to clone tables – Archive process moves it to main hist tables after purge Practical PSFT PPM UKOUG2008 www.go-faster.co.uk 34
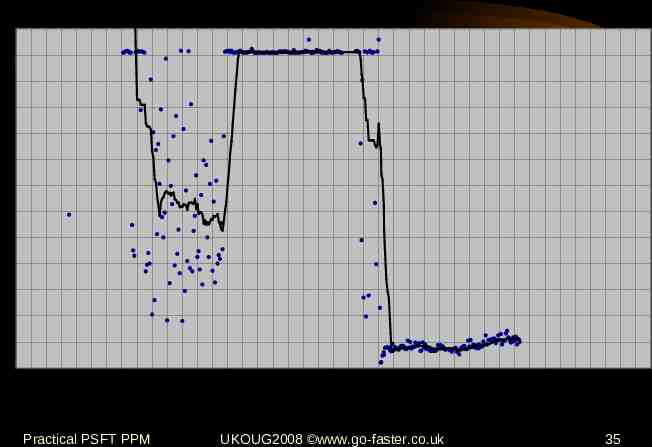
PSPMARCH Job Duration 2:00 Duration 1:30 1:00 0:30 0:00 Sun 1.6.08 Sun 8.6.08 Sun 15.6.08 Sun 22.6.08 Sun 29.6.08 Sun 6.7.08 Sun 13.7.08 Start Date Practical PSFT PPM UKOUG2008 www.go-faster.co.uk 35
Purge Process Can’t Keep Up Platform generic query leads to full scan – Even if data has been deleted (manually) high water marks (HWM) on tables not reset Customisation – Oracle specific statement – May need to rebuild HIST tables to reset HWM In which case manually set PSPMTABLEMAP to clones, rebuild history tables, run archive process Practical PSFT PPM UKOUG2008 www.go-faster.co.uk 36
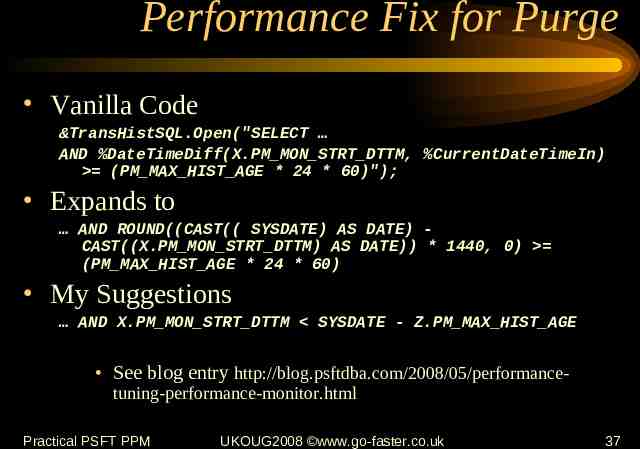
Performance Fix for Purge Vanilla Code &TransHistSQL.Open("SELECT AND %DateTimeDiff(X.PM MON STRT DTTM, %CurrentDateTimeIn) (PM MAX HIST AGE * 24 * 60)"); Expands to AND ROUND((CAST(( SYSDATE) AS DATE) CAST((X.PM MON STRT DTTM) AS DATE)) * 1440, 0) (PM MAX HIST AGE * 24 * 60) My Suggestions AND X.PM MON STRT DTTM SYSDATE - Z.PM MAX HIST AGE See blog entry http://blog.psftdba.com/2008/05/performancetuning-performance-monitor.html Practical PSFT PPM UKOUG2008 www.go-faster.co.uk 37
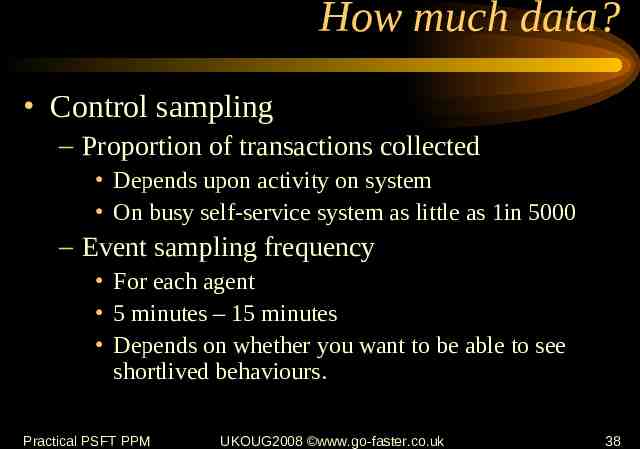
How much data? Control sampling – Proportion of transactions collected Depends upon activity on system On busy self-service system as little as 1in 5000 – Event sampling frequency For each agent 5 minutes – 15 minutes Depends on whether you want to be able to see shortlived behaviours. Practical PSFT PPM UKOUG2008 www.go-faster.co.uk 38
Practical PSFT PPM UKOUG2008 www.go-faster.co.uk 39
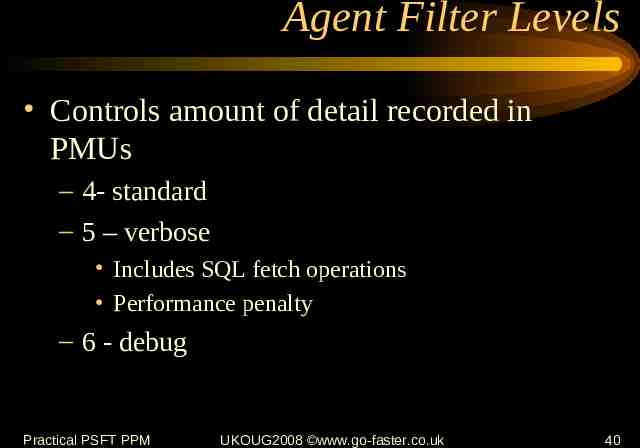
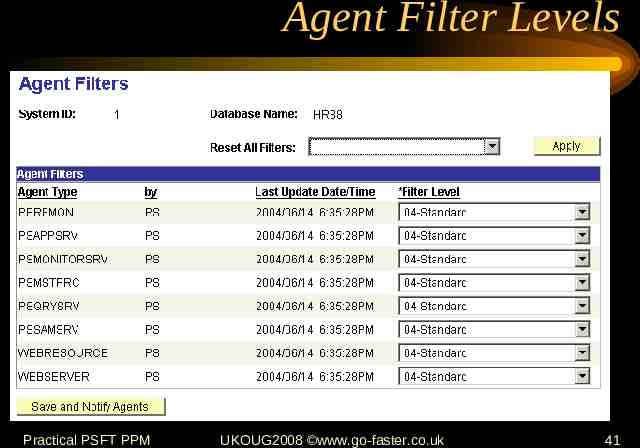
Agent Filter Levels Controls amount of detail recorded in PMUs – 4- standard – 5 – verbose Includes SQL fetch operations Performance penalty – 6 - debug Practical PSFT PPM UKOUG2008 www.go-faster.co.uk 40
Agent Filter Levels Practical PSFT PPM UKOUG2008 www.go-faster.co.uk 41
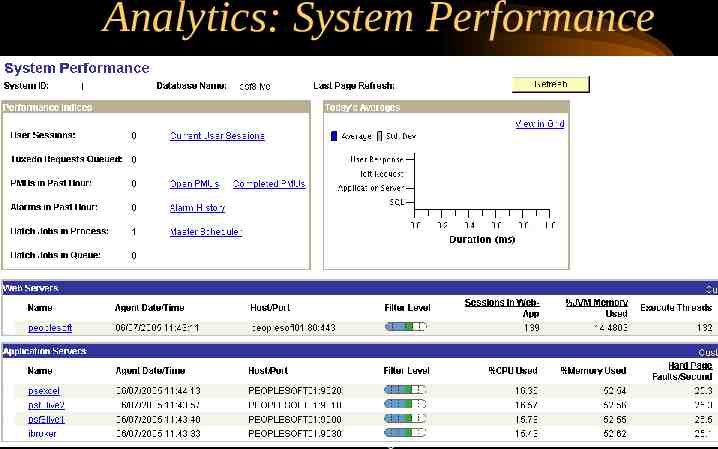
Analytics: System Performance Practical PSFT PPM UKOUG2008 www.go-faster.co.uk 42
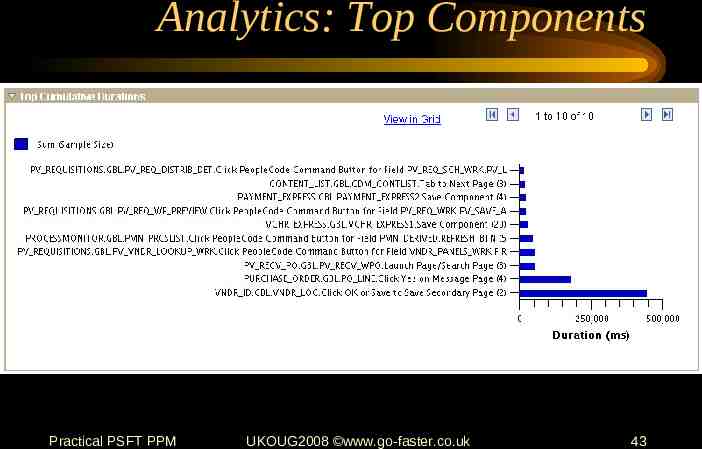
Analytics: Top Components Practical PSFT PPM UKOUG2008 www.go-faster.co.uk 43
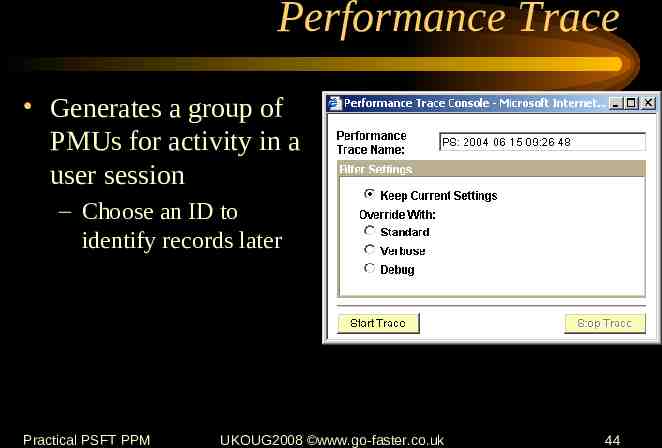
Performance Trace Generates a group of PMUs for activity in a user session – Choose an ID to identify records later Practical PSFT PPM UKOUG2008 www.go-faster.co.uk 44
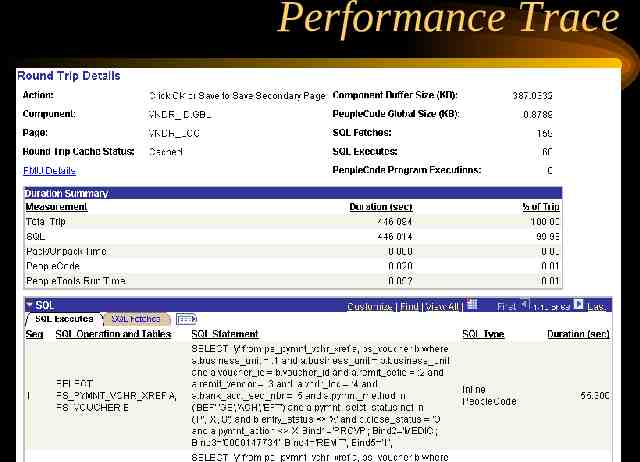
Performance Trace Practical PSFT PPM UKOUG2008 www.go-faster.co.uk 45
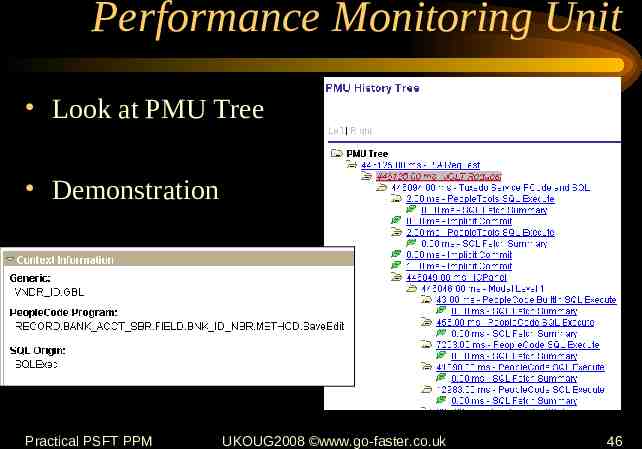
Performance Monitoring Unit Look at PMU Tree Demonstration Practical PSFT PPM UKOUG2008 www.go-faster.co.uk 46
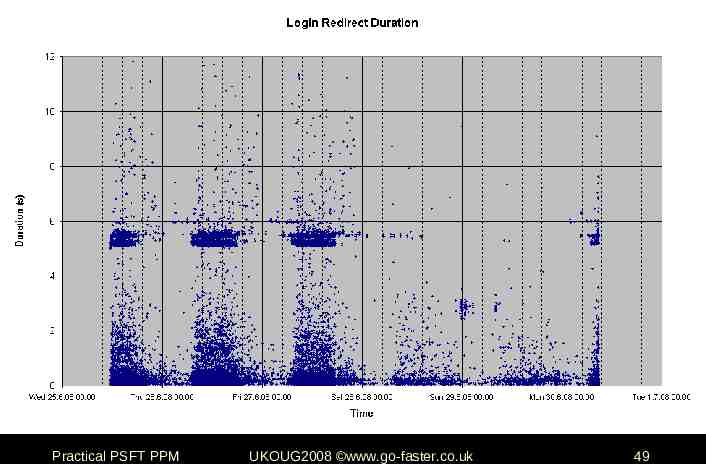
Network Latency Most transactions are sampled But three transactions are always recorded See PMTRANSDEFN.PM SAMPLING ENABLE – 108: User Session logout, expiration, timeout, or error – 109: User Session began (user logged in) – 116: Redirected round trip time (network latency) Practical PSFT PPM UKOUG2008 www.go-faster.co.uk 47
Transaction 116 Network round trip from webserver to browser and back again – Includes network transmission time – Browser response time – Client IP address Although that could be load balancer or NAT – Operator ID LOCATION from HR database? Practical PSFT PPM UKOUG2008 www.go-faster.co.uk 48
Practical PSFT PPM UKOUG2008 www.go-faster.co.uk 49
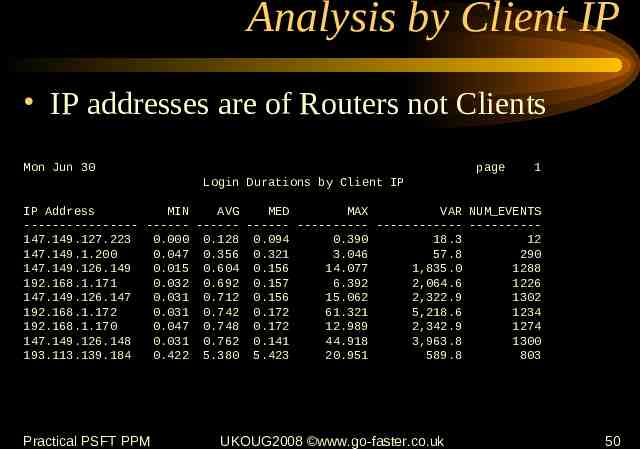
Analysis by Client IP IP addresses are of Routers not Clients Mon Jun 30 page 1 Login Durations by Client IP IP Address MIN AVG MED MAX VAR NUM EVENTS ---------------- ------ ------ ------ ---------- ------------ ---------147.149.127.223 0.000 0.128 0.094 0.390 18.3 12 147.149.1.200 0.047 0.356 0.321 3.046 57.8 290 147.149.126.149 0.015 0.604 0.156 14.077 1,835.0 1288 192.168.1.171 0.032 0.692 0.157 6.392 2,064.6 1226 147.149.126.147 0.031 0.712 0.156 15.062 2,322.9 1302 192.168.1.172 0.031 0.742 0.172 61.321 5,218.6 1234 192.168.1.170 0.047 0.748 0.172 12.989 2,342.9 1274 147.149.126.148 0.031 0.762 0.141 44.918 3,963.8 1300 193.113.139.184 0.422 5.380 5.423 20.951 589.8 803 Practical PSFT PPM UKOUG2008 www.go-faster.co.uk 50
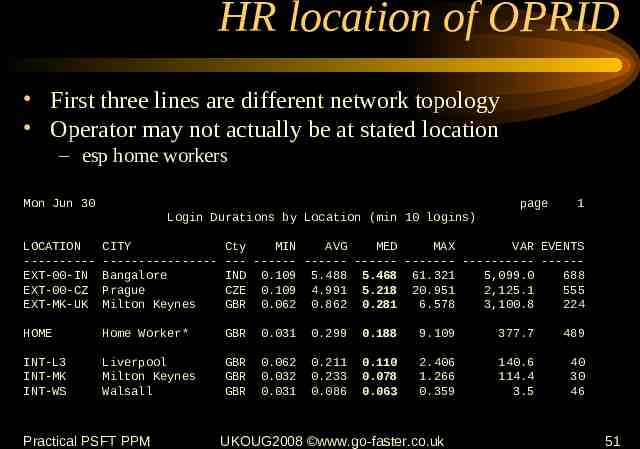
HR location of OPRID First three lines are different network topology Operator may not actually be at stated location – esp home workers Mon Jun 30 page 1 Login Durations by Location (min 10 logins) LOCATION ---------EXT-00-IN EXT-00-CZ EXT-MK-UK CITY ---------------Bangalore Prague Milton Keynes Cty MIN AVG MED MAX VAR EVENTS --- ------ ------ ------ ------- ---------- -----IND 0.109 5.488 5.468 61.321 5,099.0 688 CZE 0.109 4.991 5.218 20.951 2,125.1 555 GBR 0.062 0.862 0.281 6.578 3,100.8 224 HOME Home Worker* GBR 0.031 0.299 0.188 9.109 377.7 489 INT-L3 INT-MK INT-WS Liverpool Milton Keynes Walsall GBR GBR GBR 0.062 0.032 0.031 0.211 0.233 0.086 0.110 0.078 0.063 2.406 1.266 0.359 140.6 114.4 3.5 40 30 46 Practical PSFT PPM UKOUG2008 www.go-faster.co.uk 51
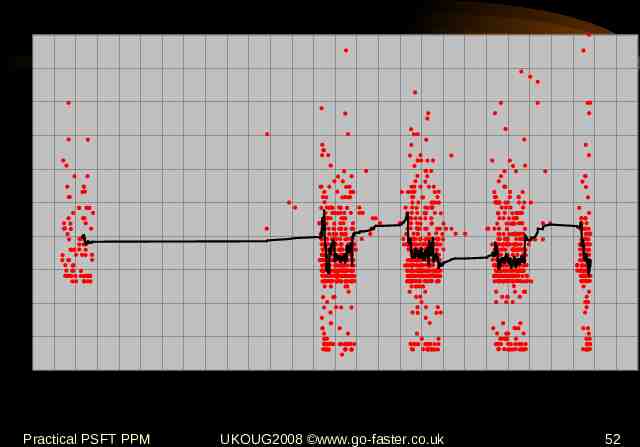
Login Redirect Duration 1 0.9 0.8 0.7 Duration (s) 0.6 0.5 0.4 0.3 0.2 0.1 0 Fri 27.6.08 00:00 Sat 28.6.08 00:00 Sun 29.6.08 00:00 Mon 30.6.08 00:00 Tue 1.7.08 00:00 Wed 2.7.08 00:00 Thu 3.7.08 00:00 Fri 4.7.08 00:00 Time Practical PSFT PPM UKOUG2008 www.go-faster.co.uk 52
Summary Very impressive feature rich piece of code – It could also put me out of business! In house support tool – An end user could be enabled to collect a performance trace. Practical PSFT PPM UKOUG2008 www.go-faster.co.uk 53
My Questions Will Fusion have a Performance Monitor? – I think it should Will it be separately licensed product? – PeopleSoft’s performance monitor isn’t Practical PSFT PPM UKOUG2008 www.go-faster.co.uk 54
Your Questions?
Practical Guidance on the Use of PeopleSoft Performance Monitor David Kurtz Go-Faster Consultancy Ltd. [email protected] www.go-faster.co.uk Practical PSFT PPM UKOUG2008 www.go-faster.co.uk 56