Essex EC248-2-SP Lecture 7 Commercial Banking and Risk


25 Slides183.50 KB
Essex EC248-2-SP Lecture 7 Commercial Banking and Risk Management Alexander Mihailov, 28/02/06
Plan of Talk 1. 2. 3. 4. Introduction Commercial Banking as a Business Bank Performance and Risk Management Asset/Liability Management Liquidity Management Wrap-up 7-2
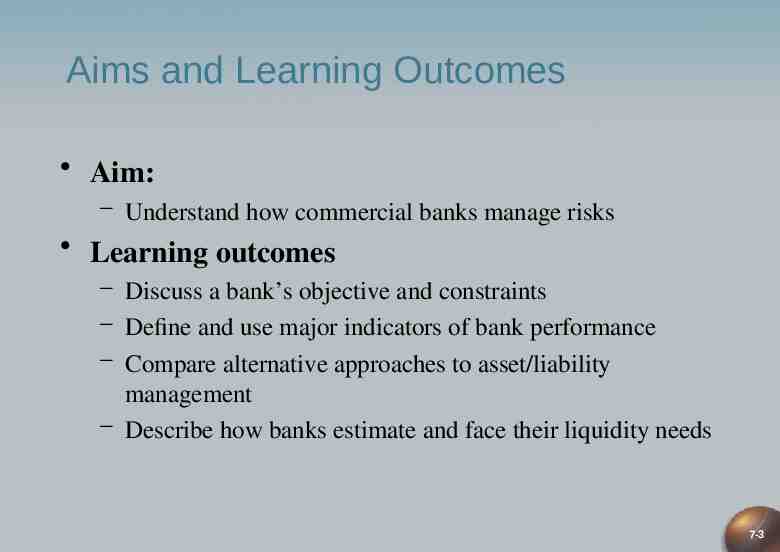
Aims and Learning Outcomes Aim: – Understand how commercial banks manage risks Learning outcomes – Discuss a bank’s objective and constraints – Define and use major indicators of bank performance – Compare alternative approaches to asset/liability management – Describe how banks estimate and face their liquidity needs 7-3
(Commercial) Banking as a Business Banks are private firms with a public purpose – objective maximize shareholder wealth market value of bank stock and dividends paid depends on 3 factors – amount of cash flow – timing of cash flow – risk of cash flow – constraints: 3 types market (competition and growth): most failures during economic distress social (functions): e.g. promote economic development and quality of life legal and regulatory: e.g. the risk/return position in portfolio management Banking is the management of risk: by taking risks, banks earn a profit - credit risk - foreign exchange risk - interest rate risk - compliance risk - liquidity risk - strategic risk - price risk - reputation risk 7-4
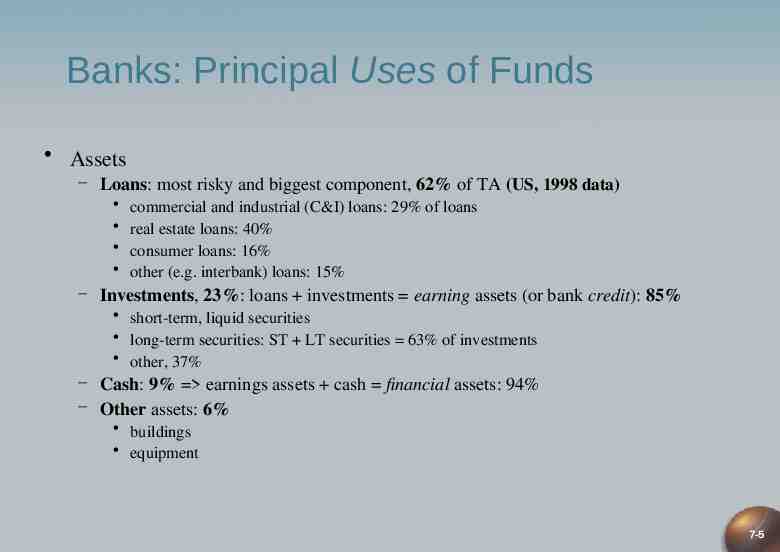
Banks: Principal Uses of Funds Assets – Loans: most risky and biggest component, 62% of TA (US, 1998 data) commercial and industrial (C&I) loans: 29% of loans real estate loans: 40% consumer loans: 16% other (e.g. interbank) loans: 15% – Investments, 23%: loans investments earning assets (or bank credit): 85% short-term, liquid securities long-term securities: ST LT securities 63% of investments other, 37% – Cash: 9% earnings assets cash financial assets: 94% – Other assets: 6% buildings equipment 7-5
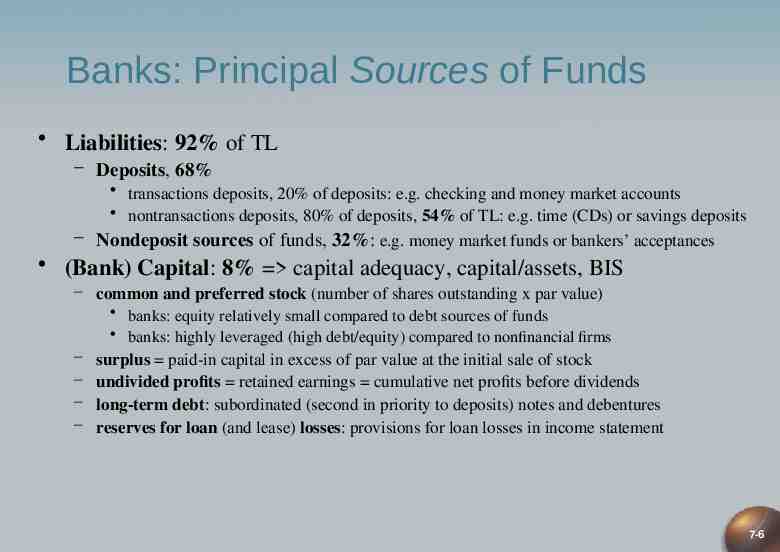
Banks: Principal Sources of Funds Liabilities: 92% of TL – Deposits, 68% transactions deposits, 20% of deposits: e.g. checking and money market accounts nontransactions deposits, 80% of deposits, 54% of TL: e.g. time (CDs) or savings deposits – Nondeposit sources of funds, 32%: e.g. money market funds or bankers’ acceptances (Bank) Capital: 8% capital adequacy, capital/assets, BIS – common and preferred stock (number of shares outstanding x par value) banks: equity relatively small compared to debt sources of funds banks: highly leveraged (high debt/equity) compared to nonfinancial firms – – – – surplus paid-in capital in excess of par value at the initial sale of stock undivided profits retained earnings cumulative net profits before dividends long-term debt: subordinated (second in priority to deposits) notes and debentures reserves for loan (and lease) losses: provisions for loan losses in income statement 7-6
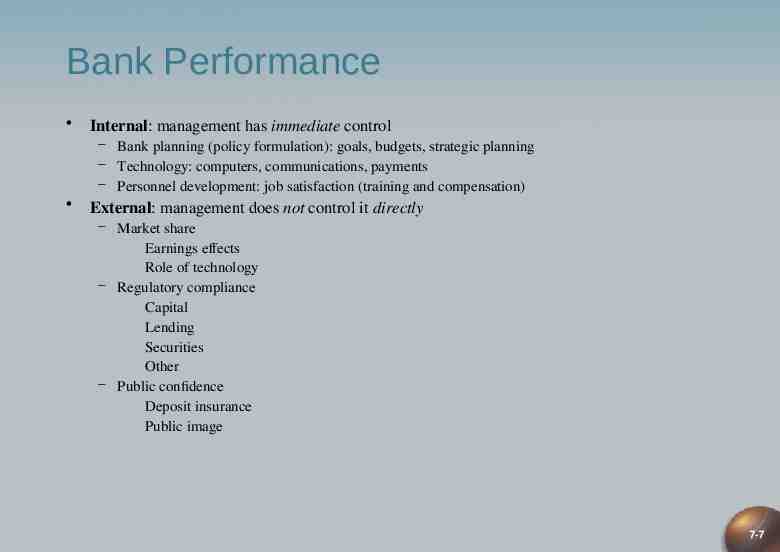
Bank Performance Internal: management has immediate control – Bank planning (policy formulation): goals, budgets, strategic planning – Technology: computers, communications, payments – Personnel development: job satisfaction (training and compensation) External: management does not control it directly – Market share Earnings effects Role of technology – Regulatory compliance Capital Lending Securities Other – Public confidence Deposit insurance Public image 7-7
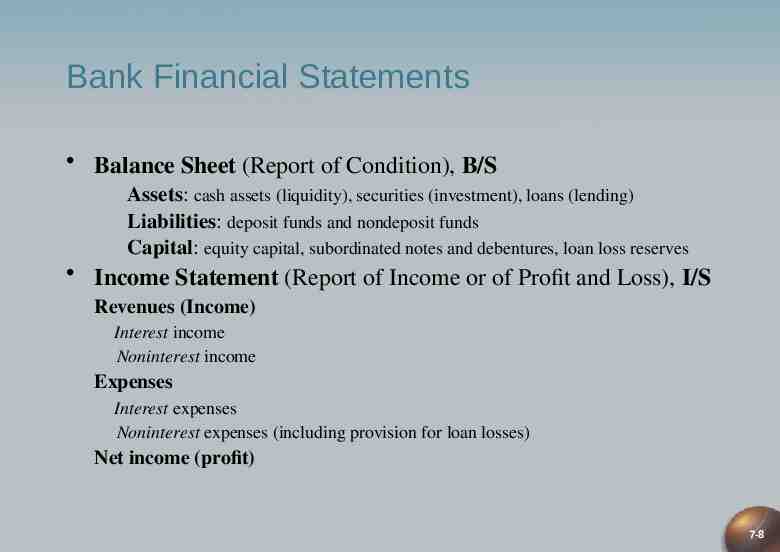
Bank Financial Statements Balance Sheet (Report of Condition), B/S Assets: cash assets (liquidity), securities (investment), loans (lending) Liabilities: deposit funds and nondeposit funds Capital: equity capital, subordinated notes and debentures, loan loss reserves Income Statement (Report of Income or of Profit and Loss), I/S Revenues (Income) Interest income Noninterest income Expenses Interest expenses Noninterest expenses (including provision for loan losses) Net income (profit) 7-8
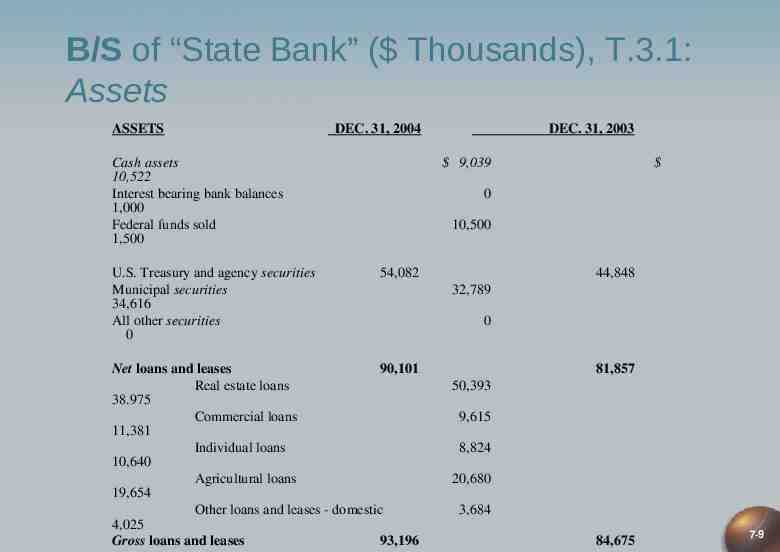
B/S of “State Bank” ( Thousands), T.3.1: Assets ASSETS DEC. 31, 2004 Cash assets 10,522 Interest bearing bank balances 1,000 Federal funds sold 1,500 U.S. Treasury and agency securities Municipal securities 34,616 All other securities 0 DEC. 31, 2003 9,039 0 10,500 54,082 Net loans and leases 90,101 Real estate loans 38.975 Commercial loans 11,381 Individual loans 10,640 Agricultural loans 19,654 Other loans and leases - domestic 4,025 Gross loans and leases 93,196 44,848 32,789 0 81,857 50,393 9,615 8,824 20,680 3,684 84,675 7-9
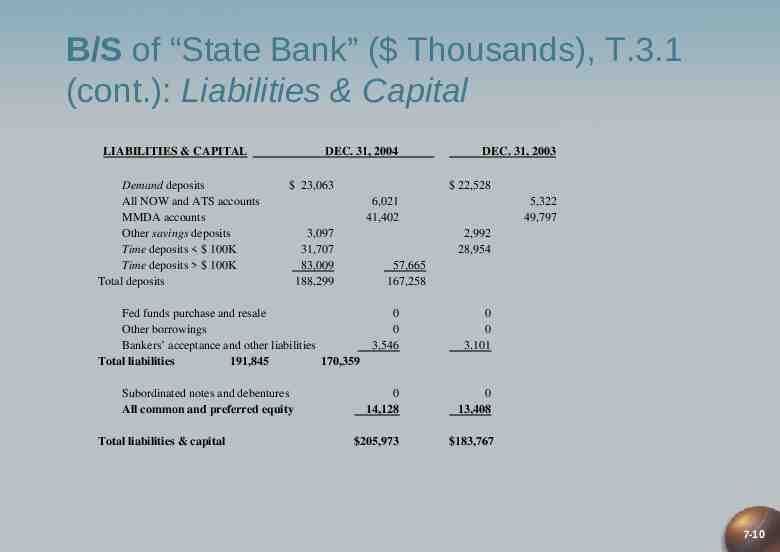
B/S of “State Bank” ( Thousands), T.3.1 (cont.): Liabilities & Capital LIABILITIES & CAPITAL Demand deposits All NOW and ATS accounts MMDA accounts Other savings deposits Time deposits 100K Time deposits 100K Total deposits DEC. 31, 2004 23,063 22,528 6,021 41,402 3,097 31,707 83,009 188,299 Total liabilities & capital 5,322 49,797 2,992 28,954 57,665 167,258 Fed funds purchase and resale Other borrowings Bankers’ acceptance and other liabilities Total liabilities 191,845 170,359 Subordinated notes and debentures All common and preferred equity DEC. 31, 2003 0 0 3,546 0 0 3,101 0 14,128 0 13,408 205,973 183,767 7-10
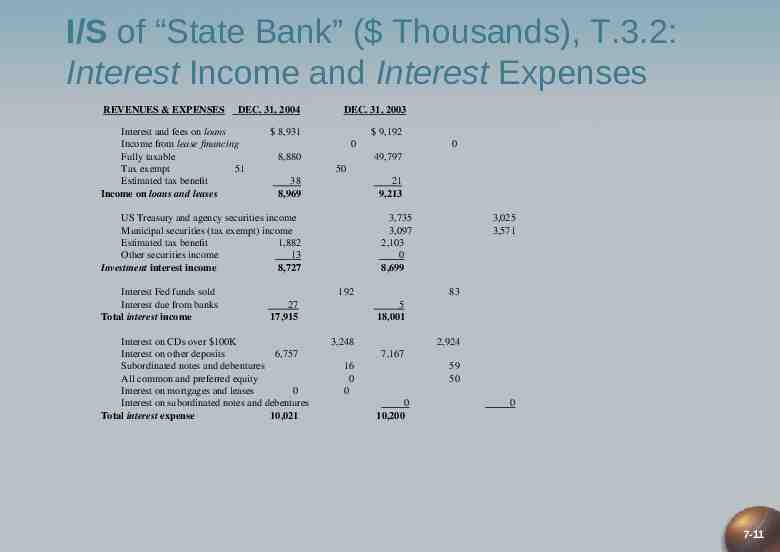
I/S of “State Bank” ( Thousands), T.3.2: Interest Income and Interest Expenses REVENUES & EXPENSES DEC. 31, 2004 Interest and fees on loans Income from lease financing Fully taxable Tax exempt 51 Estimated tax benefit Income on loans and leases DEC. 31, 2003 8,931 9,192 0 8,880 50 38 8,969 21 9,213 US Treasury and agency securities income Municipal securities (tax exempt) income Estimated tax benefit 1,882 Other securities income 13 Investment interest income 8,727 Interest Fed funds sold Interest due from banks Total interest income 0 49,797 3,735 3,097 2,103 0 8,699 192 27 17,915 Interest on CDs over 100K Interest on other deposits 6,757 Subordinated notes and debentures All common and preferred equity Interest on mortgages and leases 0 Interest on subordinated notes and debentures Total interest expense 10,021 3,025 3,571 83 5 18,001 3,248 2,924 7,167 16 0 0 59 50 0 10,200 0 7-11
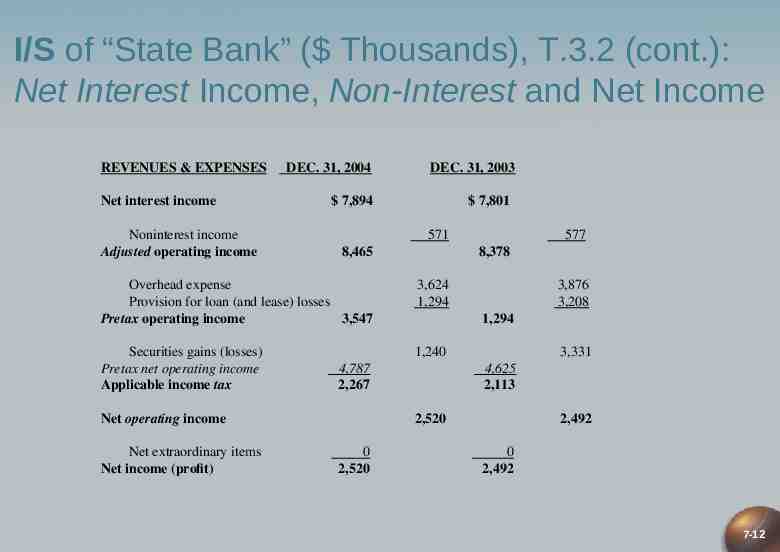
I/S of “State Bank” ( Thousands), T.3.2 (cont.): Net Interest Income, Non-Interest and Net Income REVENUES & EXPENSES Net interest income Noninterest income Adjusted operating income DEC. 31, 2004 DEC. 31, 2003 7,894 7,801 571 8,465 8,378 Overhead expense Provision for loan (and lease) losses Pretax operating income 3,547 3,624 1,294 Securities gains (losses) Pretax net operating income Applicable income tax 1,240 Net extraordinary items Net income (profit) 3,876 3,208 1,294 4,787 2,267 Net operating income 577 3,331 4,625 2,113 2,520 0 2,520 2,492 0 2,492 7-12
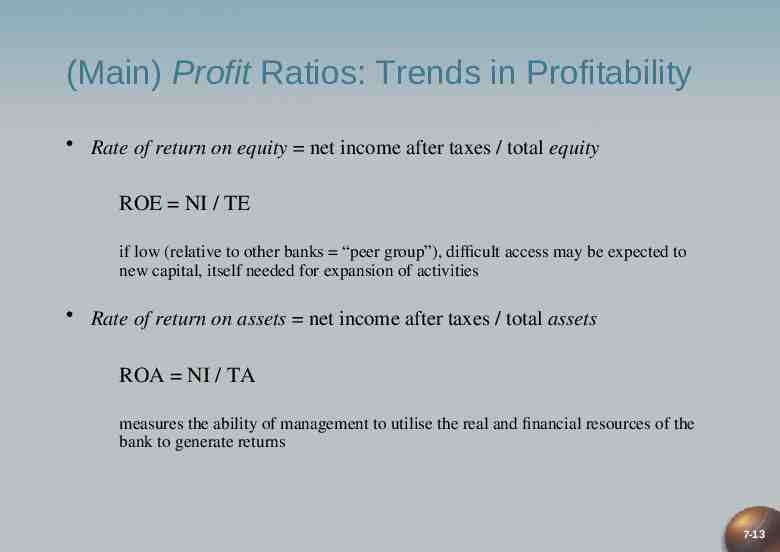
(Main) Profit Ratios: Trends in Profitability Rate of return on equity net income after taxes / total equity ROE NI / TE if low (relative to other banks “peer group”), difficult access may be expected to new capital, itself needed for expansion of activities Rate of return on assets net income after taxes / total assets ROA NI / TA measures the ability of management to utilise the real and financial resources of the bank to generate returns 7-13
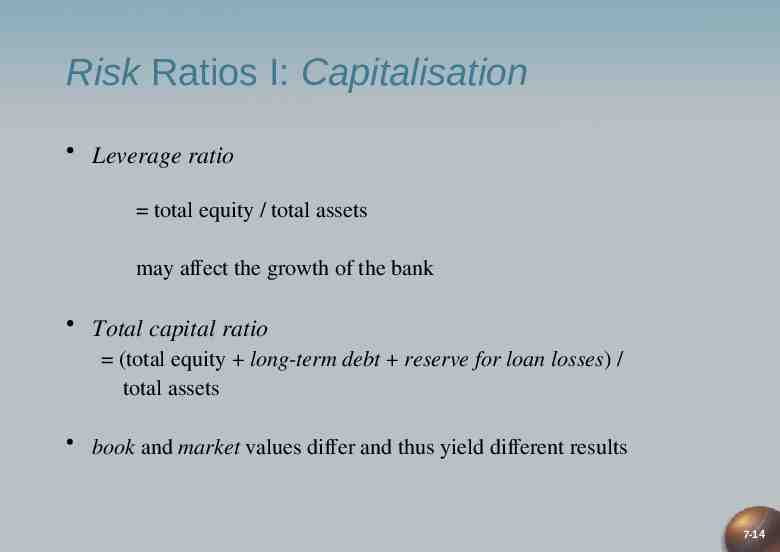
Risk Ratios I: Capitalisation Leverage ratio total equity / total assets may affect the growth of the bank Total capital ratio (total equity long-term debt reserve for loan losses) / total assets book and market values differ and thus yield different results 7-14
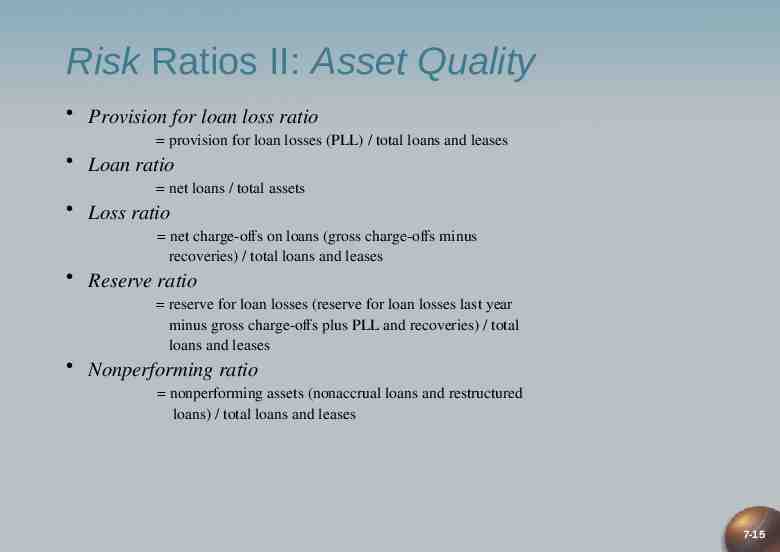
Risk Ratios II: Asset Quality Provision for loan loss ratio provision for loan losses (PLL) / total loans and leases Loan ratio net loans / total assets Loss ratio net charge-offs on loans (gross charge-offs minus recoveries) / total loans and leases Reserve ratio reserve for loan losses (reserve for loan losses last year minus gross charge-offs plus PLL and recoveries) / total loans and leases Nonperforming ratio nonperforming assets (nonaccrual loans and restructured loans) / total loans and leases 7-15
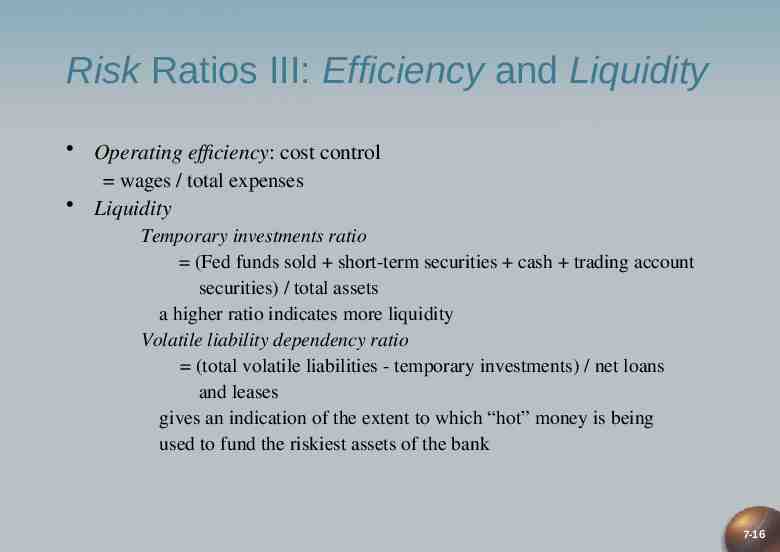
Risk Ratios III: Efficiency and Liquidity Operating efficiency: cost control wages / total expenses Liquidity Temporary investments ratio (Fed funds sold short-term securities cash trading account securities) / total assets a higher ratio indicates more liquidity Volatile liability dependency ratio (total volatile liabilities - temporary investments) / net loans and leases gives an indication of the extent to which “hot” money is being used to fund the riskiest assets of the bank 7-16
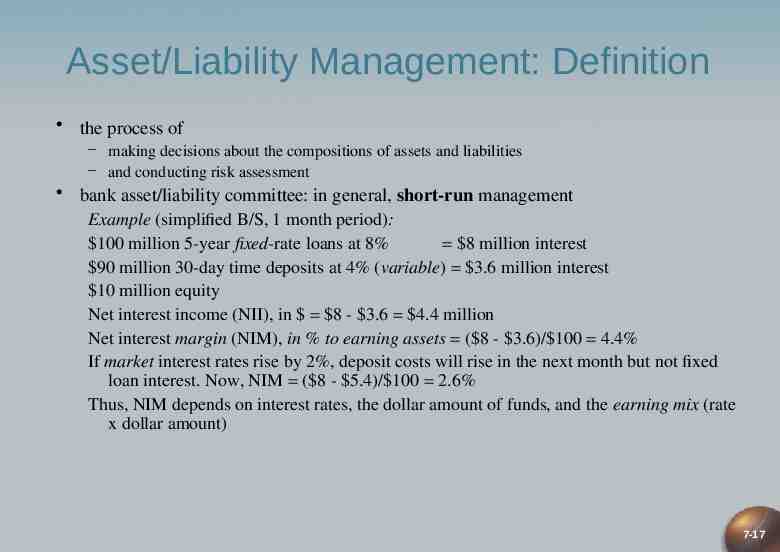
Asset/Liability Management: Definition the process of – making decisions about the compositions of assets and liabilities – and conducting risk assessment bank asset/liability committee: in general, short-run management Example (simplified B/S, 1 month period): 100 million 5-year fixed-rate loans at 8% 8 million interest 90 million 30-day time deposits at 4% (variable) 3.6 million interest 10 million equity Net interest income (NII), in 8 - 3.6 4.4 million Net interest margin (NIM), in % to earning assets ( 8 - 3.6)/ 100 4.4% If market interest rates rise by 2%, deposit costs will rise in the next month but not fixed loan interest. Now, NIM ( 8 - 5.4)/ 100 2.6% Thus, NIM depends on interest rates, the dollar amount of funds, and the earning mix (rate x dollar amount) 7-17
Asset/Liability Management: History Traditionally, banks have concentrated on asset management – under Regulation Q, fixed deposit costs on mainly “core” deposits, i.e. not interestsensitive – before October 1979, Fed monetary policy kept interest rates stable As loan demand increased in the 1960s, during bouts of inflation associated with the Vietnam War, banks started to use liability management – under liability management, banks purchase funds from the financial markets when needed – unlike core deposits purchased funds are highly interest-elastic – purchased funds have availability risk: these funds can dry up quickly if the market perceives problems of bank safety (e.g., Continental Illinois in 1984) Alternatives to managing interest rate risk – on-balance sheet adjustments in fixed vs variable pricing and maturities – off-balance sheet use of derivatives, such as interest rate swaps, financial futures, and loan guarantees 7-18
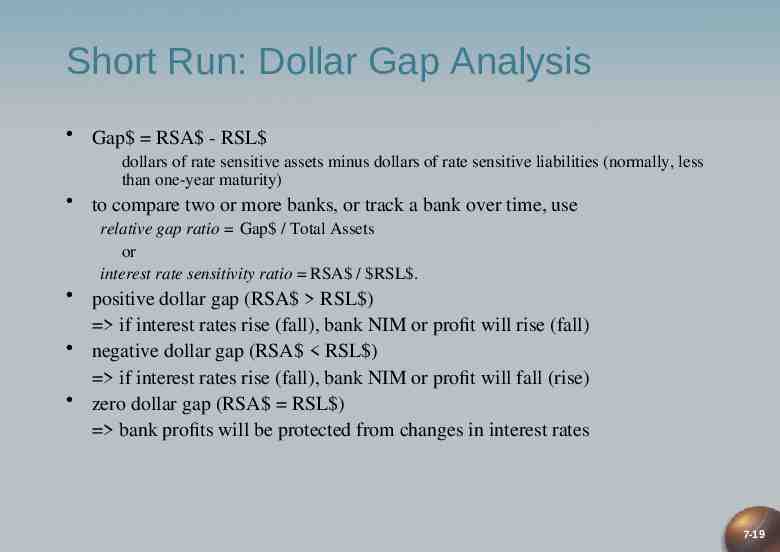
Short Run: Dollar Gap Analysis Gap RSA - RSL dollars of rate sensitive assets minus dollars of rate sensitive liabilities (normally, less than one-year maturity) to compare two or more banks, or track a bank over time, use relative gap ratio Gap / Total Assets or interest rate sensitivity ratio RSA / RSL . positive dollar gap (RSA RSL ) if interest rates rise (fall), bank NIM or profit will rise (fall) negative dollar gap (RSA RSL ) if interest rates rise (fall), bank NIM or profit will fall (rise) zero dollar gap (RSA RSL ) bank profits will be protected from changes in interest rates 7-19
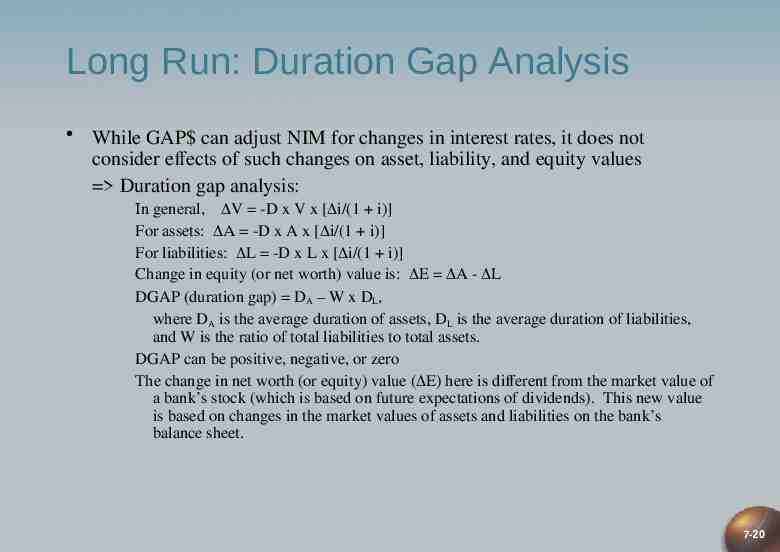
Long Run: Duration Gap Analysis While GAP can adjust NIM for changes in interest rates, it does not consider effects of such changes on asset, liability, and equity values Duration gap analysis: n general, V -D x V x [ i/(1 i)] For assets: -D x A x [ i/(1 i)] For liabilities: L -D x L x [ i/(1 i)] Change in equity (or net worth) value is: E A - L DGAP (duration gap) DA – W x DL, where DA is the average duration of assets, DL is the average duration of liabilities, and W is the ratio of total liabilities to total assets. DGAP can be positive, negative, or zero The change in net worth (or equity) value ( E) here is different from the market value of a bank’s stock (which is based on future expectations of dividends). This new value is based on changes in the market values of assets and liabilities on the bank’s balance sheet. 7-20
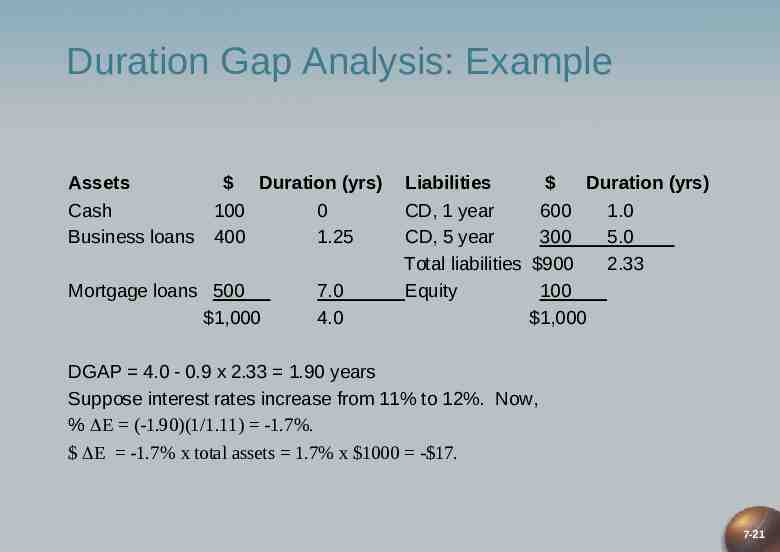
Duration Gap Analysis: Example Assets Cash Business loans Duration (yrs) 100 0 400 1.25 Mortgage loans 500 1,000 7.0 4.0 Liabilities CD, 1 year CD, 5 year Total liabilities Equity Duration (yrs) 600 1.0 300 5.0 900 2.33 100 1,000 DGAP 4.0 - 0.9 x 2.33 1.90 years Suppose interest rates increase from 11% to 12%. Now, % E (-1.90)(1/1.11) -1.7%. E -1.7% x total assets 1.7% x 1000 - 17. 7-21
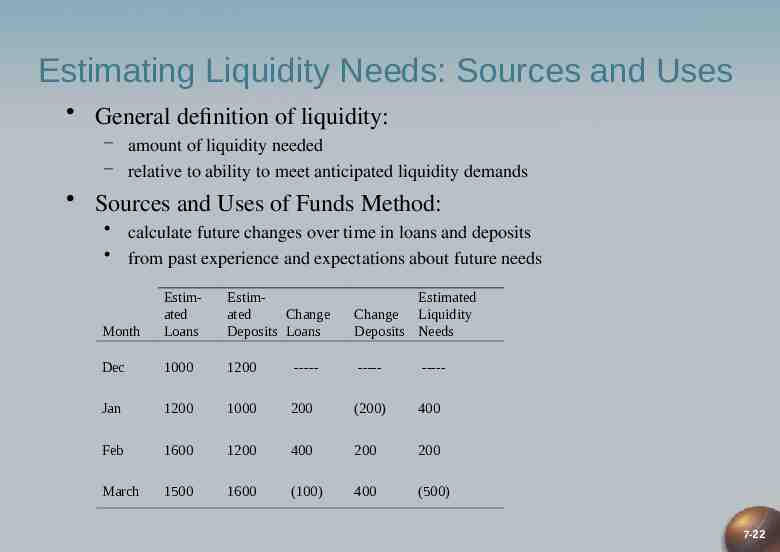
Estimating Liquidity Needs: Sources and Uses General definition of liquidity: – amount of liquidity needed – relative to ability to meet anticipated liquidity demands Sources and Uses of Funds Method: calculate future changes over time in loans and deposits from past experience and expectations about future needs Month Estimated Loans Estimated Change Deposits Loans Estimated Change Liquidity Deposits Needs Dec 1000 1200 ----- ----- ----- Jan 1200 1000 200 (200) 400 Feb 1600 1200 400 200 200 March 1500 1600 (100) 400 (500) 7-22
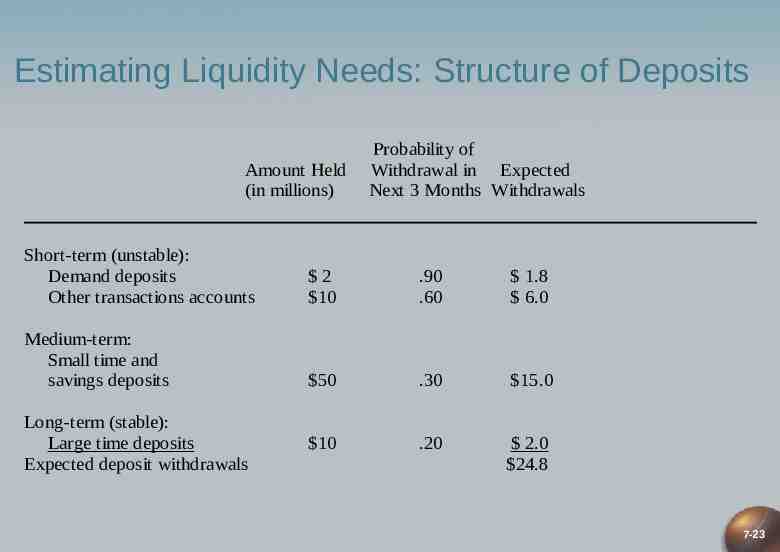
Estimating Liquidity Needs: Structure of Deposits Amount Held (in millions) Probability of Withdrawal in Expected Next 3 Months Withdrawals Short-term (unstable): Demand deposits Other transactions accounts 2 10 .90 .60 1.8 6.0 Medium-term: Small time and savings deposits 50 .30 15.0 10 .20 2.0 24.8 Long-term (stable): Large time deposits Expected deposit withdrawals 7-23
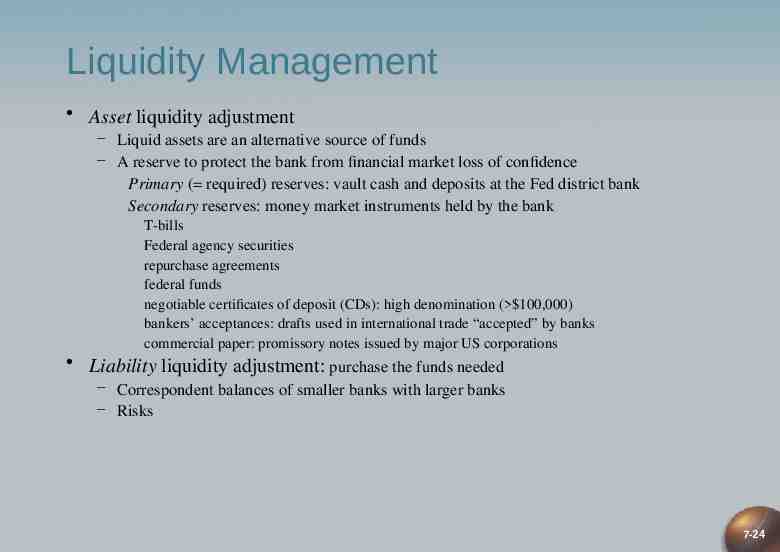
Liquidity Management Asset liquidity adjustment – Liquid assets are an alternative source of funds – A reserve to protect the bank from financial market loss of confidence Primary ( required) reserves: vault cash and deposits at the Fed district bank Secondary reserves: money market instruments held by the bank T-bills Federal agency securities repurchase agreements federal funds negotiable certificates of deposit (CDs): high denomination ( 100,000) bankers’ acceptances: drafts used in international trade “accepted” by banks commercial paper: promissory notes issued by major US corporations Liability liquidity adjustment: purchase the funds needed – Correspondent balances of smaller banks with larger banks – Risks 7-24
Concluding Wrap-Up What have we learnt? – – – – How commercial banks function What the principal risk management ratios are How banks effect asset/liability management What bank liquidity management means Where we go next: to electronic banking and offbalance sheet activities as forms of financial innovation 7-25