Lafayette Investment Club Oct 14, 2011


29 Slides2.78 MB
Lafayette Investment Club Oct 14, 2011
Agenda Club News Education – Valuation Ratios Renewable Energy – overview How to invest in renewable energy?
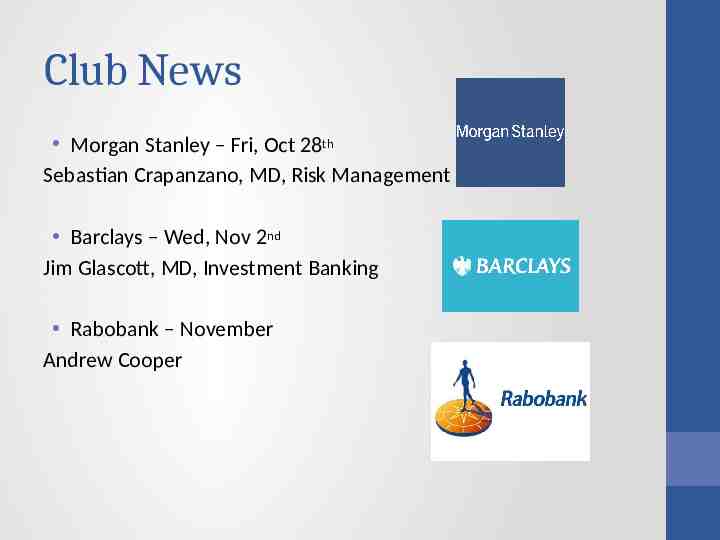
Club News Morgan Stanley – Fri, Oct 28th Sebastian Crapanzano, MD, Risk Management Barclays – Wed, Nov 2nd Jim Glascott, MD, Investment Banking Rabobank – November Andrew Cooper
Ratios and Stock Valuation Understanding How Stocks Are Compared And Valued
Types of Valuation Fundamental Analysis – “A method of evaluating a security that entails attempting to measure its intrinsic value by examining related economic, financial and other qualitative and quantitative factors.” – Investopedia In other words you have to look at the big picture when fundamentally looking at a company. You have to consider things like; Industry (Competitors, Market), Earnings, Income, Cash Flow etc. Essentially you need to find out the Companies DNA.
How do we do this? 1) Balance Sheet - A statement of the assets, liabilities, and capital of a business or other organization at a particular point in time. (Loans/ Short term/long term Debt) 2) Income Statement - a financial statement that gives operating results for a specific period. (expenses/ COG’s) 3) Cash Flow - The total amount of money being transferred into and out of a business, esp. as affecting liquidity. (solvency, the cash health) All three things can publically be viewed online, these statements are released Quarterly, and Annually.
What's Next? Once you have considered “The Big Picture”, you have an understanding of the companies fiscal figures, the next question I always ask myself, is where the hell is this stock going and how does it compare to its market and competitors? A great tool to use are ratios that you can use to valuate these companies and see how they match up. Most of these ratios point out if the stock is “cheap” or “expensive” or “undervalued” or overvalued”. Once you understand where the company stands in comparison to the market, you can see if these are the right “levels” to get in.
Ratio’s Here are some of the Ratio’s used to valuate companies. P/E – Price Earnings PEG – Price Earnings Growth EBITDA - Earnings before interest, taxes, depreciation, and amorization EV/EBITDA – Enterprise Value to EBITDA
Price/Earnings This valuation ratio compares the company's current share price to its per-share earnings. This can be a valuable tool in valuating companies within the same industry. P/E is often used as a multiple when noting how much an investor/trader is willing to pay per dollar of earnings. You will often hear analysts or traders say, “Its trading 10 times earnings” or “At a multiple of 14 the stock seems cheap”. Formula: Market Value per Share / Earnings per Share (EPS)
PEG (Price Earnings Growth) Ratio A huge valuation tool for estimating potential earnings growth. A company with a low PEG ratio closer to 0 is most likely undervalued. However, just like P/E it has its limits. These are projected numbers, so of course are subject to change. This is still a great tool to see how it compares to industry leaders, also a huge tool used by Growth Investors. Formula: Price/Earnings / Annual EPS growth
EBITDA A measurement of a company's operating profitability. It is equal to earnings before interest, tax, depreciation and amortization (EBITDA) divided by total revenue. In essence you have a look at the company’s total profitability outlook.
Enterprise Value/ EBITDA First Enterprise Value is not to be mistaken with market cap. Market Cap only deals with is limited to common equity. Enterprise Value sums up everything and gives you the market value of the whole business. EV/EBITDA is important because it can compare any company to another. It ignores tax structures of other countries, and it also can be a great tool for potential takeover targets. A company with a low ev/ebitda multiple is considered by some as undervauled.
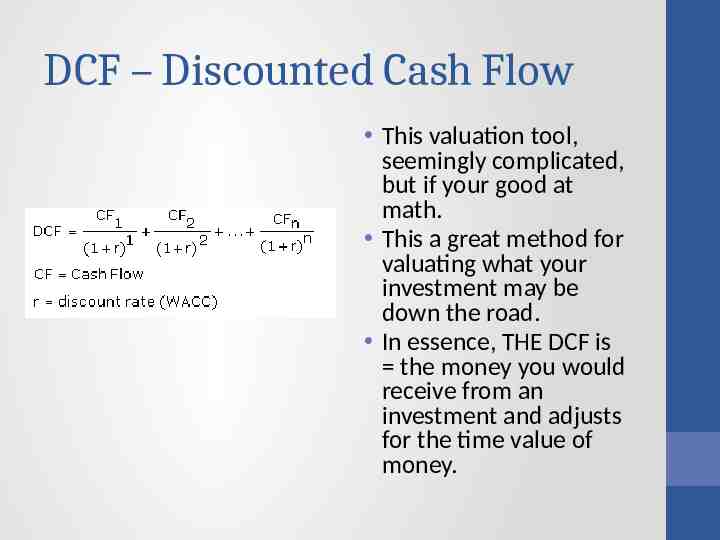
DCF – Discounted Cash Flow This valuation tool, seemingly complicated, but if your good at math. This a great method for valuating what your investment may be down the road. In essence, THE DCF is the money you would receive from an investment and adjusts for the time value of money.
Done
More Renewable Energy Greg Allis
Solar (PV) Panels
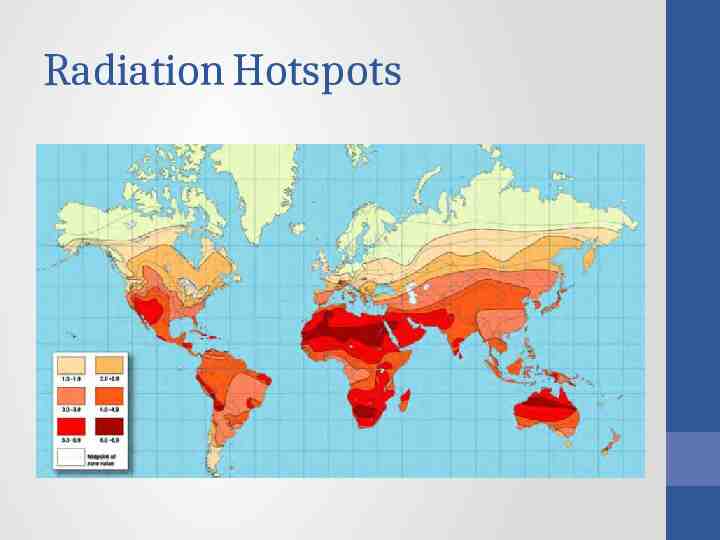
Radiation Hotspots
Wind Turbines
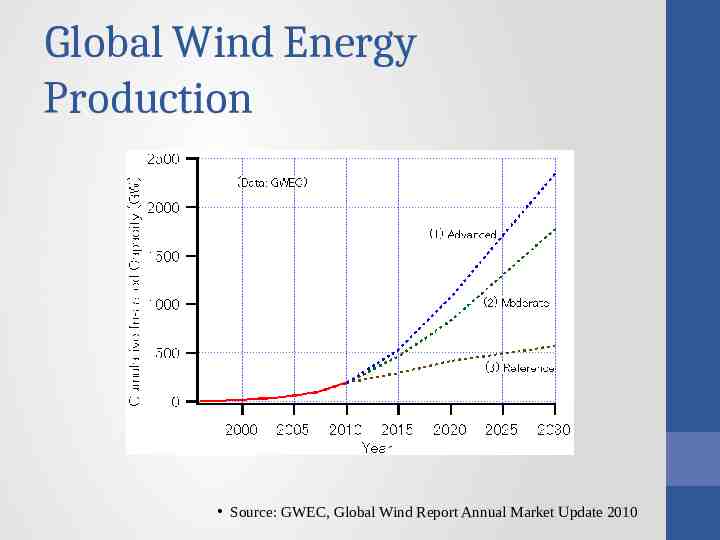
Global Wind Energy Production Source: GWEC, Global Wind Report Annual Market Update 2010
Geothermal
Other forms Biofuels Biomass Hydroelectric Tidal
“I’m Going to Work on Wall Street, Why Do I Care?” New and developing technologies Huge political, social, and economic impacts Money to be made
Success Indicators Government/financial support Energy potential Social attitude towards green energy
Where/How to Invest in Clean Energy &Risks of Clean Energy
Renewable Energy Companies
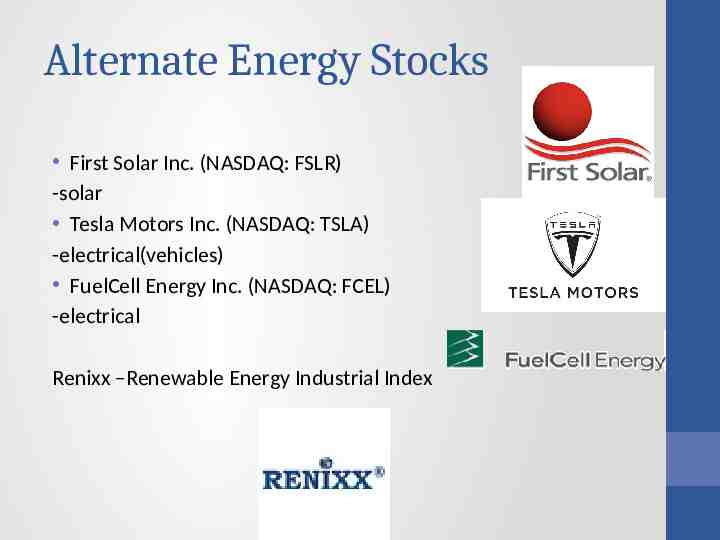
Alternate Energy Stocks First Solar Inc. (NASDAQ: FSLR) -solar Tesla Motors Inc. (NASDAQ: TSLA) -electrical(vehicles) FuelCell Energy Inc. (NASDAQ: FCEL) -electrical Renixx –Renewable Energy Industrial Index
Green ETF’s A green ETF is ultimately a basket of alternative energy stocks or stocks of green companies Bought and sold on the stock market Not subject to the same fees as an alternate investment fund(lower expense ratio) Buying ETF’s is less risky than individual stocks
Alternate Energy ETF’s Market Vectors Global Alternative Energy ETF (NYSE: GEX) PowerShares Clean Energy ETF (NYSE:PBW) Market Vectors Solar Energy ETF (NYSE: KWT). Funds iShares S&P Global Clean Energy Index Fund (ICLN) New Alternatives Fund(NALFX)
Risks of Clean Energy Rapidly developing technologies Industries prospects rely on Government help(subsidies) Alternative-energy stocks tend to fall in and out of favor depending on the price of crude So many clean energy companies emerging its hard to pick which one will stand the test of time (Investor emotional Involvement for the wrong reasons)