E TH S AF G M N E E D I C V I R C T AN A C M N E A EC F F F O R L E R


35 Slides614.48 KB
E TH S AF G M N E E D I C V I R C T AN A C M N E A EC F F F O R L E R A R ER B CO F OY P S PS ET T E A S Y T E U R E M E N T O F I F A S KENT BLACKMON BSC., CRSP RYA N O RV I S C R S P , C H S C
SESSION OBJECTIVES Internal Responsibility System Benefits of measuring safety performance Measuring what’s important What makes measures effective Leading vs. lagging indicators Setting the standard Integrating new metrics and establishing goals Recognizing a Strong Safety Culture
Internal Responsibility System 3
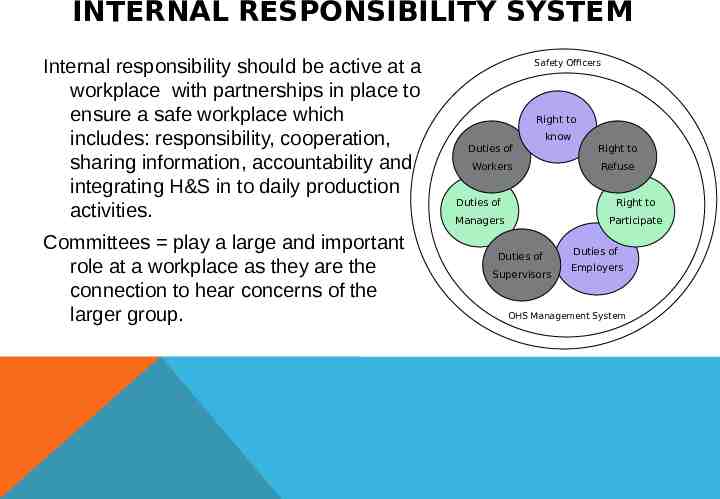
INTERNAL RESPONSIBILITY SYSTEM Internal responsibility should be active at a workplace with partnerships in place to ensure a safe workplace which includes: responsibility, cooperation, sharing information, accountability and integrating H&S in to daily production activities. Committees play a large and important role at a workplace as they are the connection to hear concerns of the larger group. Safety Officers Right to know Duties of Right to Workers Refuse Duties of Right to Managers Participate Duties of Supervisors Duties of Employers OHS Management System
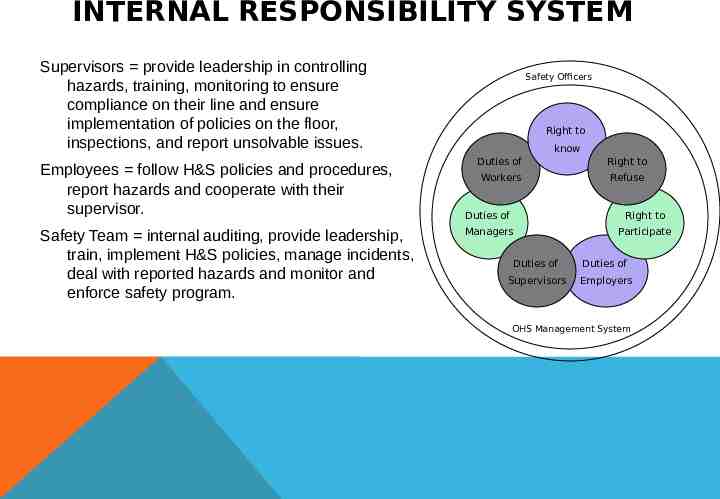
INTERNAL RESPONSIBILITY SYSTEM Supervisors provide leadership in controlling hazards, training, monitoring to ensure compliance on their line and ensure implementation of policies on the floor, inspections, and report unsolvable issues. Employees follow H&S policies and procedures, report hazards and cooperate with their supervisor. Safety Team internal auditing, provide leadership, train, implement H&S policies, manage incidents, deal with reported hazards and monitor and enforce safety program. Safety Officers Right to know Duties of Right to Workers Refuse Duties of Right to Managers Participate Duties of Duties of Supervisors Employers OHS Management System
INTERNAL RESPONSIBILITY SYSTEM By understanding the “system” we see how each party in the workplace not only has responsibility, but more importantly how they intertwine and support each other. We can also realize the importance of how relationships and communication between parties can determine the drive for a better safety culture and performance.
RELATING THE INTERNAL RESPONSIBILITY SYSTEM TO SAFETY INDICATORS By understanding the IRS and the difference between Leading & Lagging indicators we can see how they can relate. By following the IRS employers will be accountable to have and monitor a strong OHS management system. All workers will be accountable to follow the safety program, and have the right to know and participate. Everyone will have a voice in the program. This would relate to our leading indicators. Having a strong OHS management system supported by the IRS, theoretically should reduce injury statistics. This would have a positive effect to our lagging indicators.
Why Measure Safety? 8
WHY MEASURE SAFETY PERFORMANCE? What gets measured, gets managed Provide an objective basis to determine program effectiveness. Provide information for decision making (management) Forms basis for continual improvement
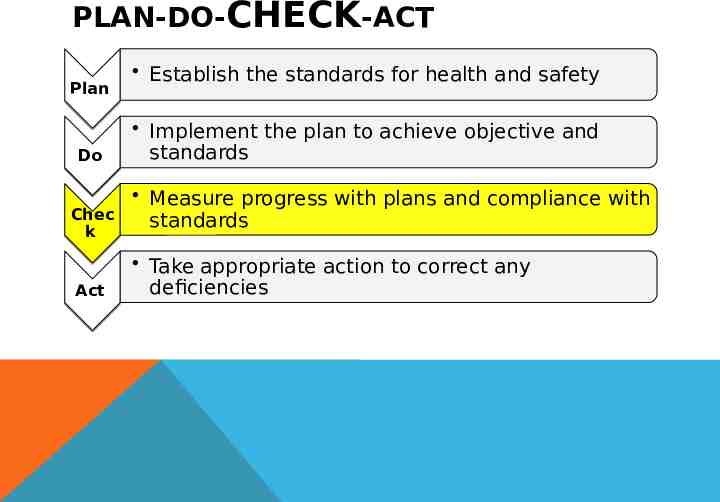
PLAN-DO-CHECK-ACT Plan Do Chec k Act Establish the standards for health and safety Implement the plan to achieve objective and standards Measure progress with plans and compliance with standards Take appropriate action to correct any deficiencies
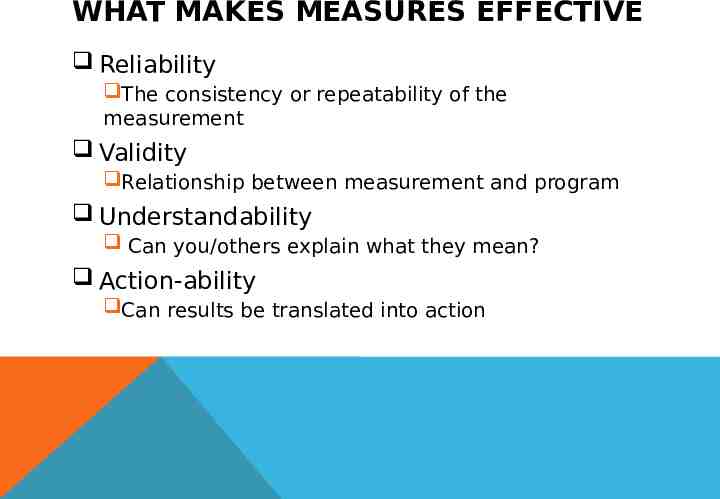
WHAT MAKES MEASURES EFFECTIVE Reliability The consistency or repeatability of the measurement Validity Relationship between measurement and program Understandability Can you/others explain what they mean? Action-ability Can results be translated into action
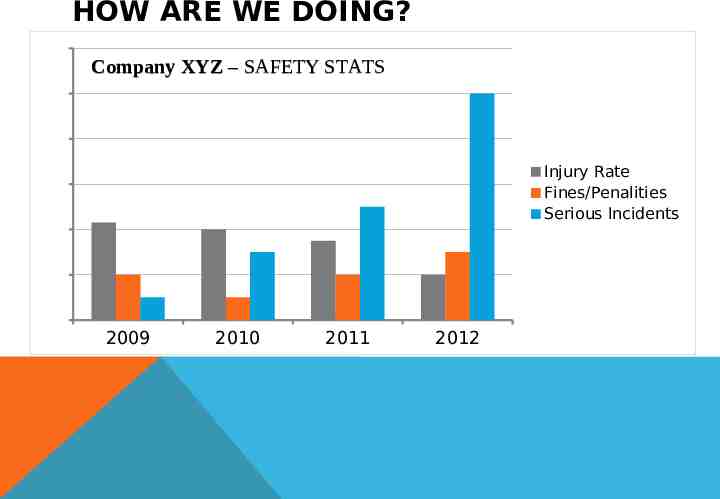
HOW ARE WE DOING? 12 Company XYZ – SAFETY STATS 10 8 Injury Rate Fines/Penalities Serious Incidents 6 4 2 0 2009 2010 2011 2012
Measuring What’s Important 13
SAFETY METRICS FRAMEWORK Over the past decade, companies have been looking for better, more pro-active measures of safety performance. Traditional methods of evaluating safety performance have not provided the right information. Traditionally we would look at injury frequency’s
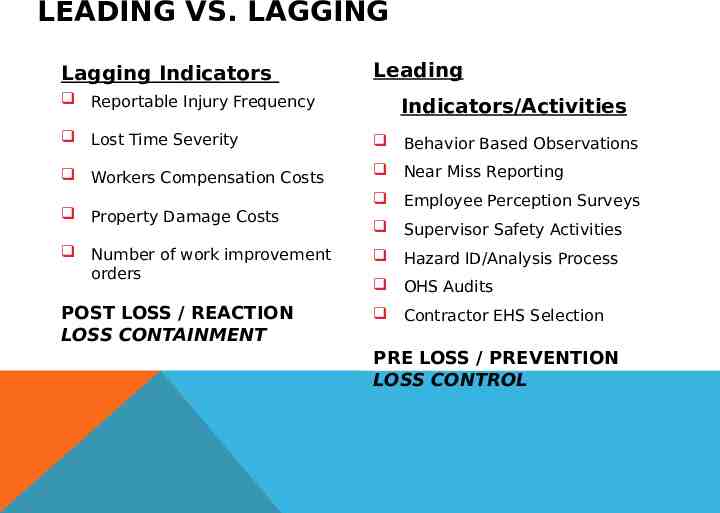
TRADITIONAL SAFETY MEASURES Trailing (or lagging) Indicators Results measures that tell what happened. Focus on what went wrong. Include injury statistics and loss reports. Good for accountability but not indicative of best strategies for continuous improvement.
PROBLEMS WITH LAGGING INDICATORS Provides a limited, and often distorted, view of safety performance. Can be a deceptive indicator. Lagging indicators do not explain performance; i.e. they provide insufficient data about what has been done (or not done); how well it was done; and their relationship to outcomes. Possible “polluted" reporting. Can be a motivation killer. They do not provide sufficient process insights to effectively manage health and safety.
“Managing safety only by LTI, is like playing tennis with your eye on the scoreboard and not on the ball” (Bernard Borg, 2002, Predictive Safety from Near Miss and Hazard Reporting)
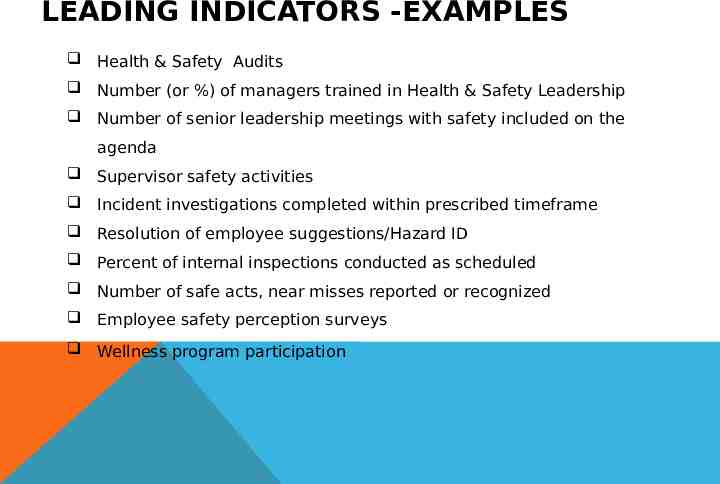
LEADING INDICATORS Measures that can be effective in predicting future safety performance. “Before-The-Fact Measures.” Assess results of actions taken before incidents occur. Help to assess performance “effort” vs. “result’
LEADING INDICATORS -EXAMPLES Health & Safety Audits Number (or %) of managers trained in Health & Safety Leadership Number of senior leadership meetings with safety included on the agenda Supervisor safety activities Incident investigations completed within prescribed timeframe Resolution of employee suggestions/Hazard ID Percent of internal inspections conducted as scheduled Number of safe acts, near misses reported or recognized Employee safety perception surveys Wellness program participation
LEADING VS. LAGGING Lagging Indicators Reportable Injury Frequency Leading Indicators/Activities Lost Time Severity Behavior Based Observations Workers Compensation Costs Near Miss Reporting Property Damage Costs Employee Perception Surveys Supervisor Safety Activities Number of work improvement orders Hazard ID/Analysis Process POST LOSS / REACTION LOSS CONTAINMENT Contractor EHS Selection OHS Audits PRE LOSS / PREVENTION LOSS CONTROL
Setting the Standard 21
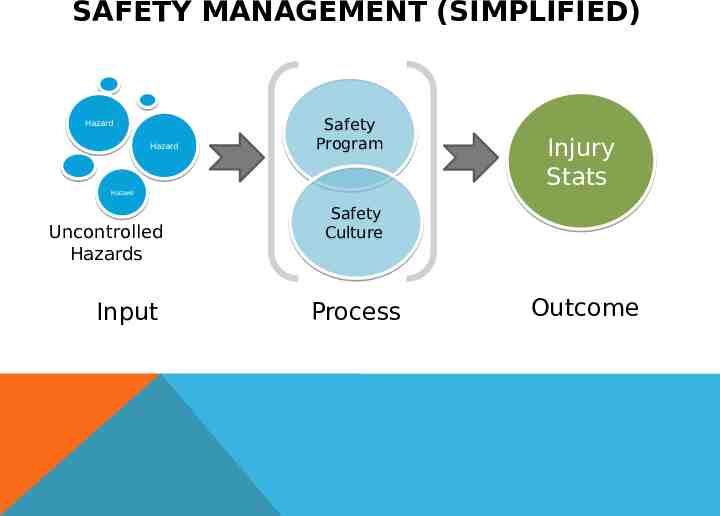
SAFETY MANAGEMENT (SIMPLIFIED) Hazard Hazard Safety Program Hazard Hazard Uncontrolled Hazards Input Injury Stats Safety Culture Process Outcome
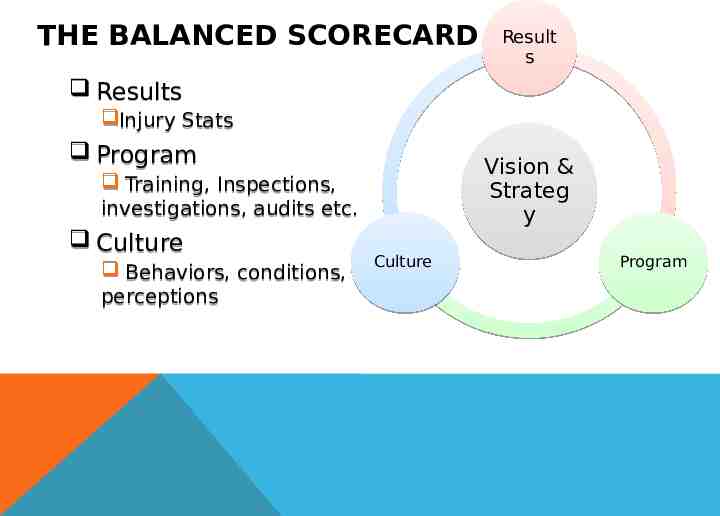
THE BALANCED SCORECARD Result s Results Injury Stats Program Vision & Strateg y Training, Inspections, investigations, audits etc. Culture Behaviors, conditions, perceptions Culture Program
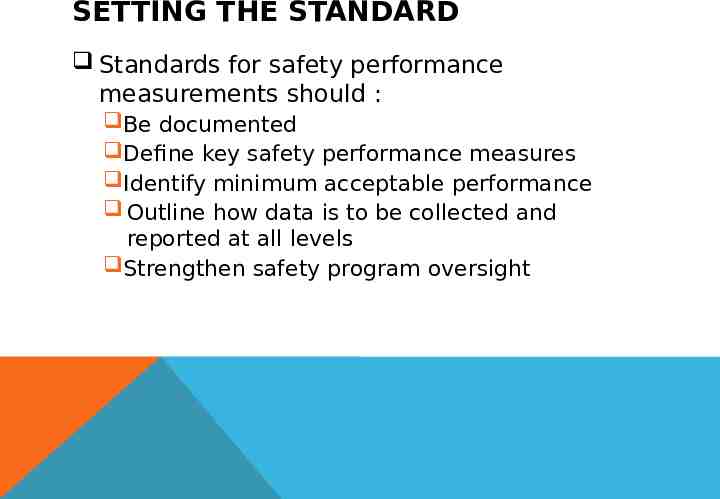
SETTING THE STANDARD Standards for safety performance measurements should : Be documented Define key safety performance measures Identify minimum acceptable performance Outline how data is to be collected and reported at all levels Strengthen safety program oversight
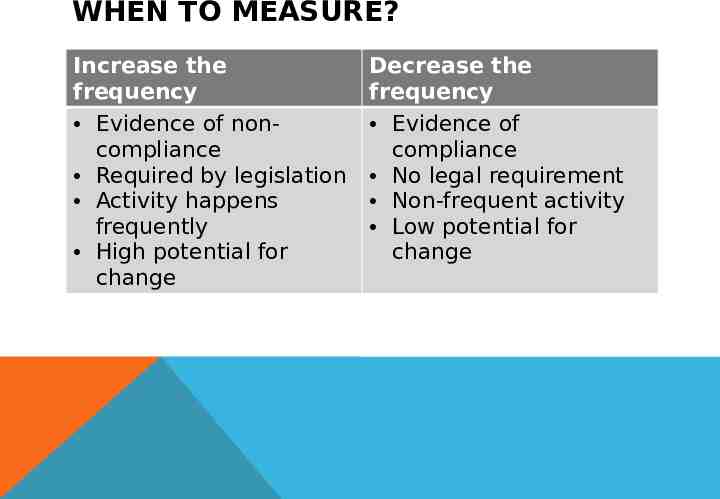
WHEN TO MEASURE? Increase the frequency Evidence of noncompliance Required by legislation Activity happens frequently High potential for change Decrease the frequency Evidence of compliance No legal requirement Non-frequent activity Low potential for change
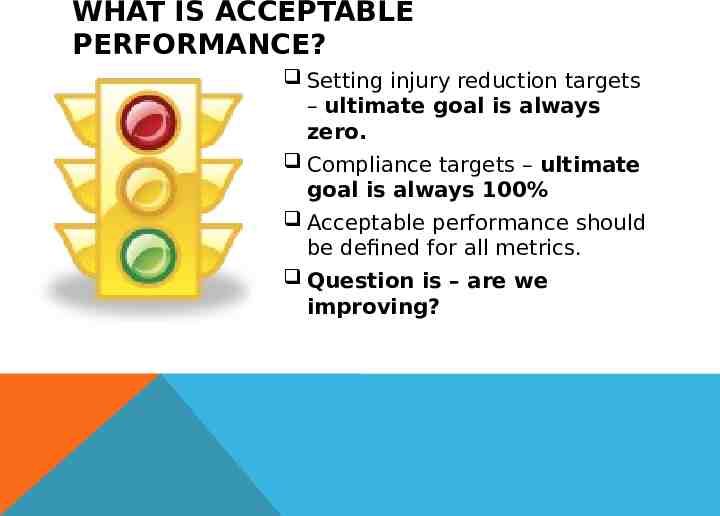
WHAT IS ACCEPTABLE PERFORMANCE? Setting injury reduction targets – ultimate goal is always zero. Compliance targets – ultimate goal is always 100% Acceptable performance should be defined for all metrics. Question is – are we improving?
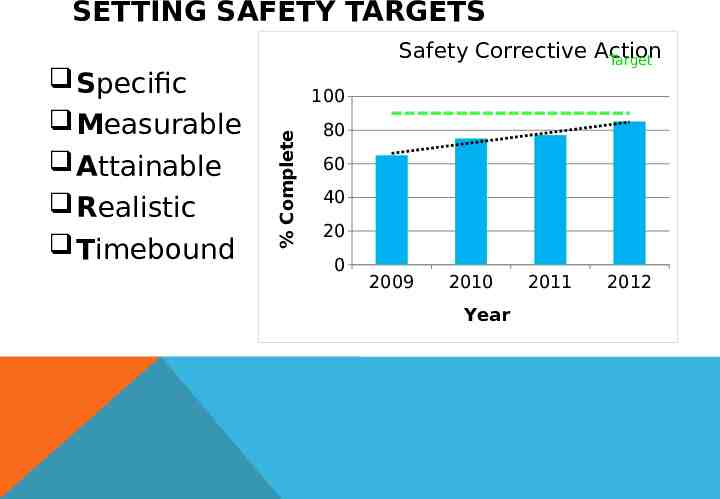
SETTING SAFETY TARGETS 100 % Complete Specific Measurable Attainable Realistic Timebound Safety Corrective Action Target 80 60 40 20 0 2009 2010 Year 2011 2012
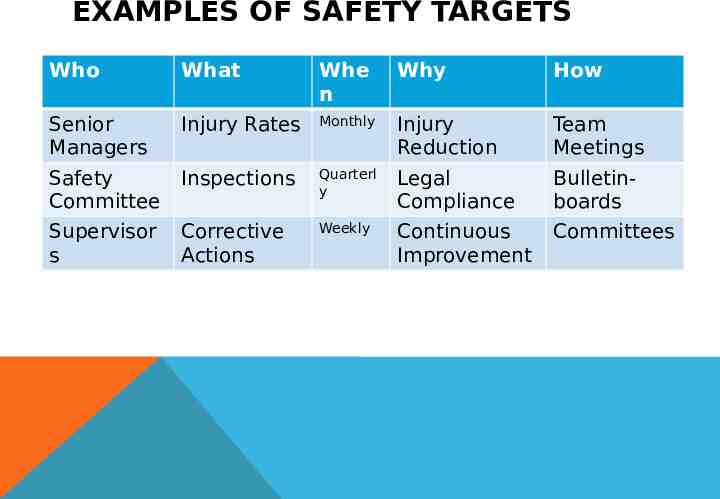
EXAMPLES OF SAFETY TARGETS Who What Whe n Why How Senior Managers Injury Rates Monthly Injury Reduction Team Meetings Safety Committee Inspections Quarterl y Legal Compliance Bulletinboards Supervisor s Corrective Actions Weekly Continuous Improvement Committees
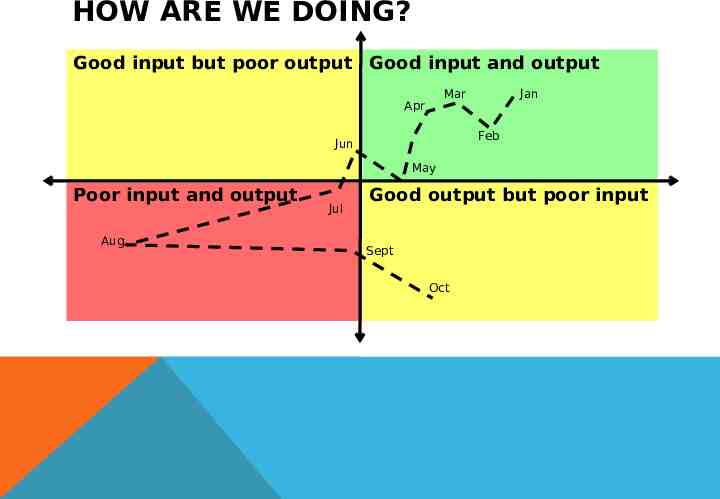
HOW ARE WE DOING? Good input but poor output Good input and output Mar Apr Jan Feb Jun May Poor input and output Aug Jul Good output but poor input Sept Oct
BENCHMARKING Ongoing process of measuring one company's safety performance against those recognized as industry leaders. Serves as a measuring stick for the organization by identifying those organizations that are viewed as the best. Comparing ‘apples to apples’ can be challenging (e.g. difference in calculations, organizations)
TIPS FOR MEASURING SAFETY PERFORMANCE Define who, what , when, where, why and how Balance the scorecard – use leading and lagging indicators Set targets and goals that align with the organizations vision Report progress at all organizational levels Don’t forget to celebrate successes along the way
Recognizing a Strong Safety Culture 32
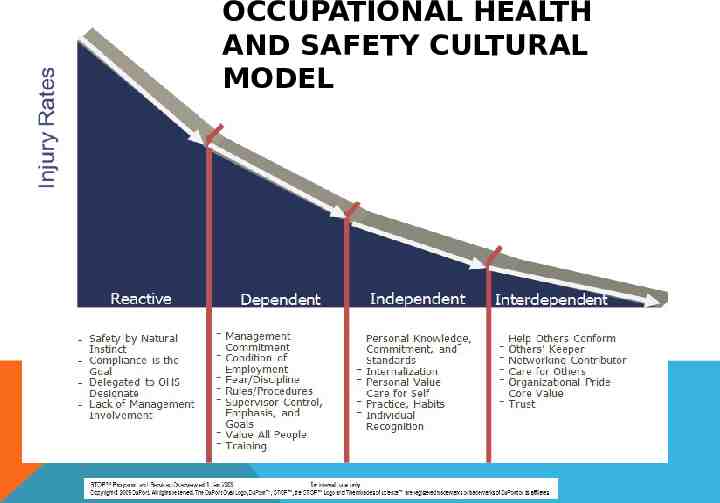
OCCUPATIONAL HEALTH AND SAFETY CULTURAL MODEL
RECOGNIZING A STRONG SAFETY CULTURE Measuring the right things and strong safety culture does not happen over night, but it can be achieved. We need to focus on the right indicator, and not get caught up on the lagging. We all can lead safety, we all can make a difference.
Questions 35