Supply Chain Management Mid-Semester Review


42 Slides664.50 KB
Supply Chain Management Mid-Semester Review
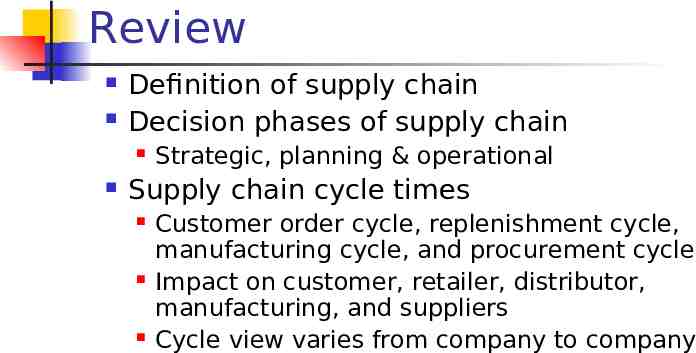
Review Definition of supply chain Decision phases of supply chain Strategic, planning & operational Supply chain cycle times Customer order cycle, replenishment cycle, manufacturing cycle, and procurement cycle Impact on customer, retailer, distributor, manufacturing, and suppliers Cycle view varies from company to company
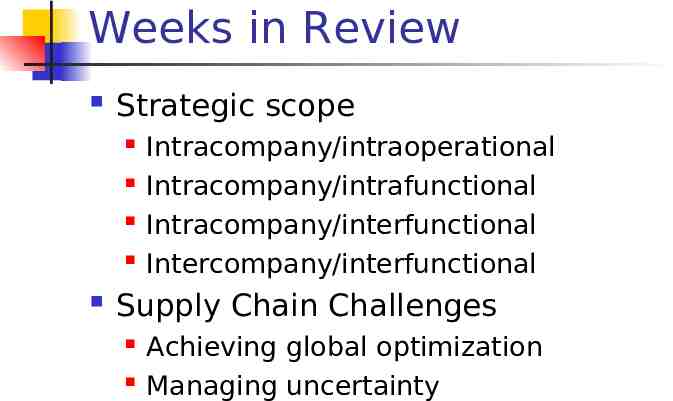
Weeks in Review Strategic scope Intracompany/intraoperational Intracompany/intrafunctional Intracompany/interfunctional Intercompany/interfunctional Supply Chain Challenges Achieving global optimization Managing uncertainty
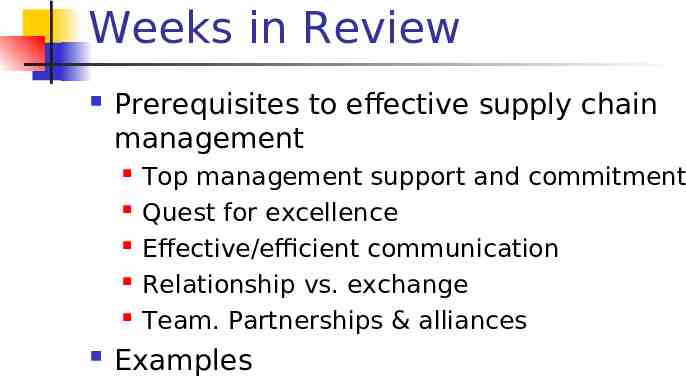
Weeks in Review Prerequisites to effective supply chain management Top management support and commitment Quest for excellence Effective/efficient communication Relationship vs. exchange Team. Partnerships & alliances Examples
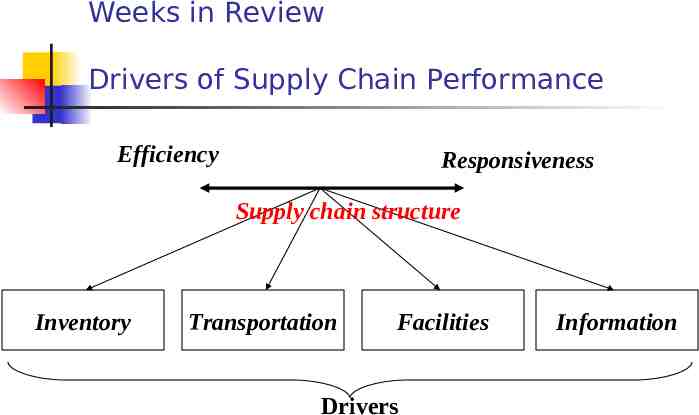
Weeks in Review Drivers of Supply Chain Performance Efficiency Responsiveness Supply chain structure Inventory Transportation Facilities Drivers Information
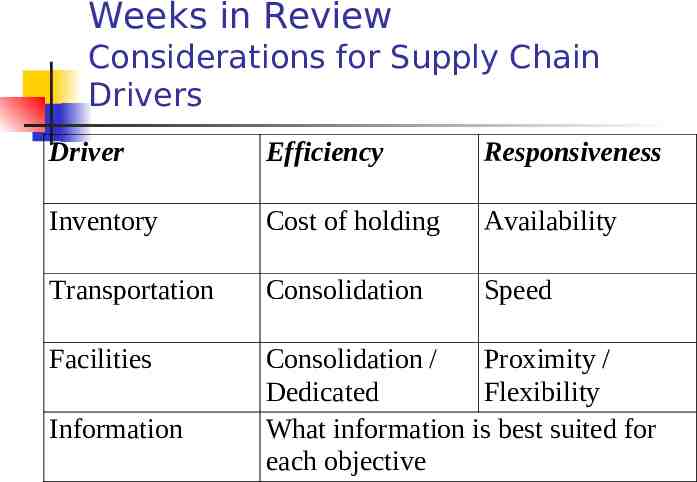
Weeks in Review Considerations for Supply Chain Drivers Driver Efficiency Responsiveness Inventory Cost of holding Availability Transportation Consolidation Speed Facilities Consolidation / Proximity / Dedicated Flexibility What information is best suited for each objective Information
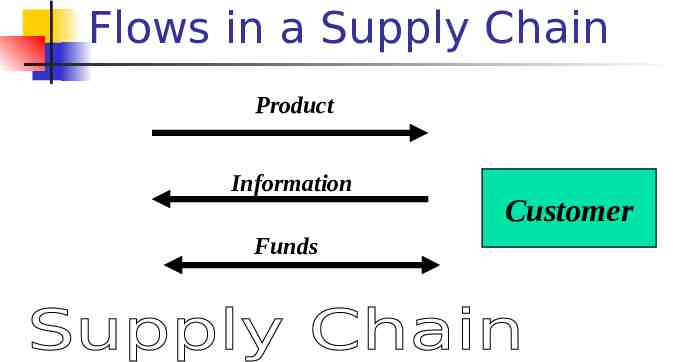
Flows in a Supply Chain Product Information Funds Customer
Supply Chain Enablers Organizational Infrastructure Information Technology Strategic Alliance Human Resource Management
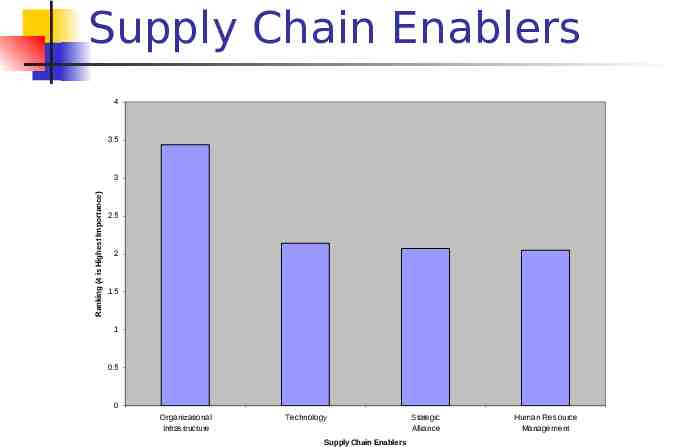
Supply Chain Enablers 4 3.5 Ranking (4 is Highest Importance) 3 2.5 2 1.5 1 0.5 0 Organizational Infrastructure Technology Supply Chain Enablers Stategic Alliance Human Resource Management
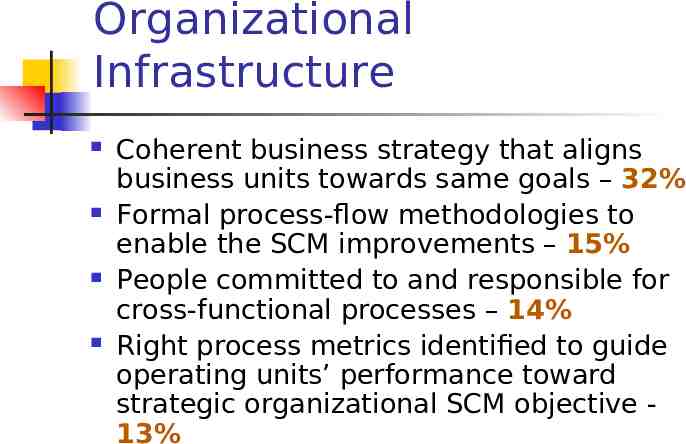
Organizational Infrastructure Coherent business strategy that aligns business units towards same goals – 32% Formal process-flow methodologies to enable the SCM improvements – 15% People committed to and responsible for cross-functional processes – 14% Right process metrics identified to guide operating units’ performance toward strategic organizational SCM objective 13%
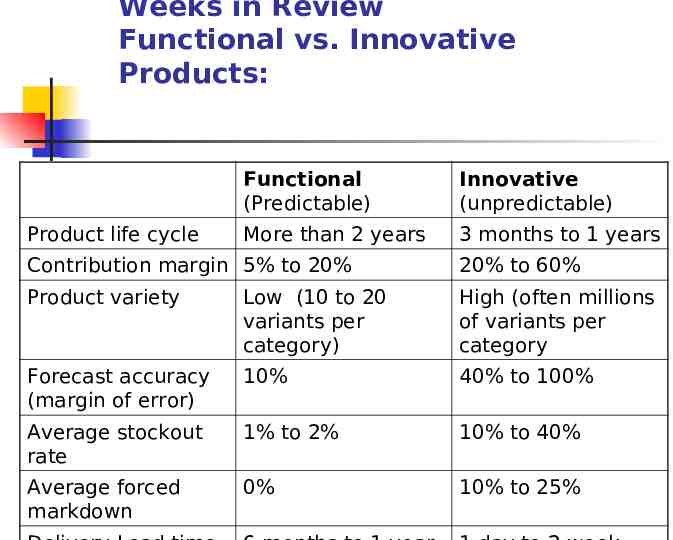
Weeks in Review Functional vs. Innovative Products: Product life cycle Functional (Predictable) Innovative (unpredictable) More than 2 years 3 months to 1 years Contribution margin 5% to 20% 20% to 60% Product variety Low (10 to 20 variants per category) High (often millions of variants per category Forecast accuracy (margin of error) 10% 40% to 100% Average stockout rate 1% to 2% 10% to 40% Average forced markdown 0% 10% to 25%
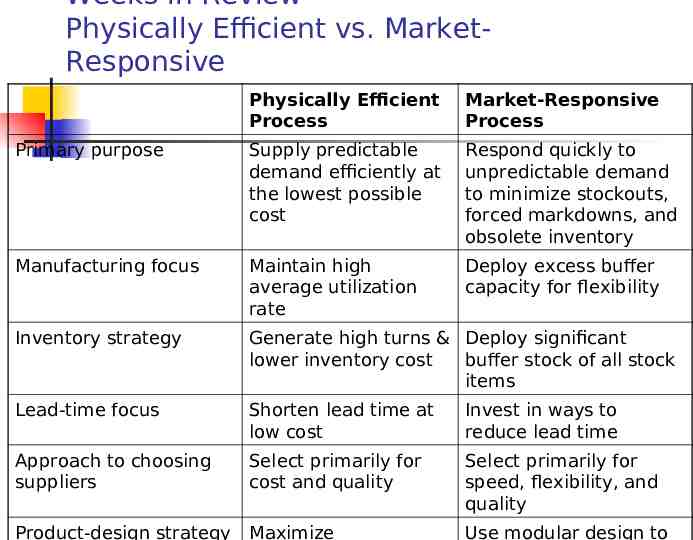
Weeks in Review Physically Efficient vs. MarketResponsive Physically Efficient Process Market-Responsive Process Primary purpose Supply predictable demand efficiently at the lowest possible cost Respond quickly to unpredictable demand to minimize stockouts, forced markdowns, and obsolete inventory Manufacturing focus Maintain high average utilization rate Deploy excess buffer capacity for flexibility Inventory strategy Generate high turns & Deploy significant lower inventory cost buffer stock of all stock items Lead-time focus Shorten lead time at low cost Invest in ways to reduce lead time Approach to choosing suppliers Select primarily for cost and quality Select primarily for speed, flexibility, and quality Product-design strategy Maximize Use modular design to
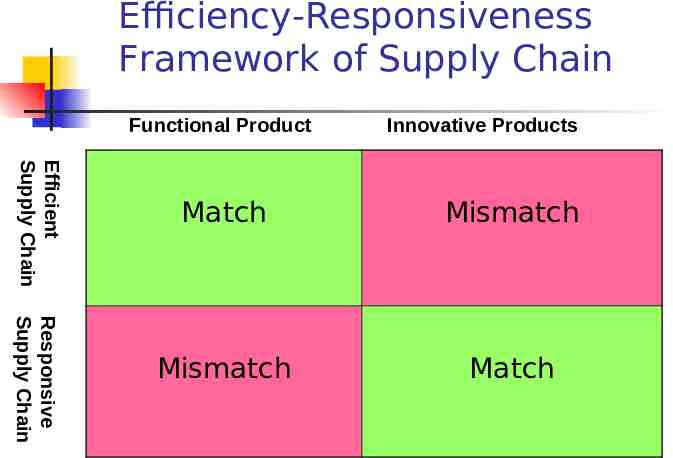
Efficiency-Responsiveness Framework of Supply Chain Functional Product Innovative Products Efficient Supply Chain Responsive Supply Chain Match Mismatch Mismatch Match
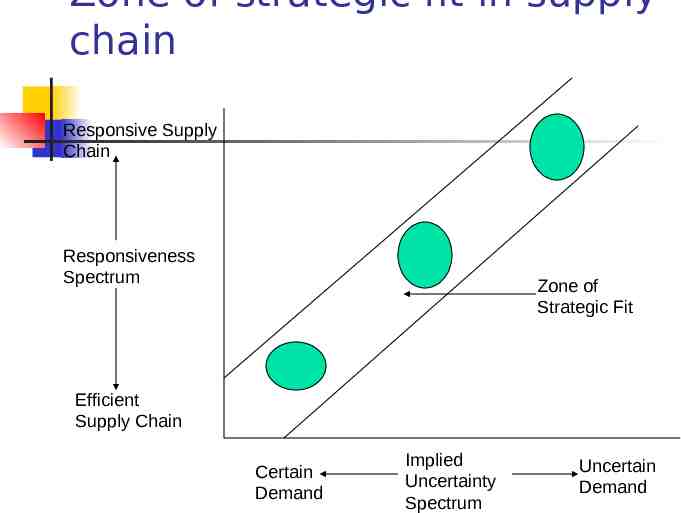
Zone of strategic fit in supply chain Responsive Supply Chain Responsiveness Spectrum Zone of Strategic Fit Efficient Supply Chain Certain Demand Implied Uncertainty Spectrum Uncertain Demand
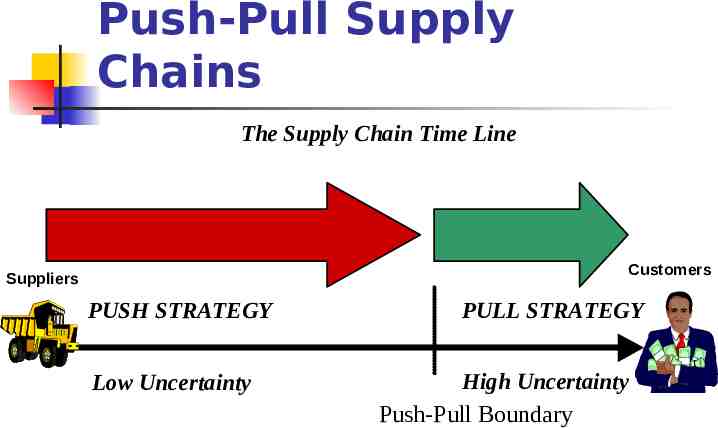
Supply Chain Strategies Push-Based Supply Chain Pull-Based Supply Chain Push-Pull Supply Chain
Push-Pull Supply Chains The Supply Chain Time Line Customers Suppliers PUSH STRATEGY Low Uncertainty PULL STRATEGY High Uncertainty Push-Pull Boundary
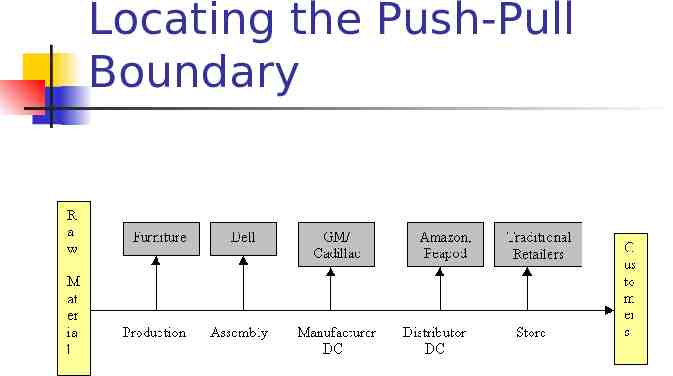
Locating the Push-Pull Boundary
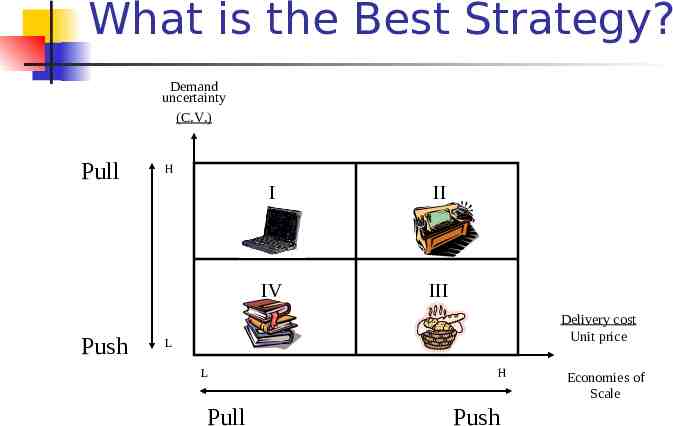
What is the Best Strategy? Demand uncertainty (C.V.) Pull H I II Computer IV Push III Delivery cost Unit price L L Pull H Push Economies of Scale
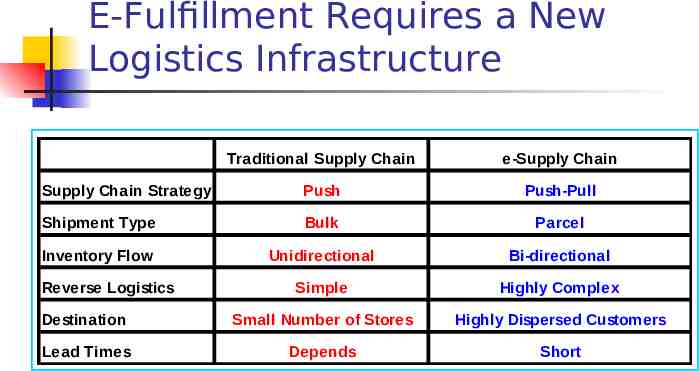
E-Fulfillment Requires a New Logistics Infrastructure Traditional Supply Chain e-Supply Chain Supply Chain Strategy Push Push-Pull Shipment Type Bulk Parcel Inventory Flow Unidirectional Bi-directional Simple Highly Complex Destination Small Number of Stores Highly Dispersed Customers Lead Times Depends Short Reverse Logistics
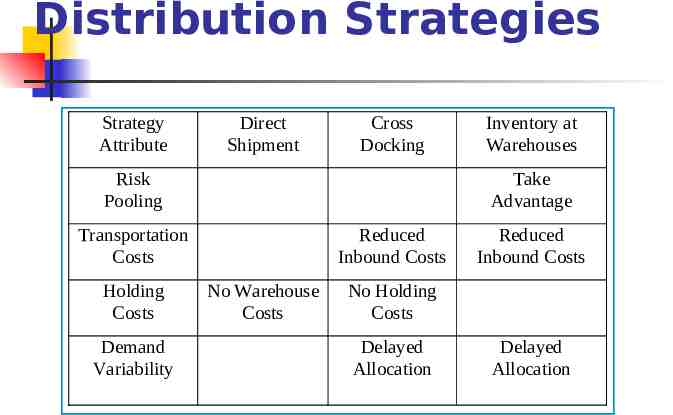
Distribution Strategies Strategy Attribute Direct Shipment Cross Docking Risk Pooling Take Advantage Transportation Costs Holding Costs Demand Variability Inventory at Warehouses Reduced Inbound Costs No Warehouse Costs Reduced Inbound Costs No Holding Costs Delayed Allocation Delayed Allocation
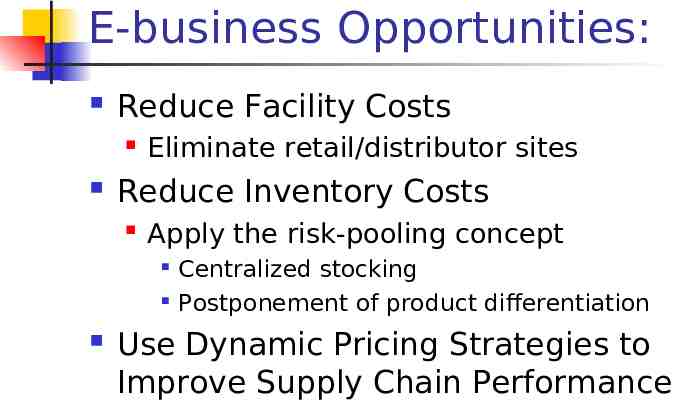
E-business Opportunities: Reduce Facility Costs Eliminate retail/distributor sites Reduce Inventory Costs Apply the risk-pooling concept Centralized stocking Postponement of product differentiation Use Dynamic Pricing Strategies to Improve Supply Chain Performance
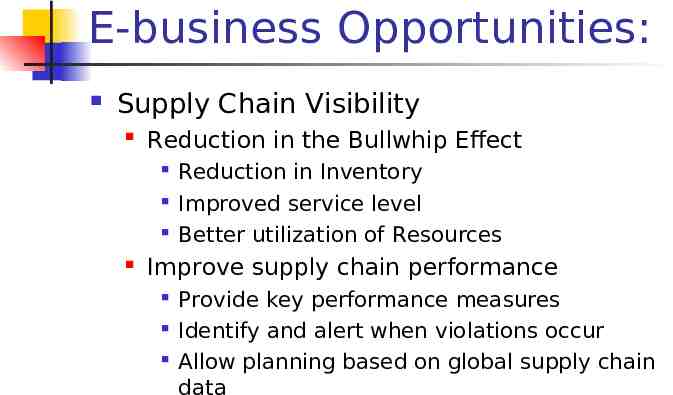
E-business Opportunities: Supply Chain Visibility Reduction in the Bullwhip Effect Reduction in Inventory Improved service level Better utilization of Resources Improve supply chain performance Provide key performance measures Identify and alert when violations occur Allow planning based on global supply chain data
Logistics Design Decisions Determine the appropriate number of warehouses Determine the location of each warehouse Determine the size of each warehouse Allocate space for products in each warehouse Determine which products customers will receive from each warehouse
Logistics Design Decisions Determine the appropriate number of warehouses Determine the location of each warehouse Determine the size of each warehouse Allocate space for products in each warehouse Determine which products customers will receive from each warehouse
Decision Classifications Strategic Planning: Decisions that typically involve major capital investments and have a long term effect 1. Determination of the number, location and size of new plants, distribution centers and warehouses 2. Acquisition of new production equipment and the design of working centers within each plant 3. Design of transportation facilities, communications equipment, data processing means, etc.
Decision Classifications Tactical Planning: Effective allocation of manufacturing and distribution resources over a period of several months 1. Work-force size 2. Inventory policies 3. Definition of the distribution channels 4. Selection of transportation and trans-shipment alternatives
Decision Classifications Operational Control: Includes day-to-day operational decisions 1. The assignment of customer orders to individual machines 2. Dispatching, expediting and processing orders 3. Vehicle scheduling
Performance Measures What you measure is what you get Performance measures strongly affect the behavior of managers and employees Tailor your performance measures to fit company’s mission and strategy Over-reliance of a single measure might be detrimental to company’s long-term survivability
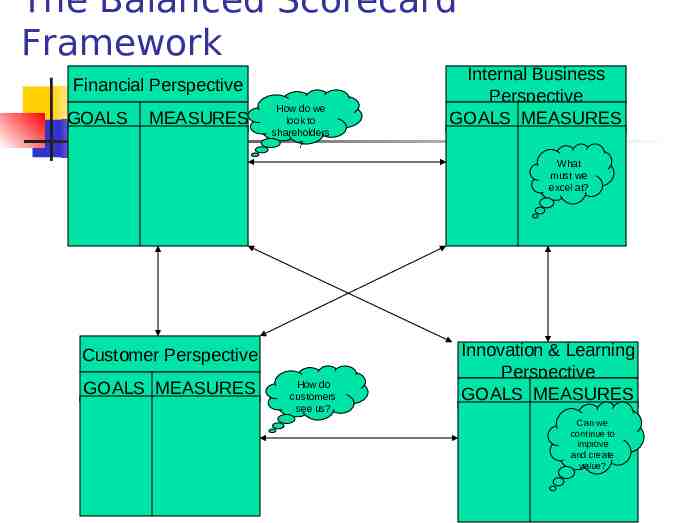
The Balanced Scorecard Framework Financial Perspective GOALS MEASURES How do we look to shareholders ? Internal Business Perspective GOALS MEASURES What must we excel at? Customer Perspective GOALS MEASURES How do customers see us? Innovation & Learning Perspective GOALS MEASURES Can we continue to improve and create value?
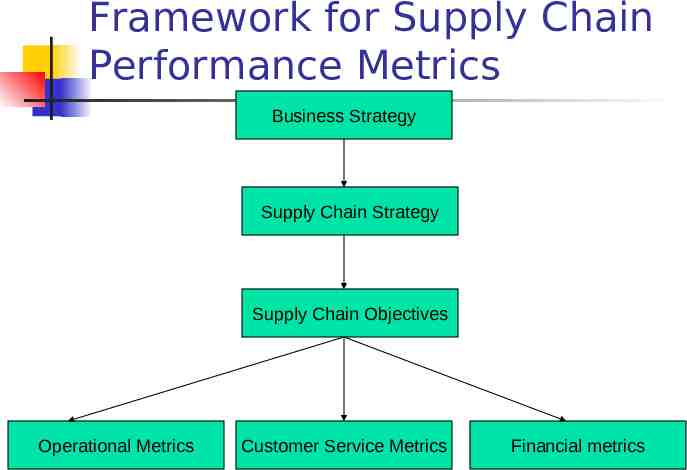
Framework for Supply Chain Performance Metrics Business Strategy Supply Chain Strategy Supply Chain Objectives Operational Metrics Customer Service Metrics Financial metrics
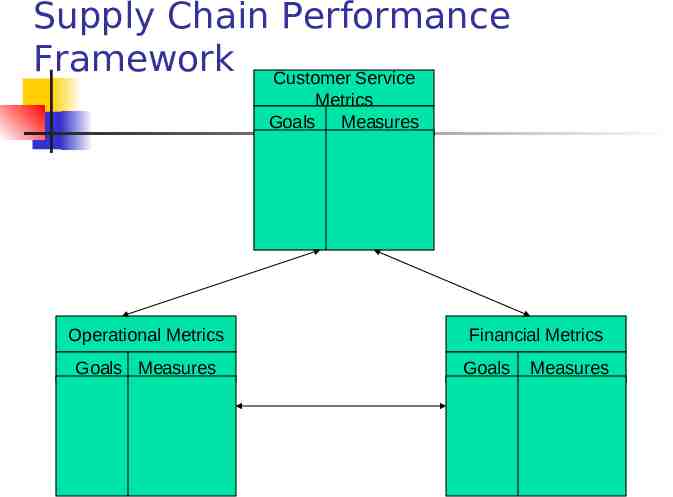
Supply Chain Performance Framework Customer Service Metrics Goals Measures Operational Metrics Goals Measures Financial Metrics Goals Measures
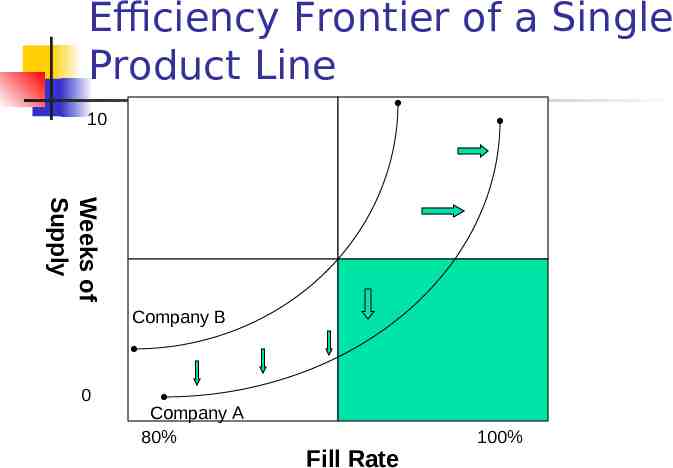
Efficiency Frontier of a Single Product Line 10 Weeks of Supply Company B 0 Company A 80% Fill Rate 100%
Critical Factors in SC Performance Metrics Establish performance objectives with customers in mind Consider using order windows as the basis for order fulfillment metrics Reflect reliability issues in the metrics they choose Implement metrics consistently throughout the supply chain Aggregate results as they move up the chain
Critical Factors in SC Performance Metrics (cont’d) Apply process control techniques to the business process Avoid pitting players in the systems against one another Collect only data you really intend to use Communicate the actions and rational to everyone
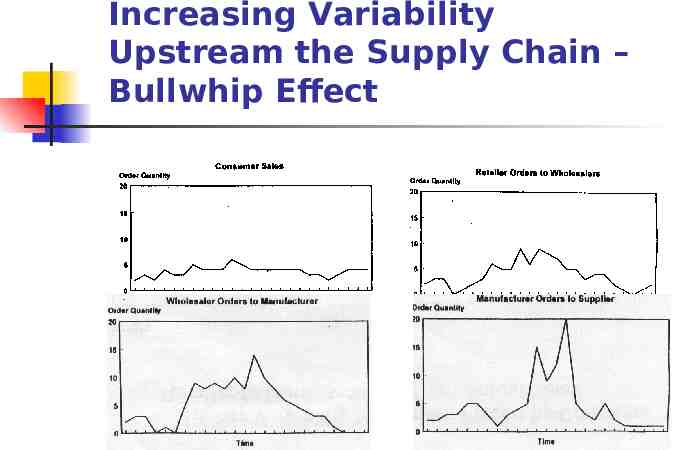
Bullwhip Effect Increasing propagation of variability upstream through the supply chain
Increasing Variability Upstream the Supply Chain – Bullwhip Effect
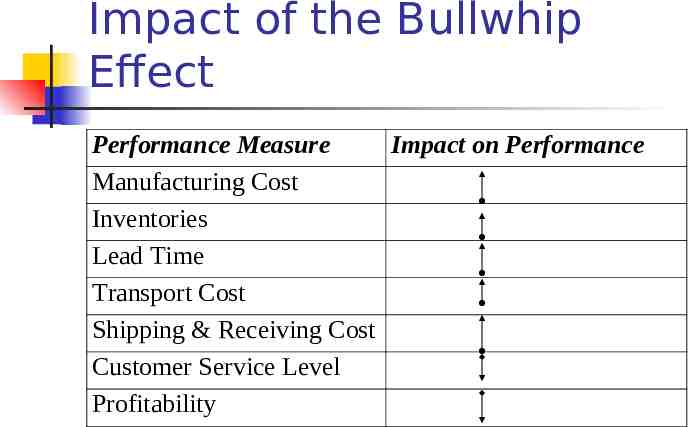
Impact of the Bullwhip Effect Performance Measure Impact on Performance Manufacturing Cost Inventories Lead Time Transport Cost Shipping & Receiving Cost Customer Service Level Profitability
What are the Causes . Demand forecasting Long cycle times Min-max inventory level Order-up-to level orders increase more than forecasts Long lead times magnify this effect Impact on safety stock Product life cycle Batch ordering Volume & transportation discount
What are the Causes . Price fluctuation Promotional sales Forward buying Inflated orders Orders placed increase during shortage periods IBM Aptiva orders increased by 2-3 times when retailers thought that IBM would be out of stock over Christmas
Ways to Cope with the Bullwhip Effect Reducing uncertainty Centralizing demand information Bullwhip inherent in use of various forecasting techniques Reducing variability Use of EDLP strategy (Payless)
Ways to Cope with the Bullwhip Effect (cont’d) Lead time reduction Order lead time (time to produce and ship) Information lead time (time to process order) Efficient network distribution design Strategic partnership Vendor managed inventory (VMI) Sharing of customer information Collaborative forecasting
Presentations/Case Studies/Game Accenture – 3G Wireless communication Army Logistics Operations Payless ShoeSource – Supply Chain Seven Eleven Japan Li & Fung Internet Beer Game