DATA VISUALIZATION USING POWER BI HOW TO CONNECT MICROSOFT FORMS


14 Slides3.06 MB
DATA VISUALIZATION USING POWER BI HOW TO CONNECT MICROSOFT FORMS TO POWER BI PROF. BHAVANA KANAWADE DEPARTMENT OF INFORMATION TECHNOLOGY INTERNATIONAL INSTITUTE OF INFORMATION TECHNOLOGY,I2IT www.isquareit.edu.in
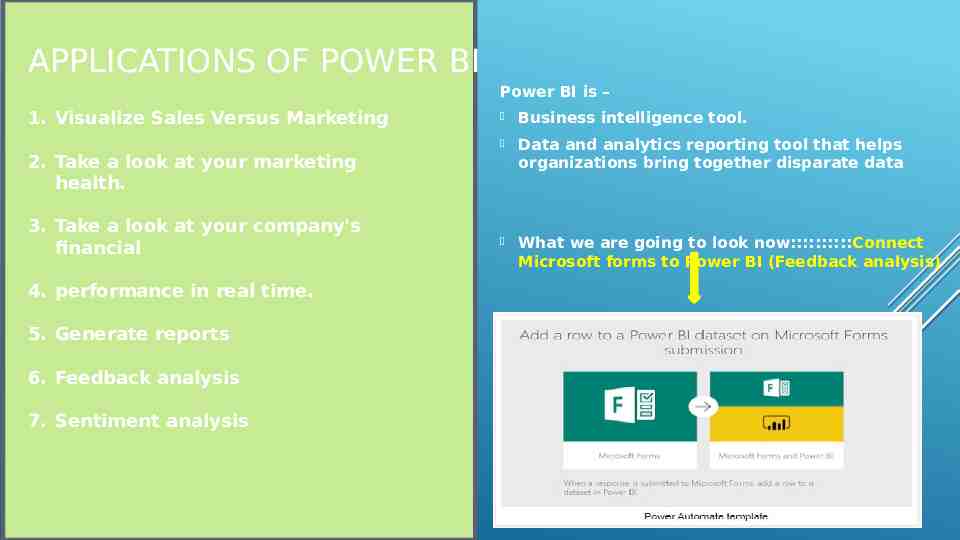
APPLICATIONS OF POWER BI Power BI is – 1. Visualize Sales Versus Marketing Business intelligence tool. Data and analytics reporting tool that helps organizations bring together disparate data What we are going to look now::::::::::Connect Microsoft forms to Power BI (Feedback analysis) 2. Take a look at your marketing health. 3. Take a look at your company's financial 4. performance in real time. 5. Generate reports 6. Feedback analysis 7. Sentiment analysis
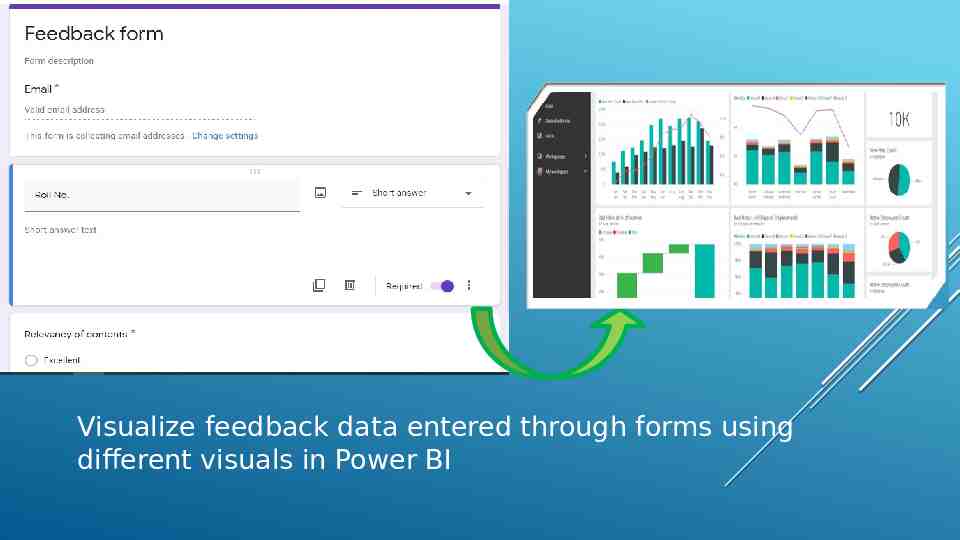
Visualize feedback data entered through forms using different visuals in Power BI
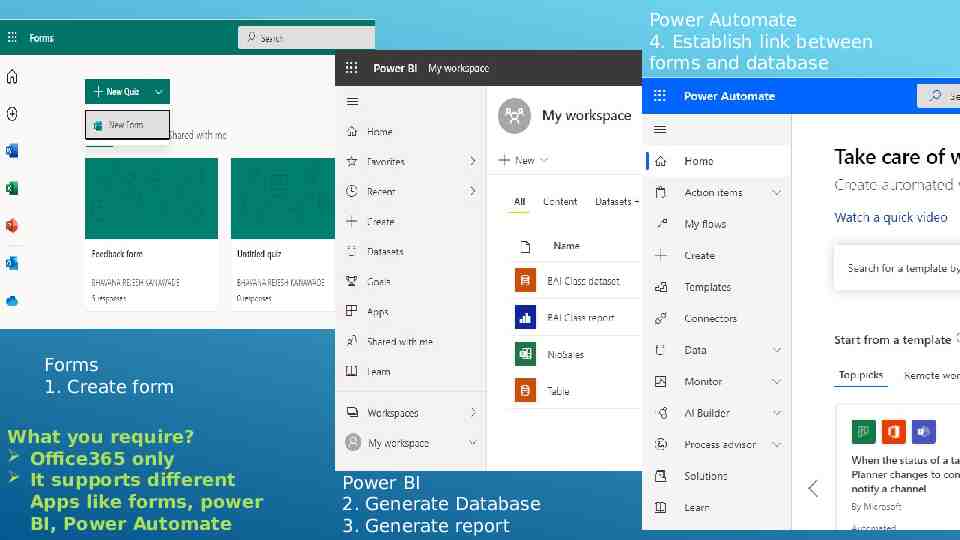
Power Automate 4. Establish link between forms and database Forms 1. Create form What you require? Office365 only It supports different Apps like forms, power BI, Power Automate Power BI 2. Generate Database 3. Generate report
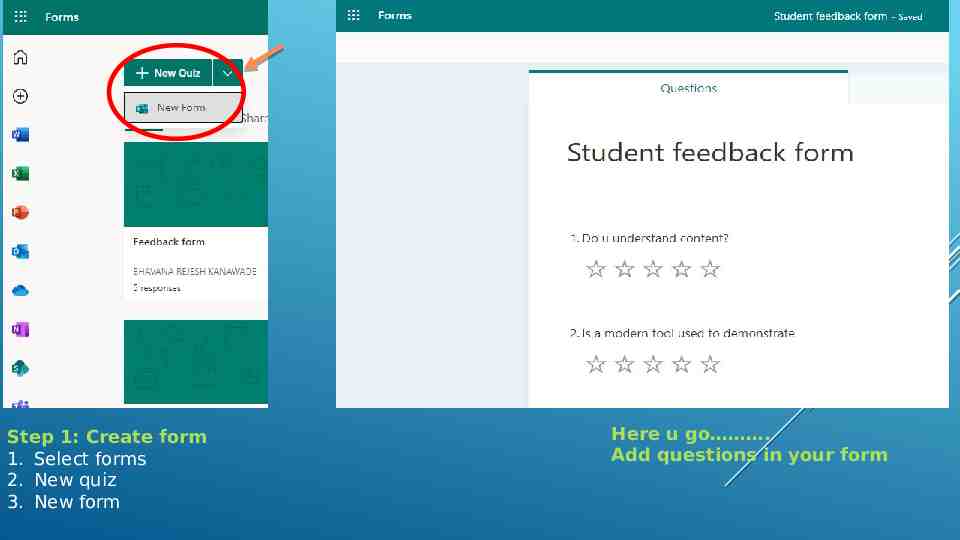
Step 1: Create form 1. Select forms 2. New quiz 3. New form Here u go . Add questions in your form
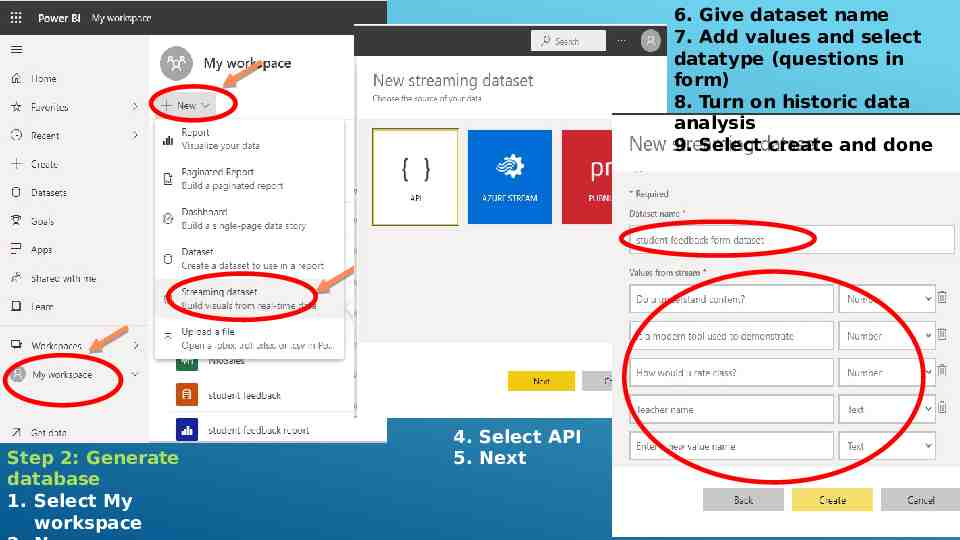
6. Give dataset name 7. Add values and select datatype (questions in form) 8. Turn on historic data analysis 9. Select create and done Step 2: Generate database 1. Select My workspace 4. Select API 5. Next
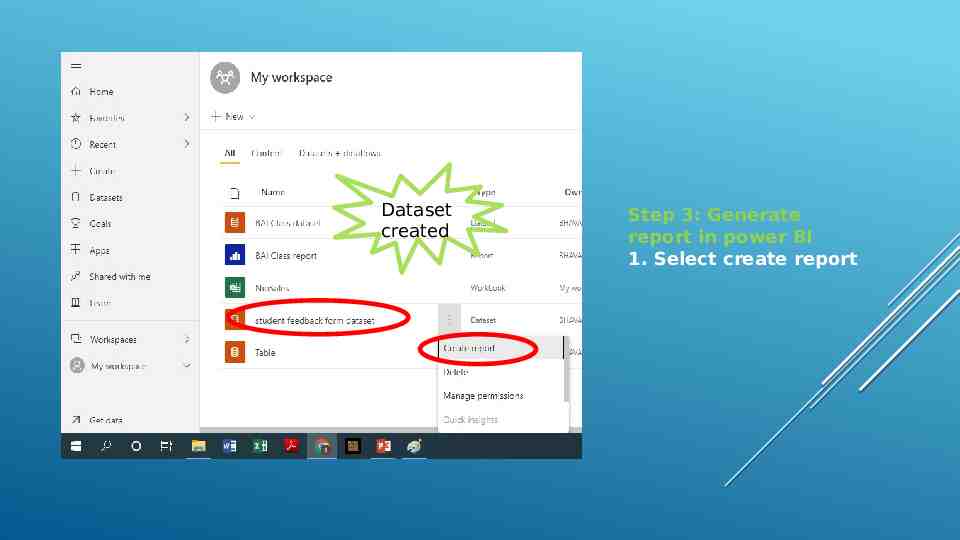
Dataset created Step 3: Generate report in power BI 1. Select create report
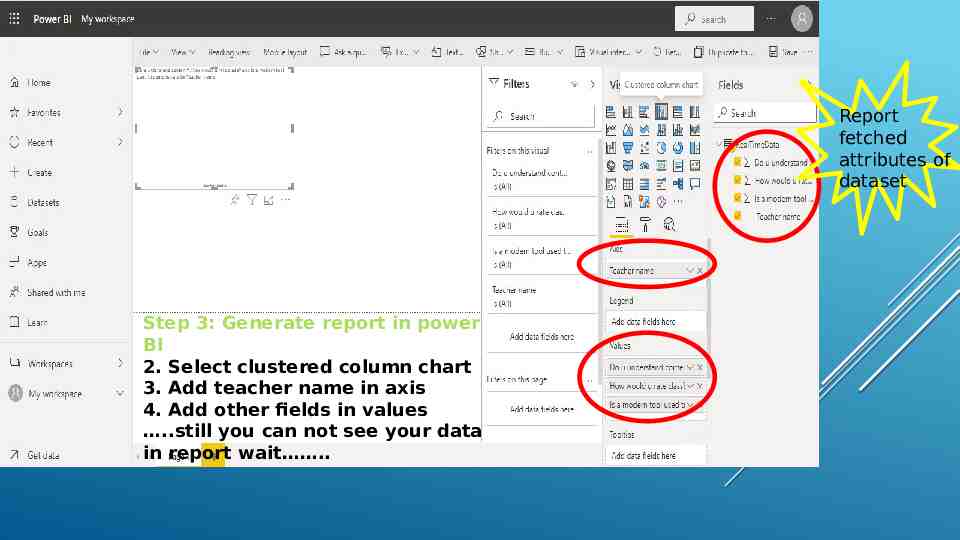
Report fetched attributes of dataset Step 3: Generate report in power BI 2. Select clustered column chart 3. Add teacher name in axis 4. Add other fields in values .still you can not see your data in report wait .
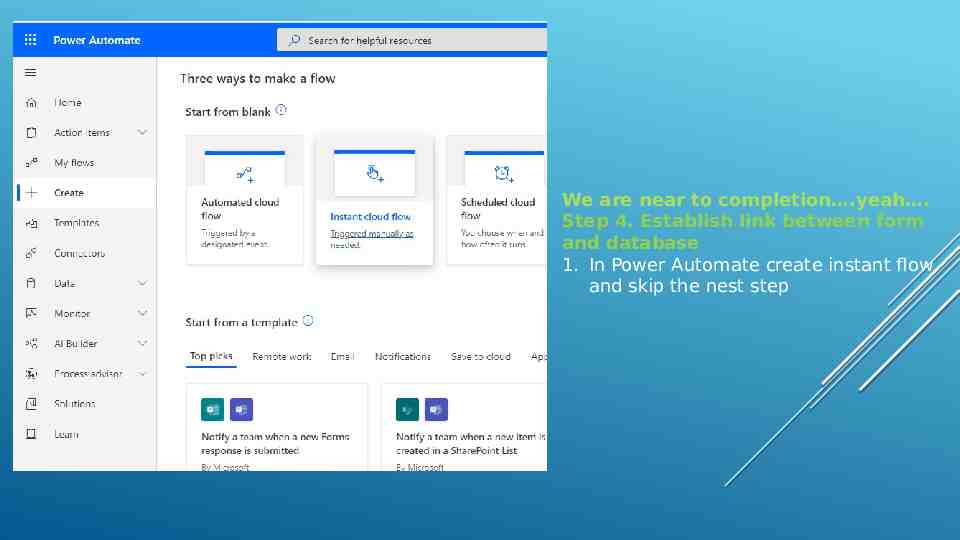
We are near to completion .yeah . Step 4. Establish link between form and database 1. In Power Automate create instant flow and skip the nest step
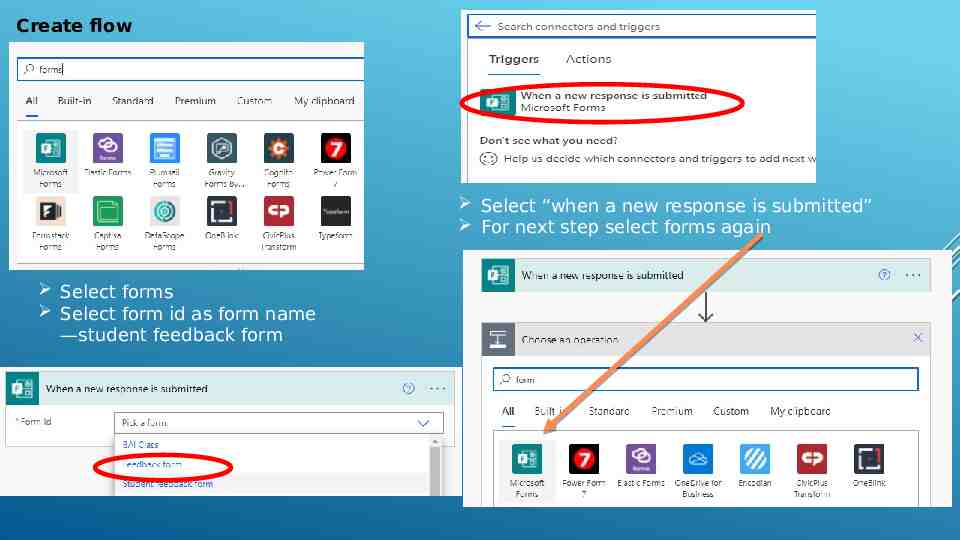
Create flow Select “when a new response is submitted” For next step select forms again Select forms Select form id as form name —student feedback form
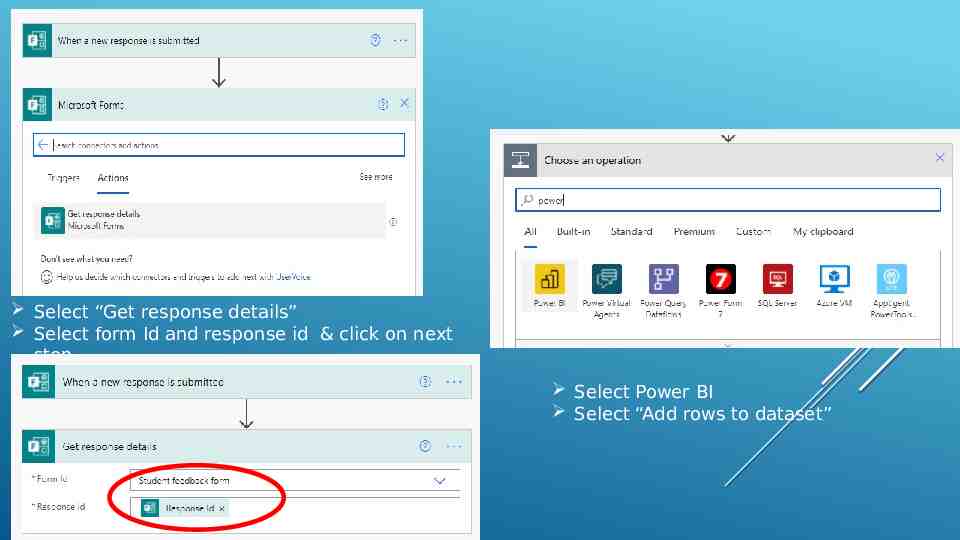
Select “Get response details” Select form Id and response id & click on next step Select Power BI Select “Add rows to dataset”
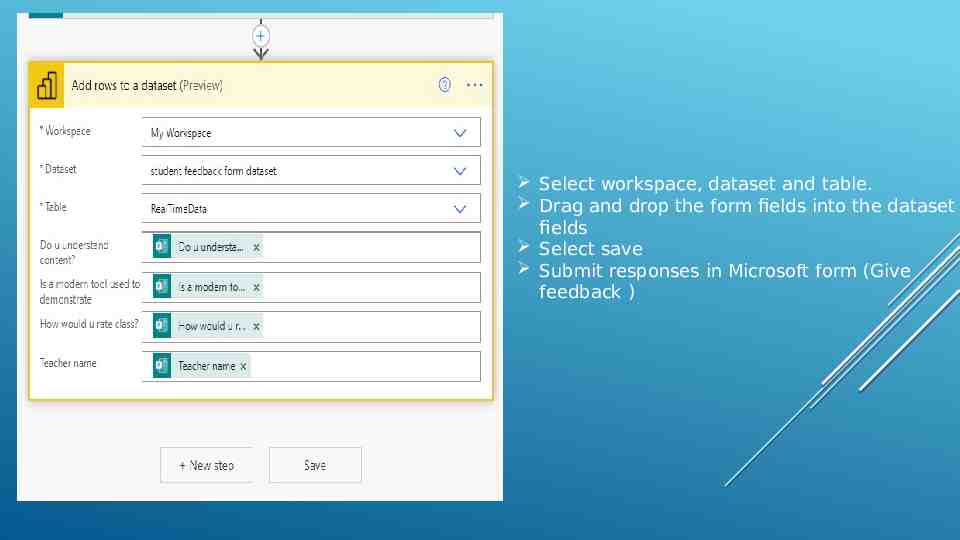
Select workspace, dataset and table. Drag and drop the form fields into the dataset fields Select save Submit responses in Microsoft form (Give feedback )
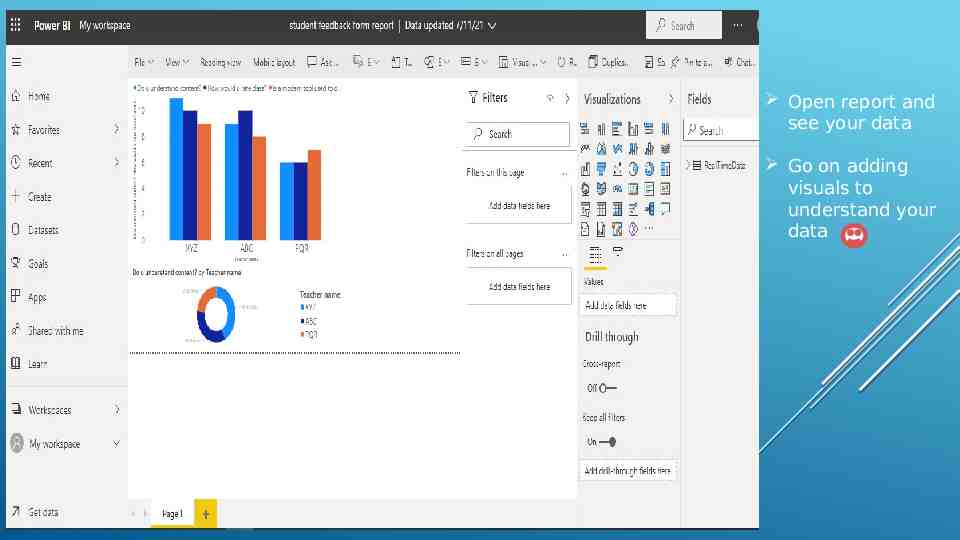
Open report and see your data Go on adding visuals to understand your data
THANK YOU International Institute of Information Technology, I²IT, P-14, Rajiv Gandhi Infotech Park, Hinjawadi Phase 1, Pune - 411 057 Phone - 91 20 22933441/2/3 Website - www.isquareit.edu.in Email - [email protected]