Census Bureau’s Proposed Urban Area Delineation Changes and Potential


47 Slides5.56 MB
Census Bureau’s Proposed Urban Area Delineation Changes and Potential Implications Texas Demographic Conference 2021 Annual Data Users Conference June 10, 2021
Agenda Overview of the Census Urban Area boundary process Summary of the proposed changes Discussion of potential impacts and uncertainties Summary and resources Questions & answers Source: U.S. Census Bureau. 2010 and 2020 Census Count
Census Urban Area Boundary Process
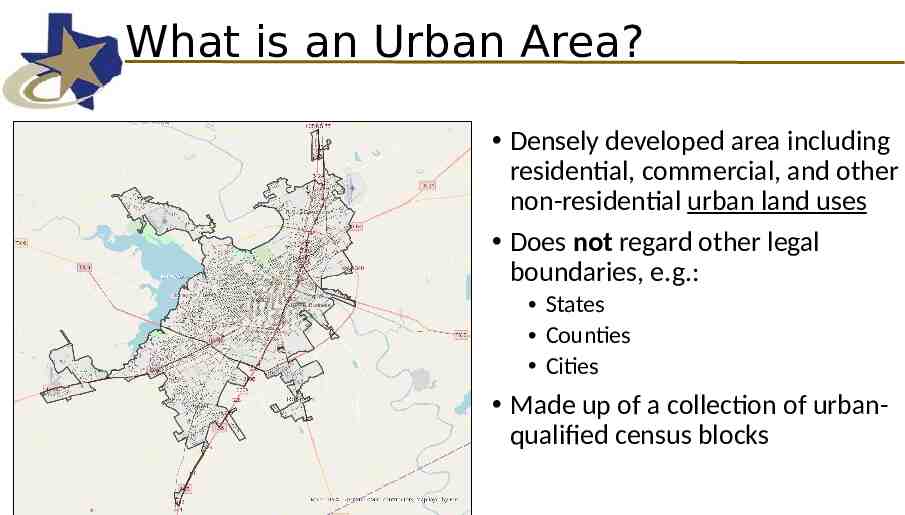
What is an Urban Area? Densely developed area including residential, commercial, and other non-residential urban land uses Does not regard other legal boundaries, e.g.: States Counties Cities Made up of a collection of urbanqualified census blocks
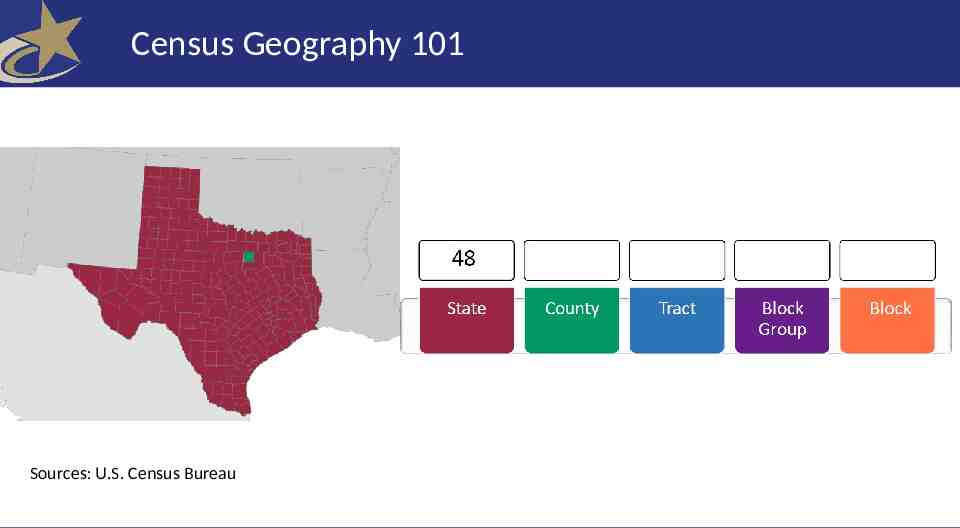
What is a Census Block? Blocks are the smallest geography and analytical unit used by the Census Bureau Similar to a city or neighborhood block in size and delineation Visualization of the Census Geography
Census Geography 101 Sources: U.S. Census Bureau
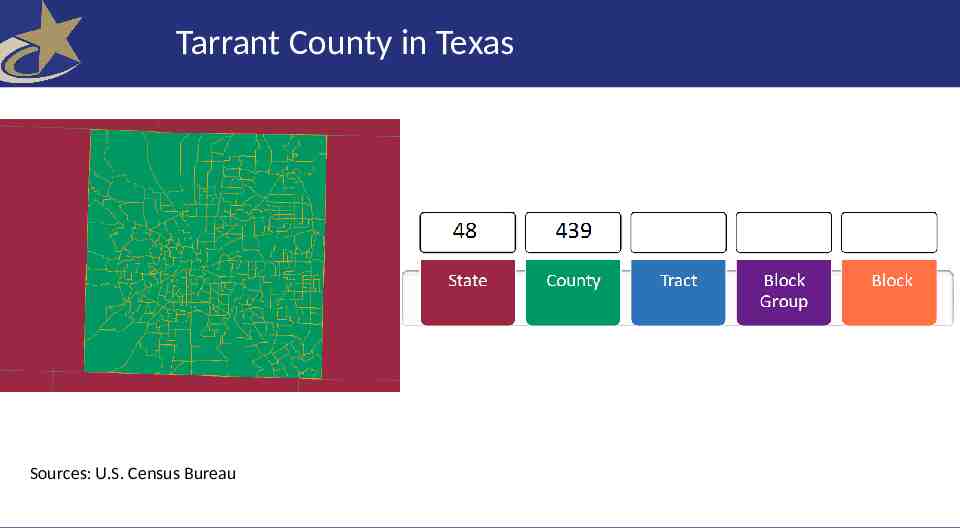
Tarrant County in Texas Sources: U.S. Census Bureau
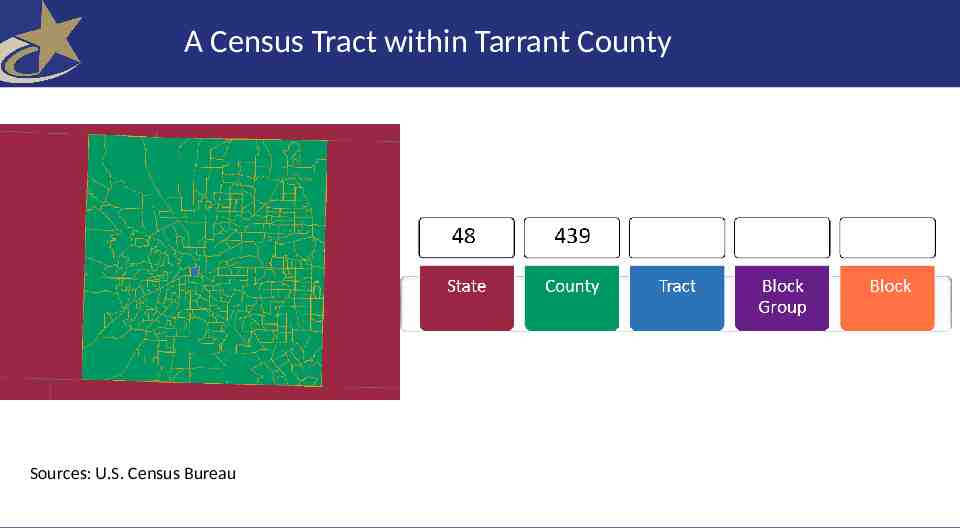
A Census Tract within Tarrant County Sources: U.S. Census Bureau
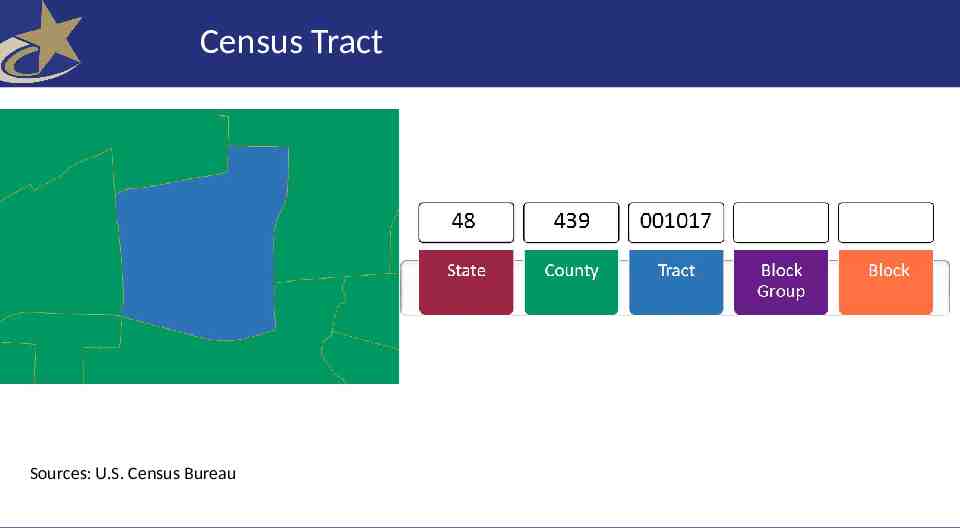
Census Tract Sources: U.S. Census Bureau
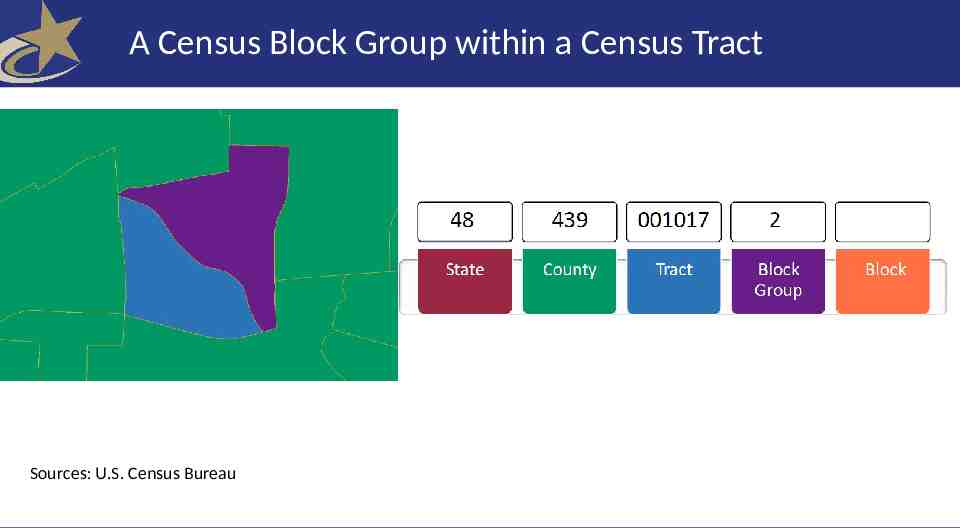
A Census Block Group within a Census Tract Sources: U.S. Census Bureau
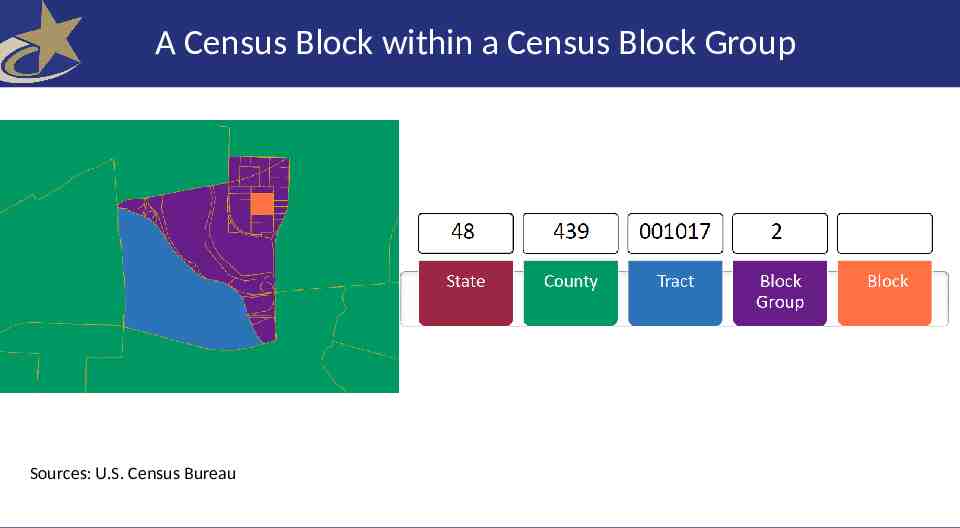
A Census Block within a Census Block Group Sources: U.S. Census Bureau
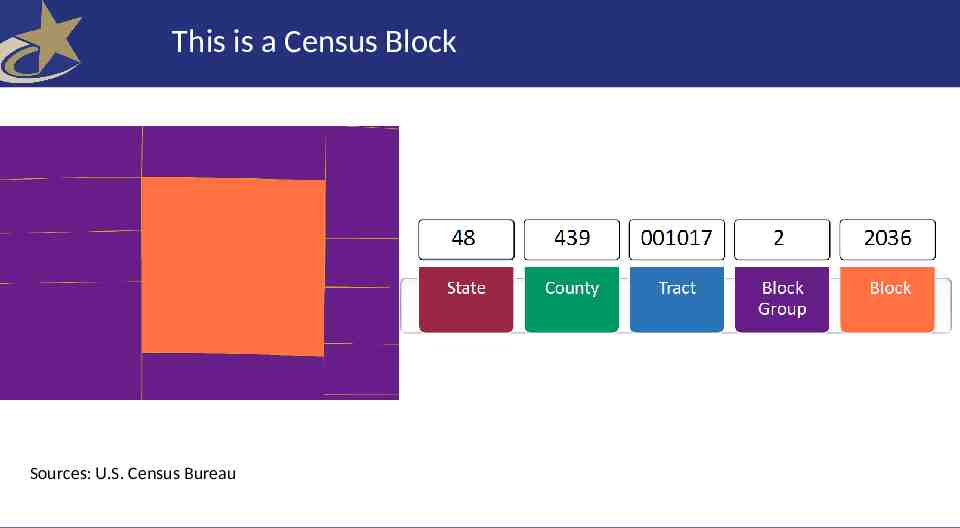
This is a Census Block Sources: U.S. Census Bureau
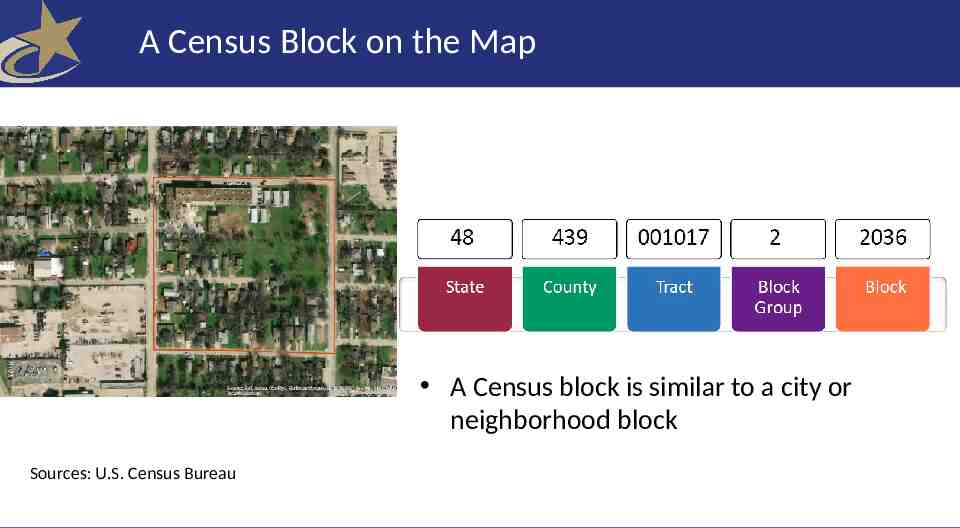
A Census Block on the Map A Census block is similar to a city or neighborhood block Sources: U.S. Census Bureau
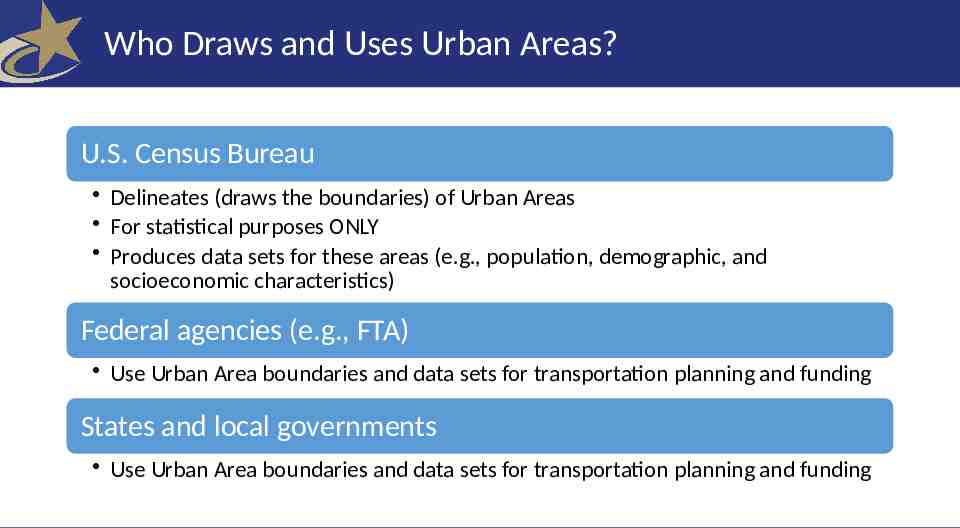
Who Draws and Uses Urban Areas? U.S. Census Bureau Delineates (draws the boundaries) of Urban Areas For statistical purposes ONLY Produces data sets for these areas (e.g., population, demographic, and socioeconomic characteristics) Federal agencies (e.g., FTA) Use Urban Area boundaries and data sets for transportation planning and funding States and local governments Use Urban Area boundaries and data sets for transportation planning and funding
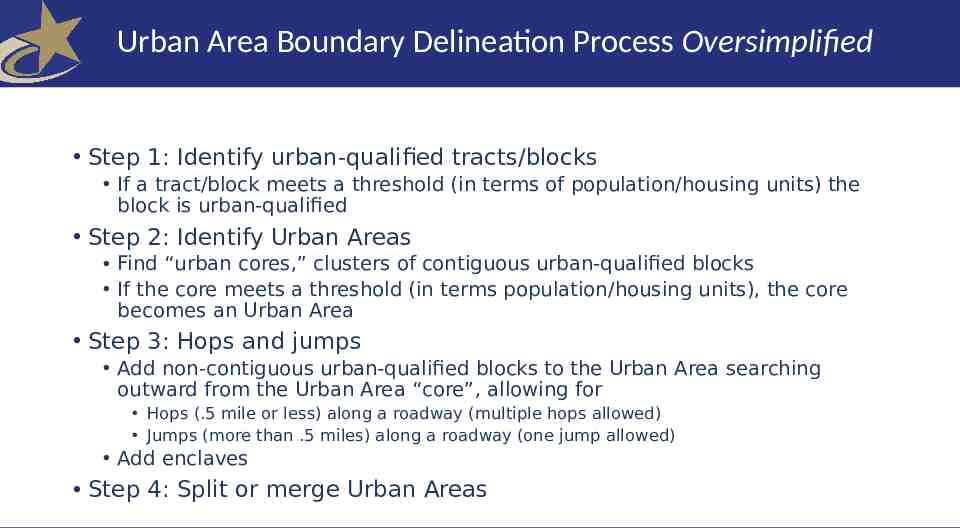
Urban Area Boundary Delineation Process Oversimplified Step 1: Identify urban-qualified tracts/blocks If a tract/block meets a threshold (in terms of population/housing units) the block is urban-qualified Step 2: Identify Urban Areas Find “urban cores,” clusters of contiguous urban-qualified blocks If the core meets a threshold (in terms population/housing units), the core becomes an Urban Area Step 3: Hops and jumps Add non-contiguous urban-qualified blocks to the Urban Area searching outward from the Urban Area “core”, allowing for Hops (.5 mile or less) along a roadway (multiple hops allowed) Jumps (more than .5 miles) along a roadway (one jump allowed) Add enclaves Step 4: Split or merge Urban Areas
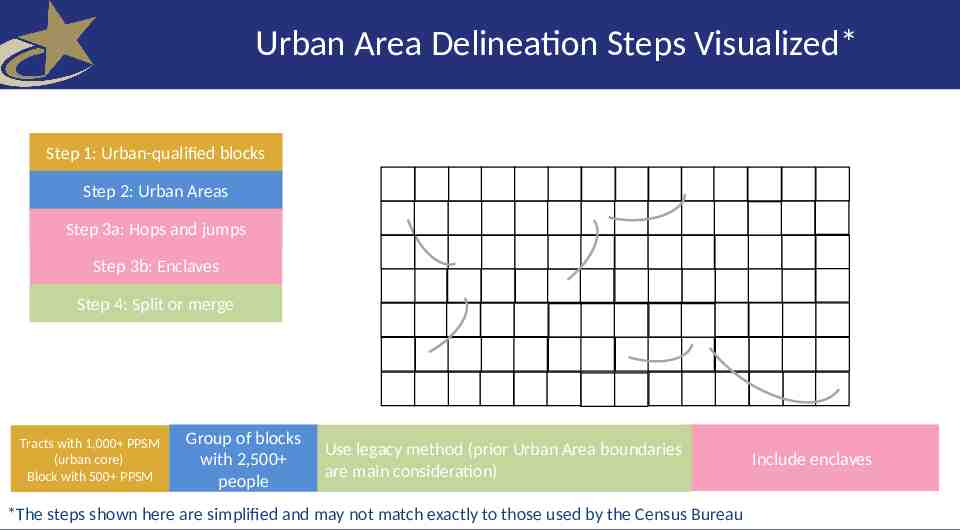
Urban Area Delineation Steps Visualized* Step 1: Urban-qualified blocks Step 2: Urban Areas Step 3a: Hops and jumps Step 3b: Enclaves Step 4: Split or merge Tracts with 1,000 PPSM (urban core) Block with 500 PPSM Group of blocks with 2,500 people Hops mile)(prior and jumps toboundaries 2.5 miles) Use legacy( 0.5 method Urban(up Area main Include low-density blocks in corridor are consideration) *The steps shown here are simplified and may not match exactly to those used by the Census Bureau Include enclaves
Proposed Changes
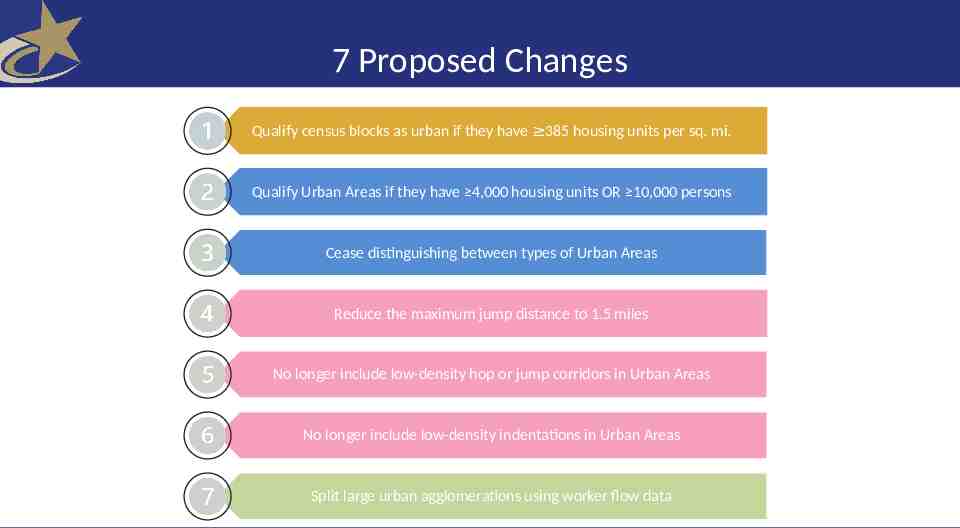
7 Proposed Changes Qualify census blocks as urban if they have 385 housing units per sq. mi. Qualify Urban Areas if they have 4,000 housing units OR 10,000 persons Cease distinguishing between types of Urban Areas Reduce the maximum jump distance to 1.5 miles No longer include low-density hop or jump corridors in Urban Areas No longer include low-density indentations in Urban Areas Split large urban agglomerations using worker flow data
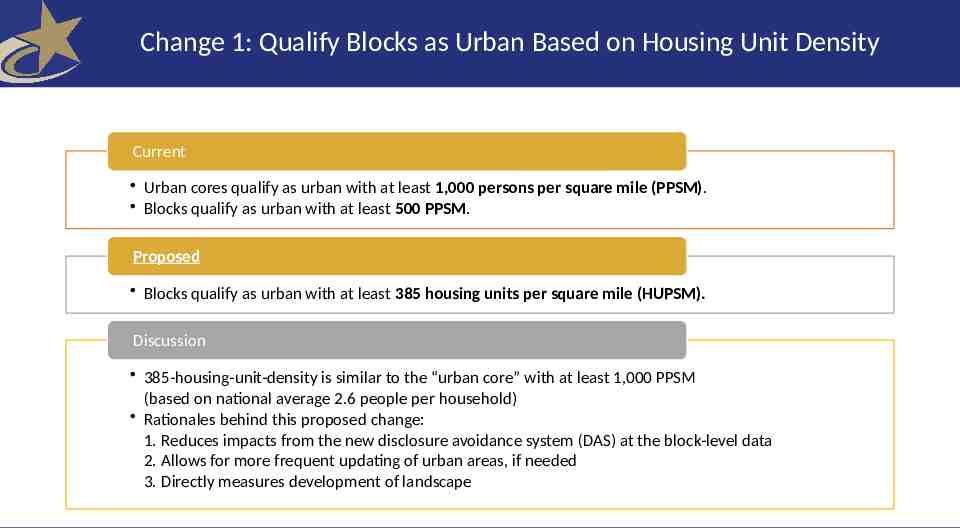
Change 1: Qualify Blocks as Urban Based on Housing Unit Density Current Urban cores qualify as urban with at least 1,000 persons per square mile (PPSM). Blocks qualify as urban with at least 500 PPSM. Proposed Blocks qualify as urban with at least 385 housing units per square mile (HUPSM). Discussion 385-housing-unit-density is similar to the “urban core” with at least 1,000 PPSM (based on national average 2.6 people per household) Rationales behind this proposed change: 1. Reduces impacts from the new disclosure avoidance system (DAS) at the block-level data 2. Allows for more frequent updating of urban areas, if needed 3. Directly measures development of landscape
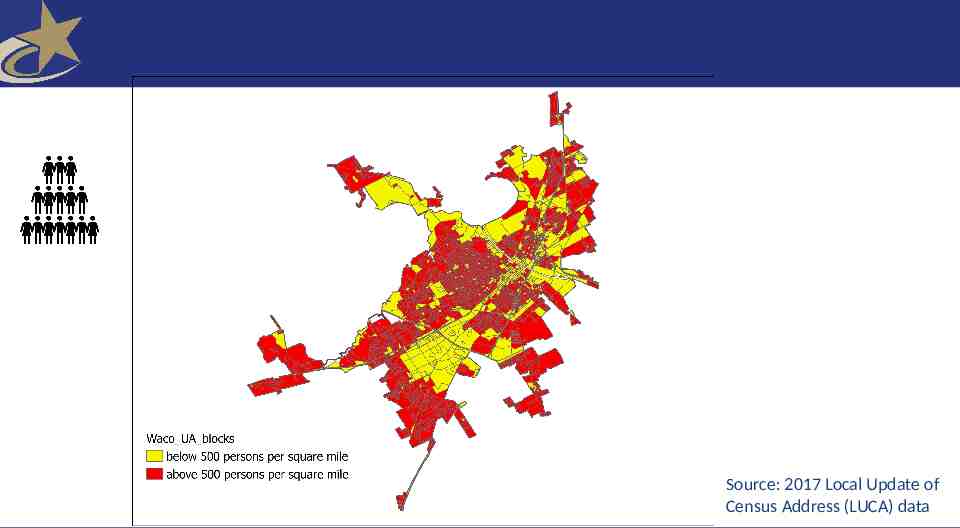
Source: 2017 Local Update of Census Address (LUCA) data
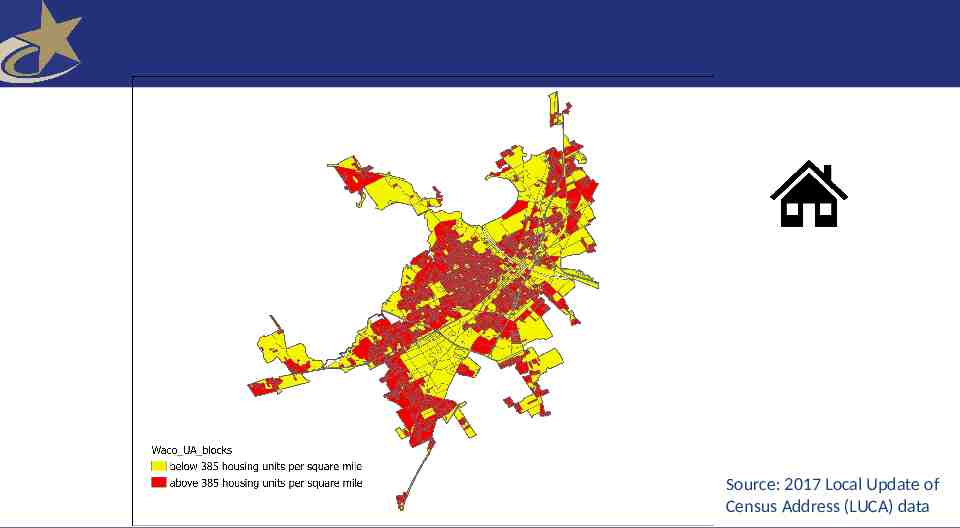
Source: 2017 Local Update of Census Address (LUCA) data
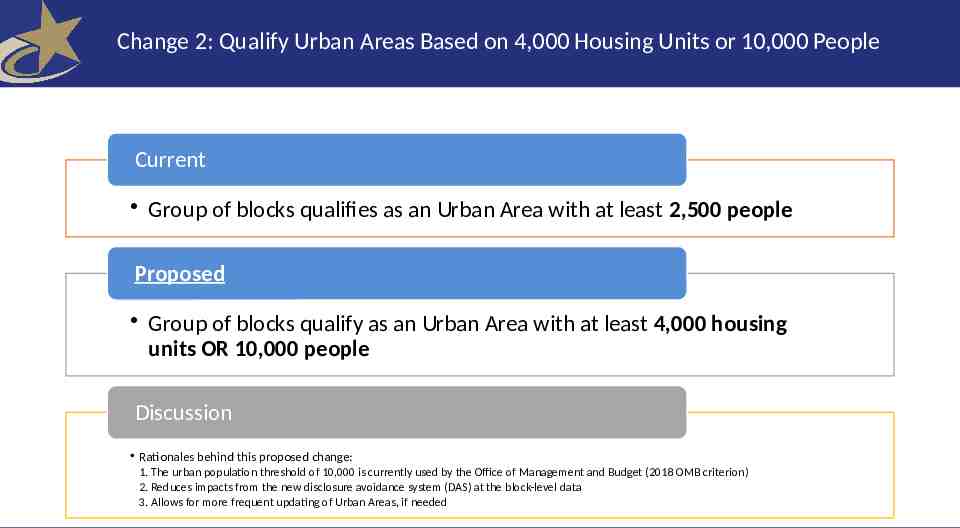
Change 2: Qualify Urban Areas Based on 4,000 Housing Units or 10,000 People Current Group of blocks qualifies as an Urban Area with at least 2,500 people Proposed Group of blocks qualify as an Urban Area with at least 4,000 housing units OR 10,000 people Discussion Rationales behind this proposed change: 1. The urban population threshold of 10,000 is currently used by the Office of Management and Budget (2018 OMB criterion) 2. Reduces impacts from the new disclosure avoidance system (DAS) at the block-level data 3. Allows for more frequent updating of Urban Areas, if needed
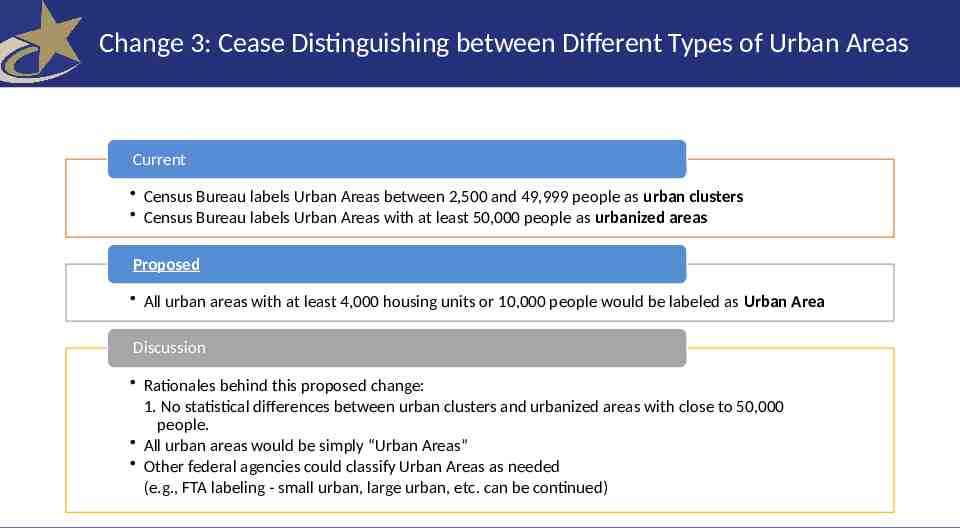
Change 3: Cease Distinguishing between Different Types of Urban Areas Current Census Bureau labels Urban Areas between 2,500 and 49,999 people as urban clusters Census Bureau labels Urban Areas with at least 50,000 people as urbanized areas Proposed All urban areas with at least 4,000 housing units or 10,000 people would be labeled as Urban Area Discussion Rationales behind this proposed change: 1. No statistical differences between urban clusters and urbanized areas with close to 50,000 people. All urban areas would be simply “Urban Areas” Other federal agencies could classify Urban Areas as needed (e.g., FTA labeling - small urban, large urban, etc. can be continued)
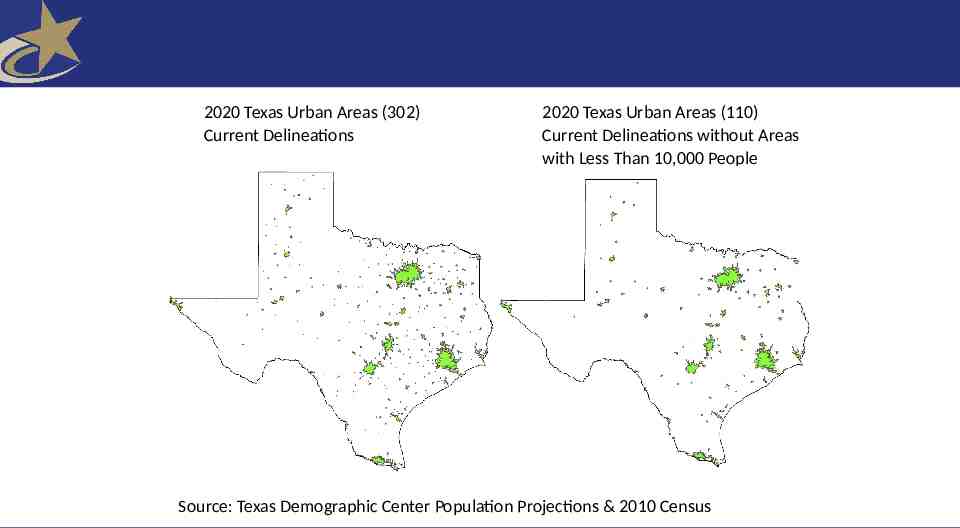
2020 Texas Urban Areas (302) Current Delineations 2020 Texas Urban Areas (110) Current Delineations without Areas with Less Than 10,000 People Source: Texas Demographic Center Population Projections & 2010 Census
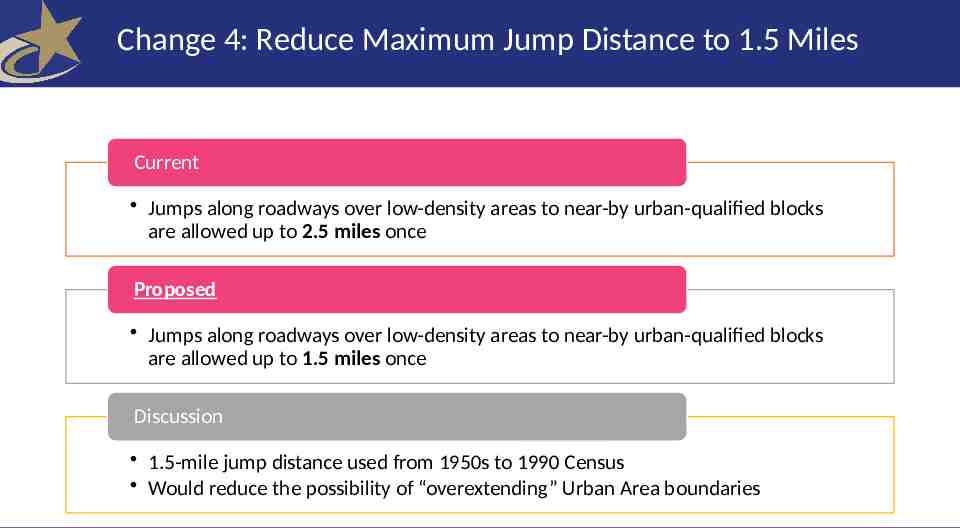
Change 4: Reduce Maximum Jump Distance to 1.5 Miles Current Jumps along roadways over low-density areas to near-by urban-qualified blocks are allowed up to 2.5 miles once Proposed Jumps along roadways over low-density areas to near-by urban-qualified blocks are allowed up to 1.5 miles once Discussion 1.5-mile jump distance used from 1950s to 1990 Census Would reduce the possibility of “overextending” Urban Area boundaries
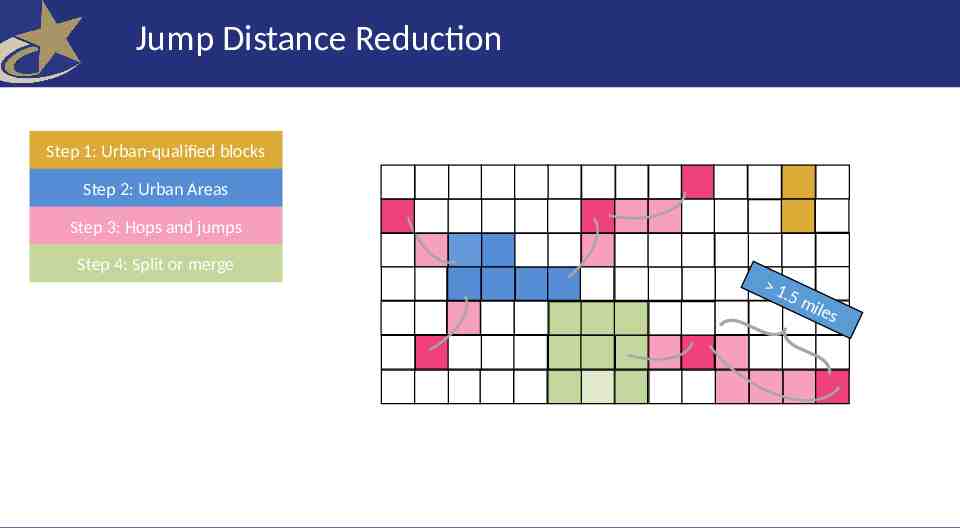
Jump Distance Reduction Step 1: Urban-qualified blocks Step 2: Urban Areas Step 3: Hops and jumps Step 4: Split or merge 1 .5 m iles
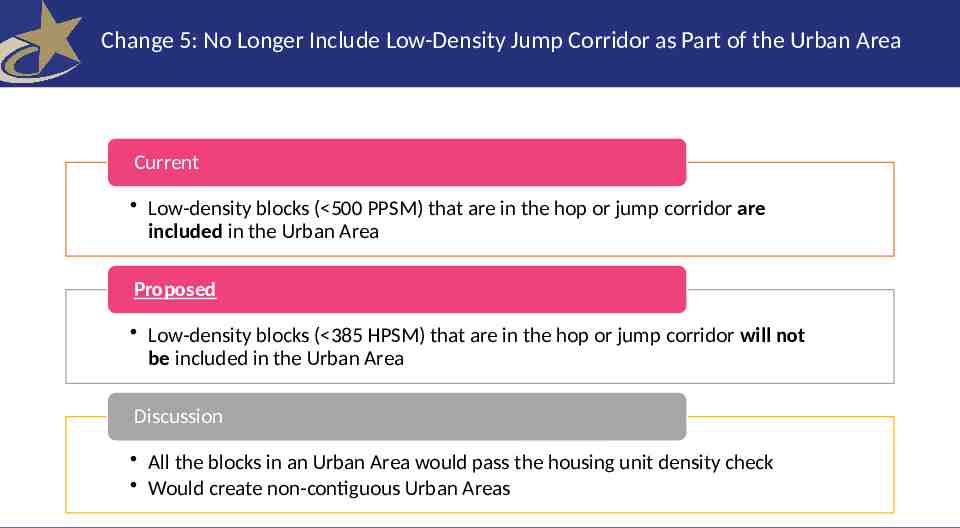
Change 5: No Longer Include Low-Density Jump Corridor as Part of the Urban Area Current Low-density blocks ( 500 PPSM) that are in the hop or jump corridor are included in the Urban Area Proposed Low-density blocks ( 385 HPSM) that are in the hop or jump corridor will not be included in the Urban Area Discussion All the blocks in an Urban Area would pass the housing unit density check Would create non-contiguous Urban Areas
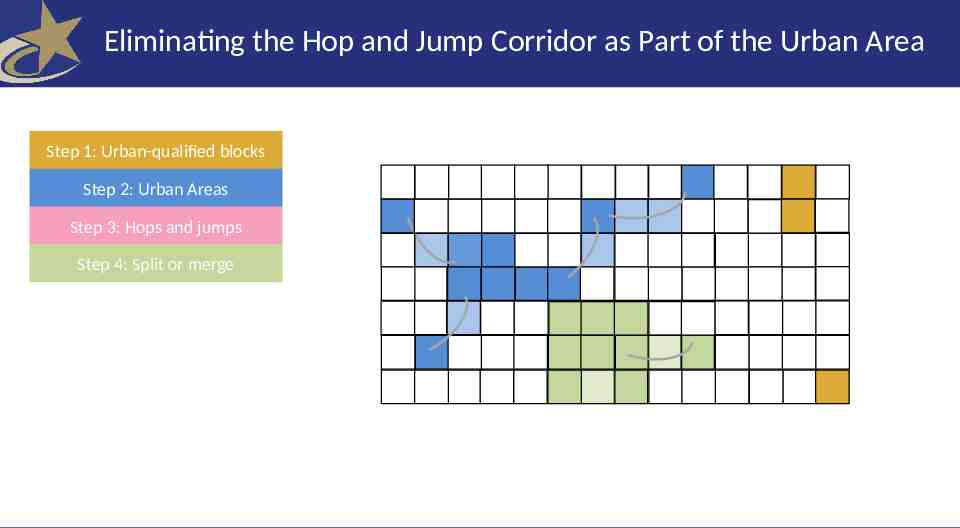
Eliminating the Hop and Jump Corridor as Part of the Urban Area Step 1: Urban-qualified blocks Step 2: Urban Areas Step 3: Hops and jumps Step 4: Split or merge
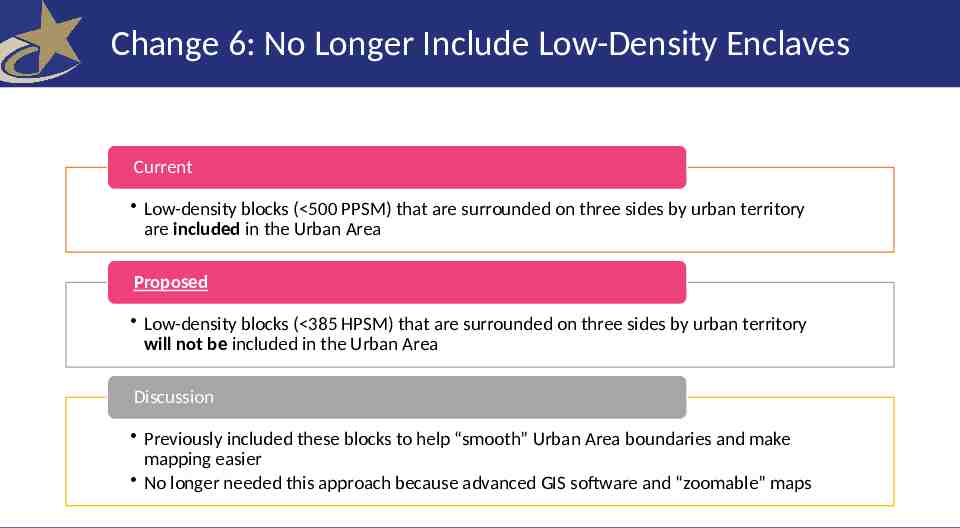
Change 6: No Longer Include Low-Density Enclaves Current Low-density blocks ( 500 PPSM) that are surrounded on three sides by urban territory are included in the Urban Area Proposed Low-density blocks ( 385 HPSM) that are surrounded on three sides by urban territory will not be included in the Urban Area Discussion Previously included these blocks to help “smooth” Urban Area boundaries and make mapping easier No longer needed this approach because advanced GIS software and “zoomable” maps
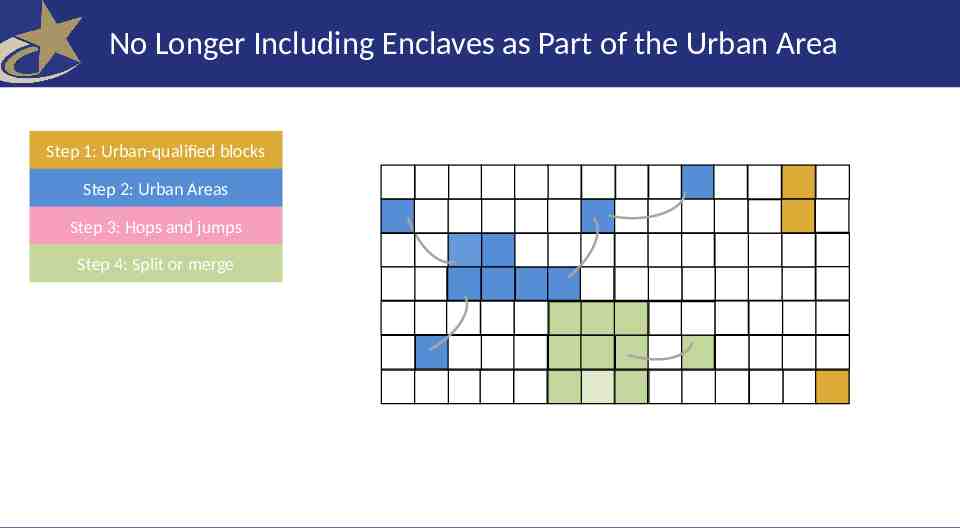
No Longer Including Enclaves as Part of the Urban Area Step 1: Urban-qualified blocks Step 2: Urban Areas Step 3: Hops and jumps Step 4: Split or merge
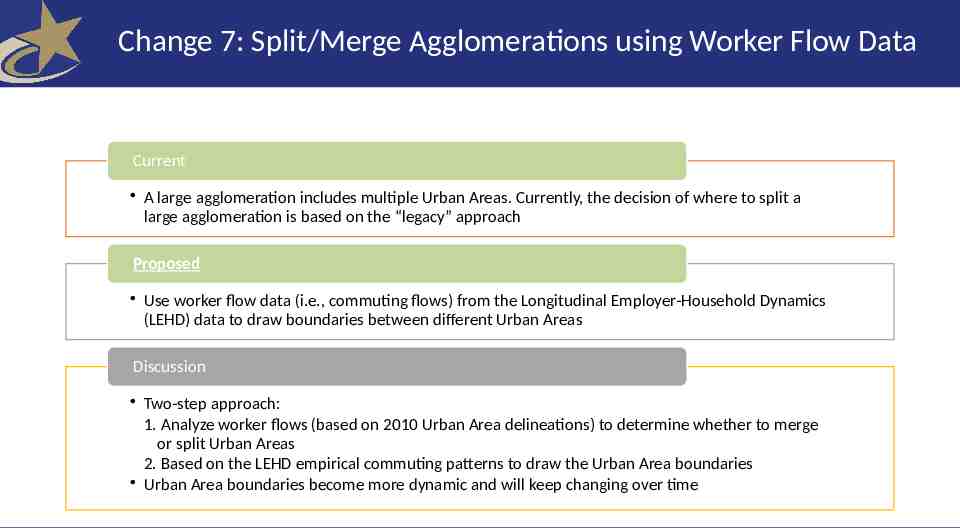
Change 7: Split/Merge Agglomerations using Worker Flow Data Current A large agglomeration includes multiple Urban Areas. Currently, the decision of where to split a large agglomeration is based on the “legacy” approach Proposed Use worker flow data (i.e., commuting flows) from the Longitudinal Employer-Household Dynamics (LEHD) data to draw boundaries between different Urban Areas Discussion Two-step approach: 1. Analyze worker flows (based on 2010 Urban Area delineations) to determine whether to merge or split Urban Areas 2. Based on the LEHD empirical commuting patterns to draw the Urban Area boundaries Urban Area boundaries become more dynamic and will keep changing over time
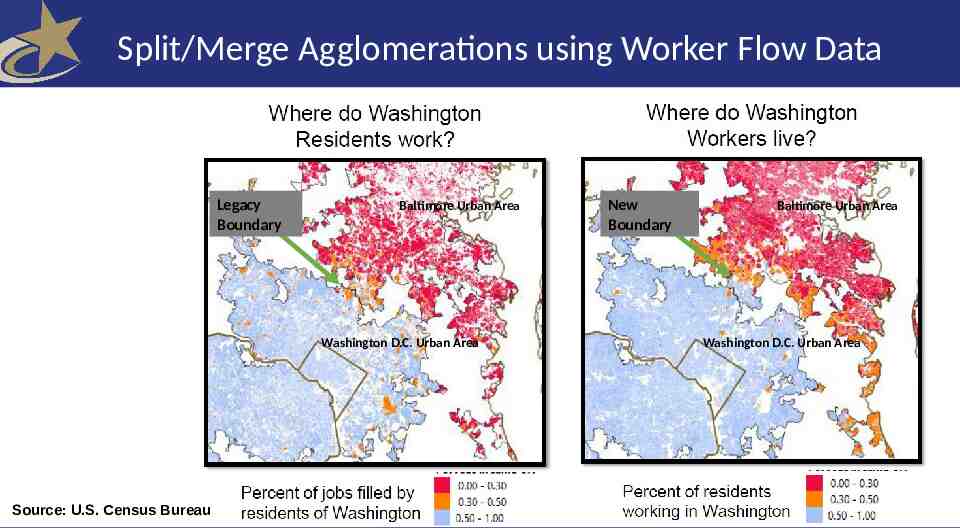
Split/Merge Agglomerations using Worker Flow Data Legacy Boundary Baltimore Urban Area Washington D.C. Urban Area Source: U.S. Census Bureau New Boundary Baltimore Urban Area Washington D.C. Urban Area
Potential Impacts
“Higher Bar” Impacts Qualifying census blocks as urban 385 housing units per square mile based on prior urban CORE criteria of 1,000 persons per square mile Sets a higher bar for urban block qualification
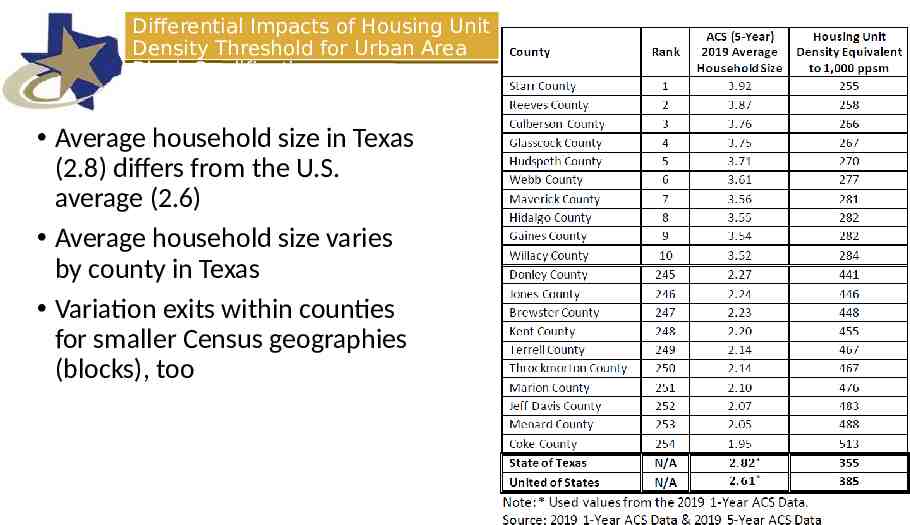
Differential Impacts of Housing Unit Density Threshold for Urban Area Block Qualification Average household size in Texas (2.8) differs from the U.S. average (2.6) Average household size varies by county in Texas Variation exits within counties for smaller Census geographies (blocks), too
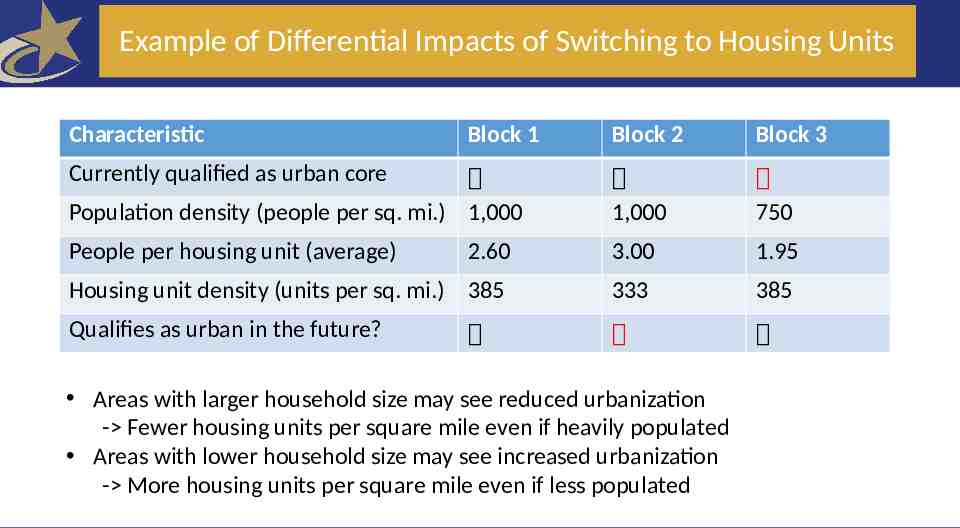
Example of Differential Impacts of Switching to Housing Units Characteristic Block 1 Block 2 Block 3 Population density (people per sq. mi.) 1,000 1,000 750 People per housing unit (average) 2.60 3.00 1.95 Housing unit density (units per sq. mi.) 385 333 385 Qualifies as urban in the future? Currently qualified as urban core Areas with larger household size may see reduced urbanization - Fewer housing units per square mile even if heavily populated Areas with lower household size may see increased urbanization - More housing units per square mile even if less populated
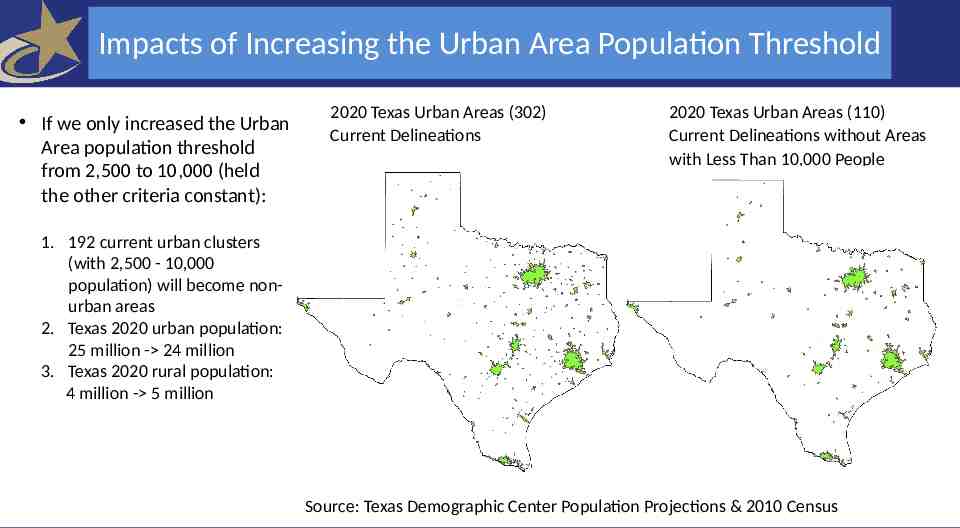
Impacts of Increasing the Urban Area Population Threshold If we only increased the Urban Area population threshold from 2,500 to 10,000 (held the other criteria constant): 2020 Texas Urban Areas (302) Current Delineations 2020 Texas Urban Areas (110) Current Delineations without Areas with Less Than 10,000 People 1. 192 current urban clusters (with 2,500 - 10,000 population) will become nonurban areas 2. Texas 2020 urban population: 25 million - 24 million 3. Texas 2020 rural population: 4 million - 5 million Source: Texas Demographic Center Population Projections & 2010 Census
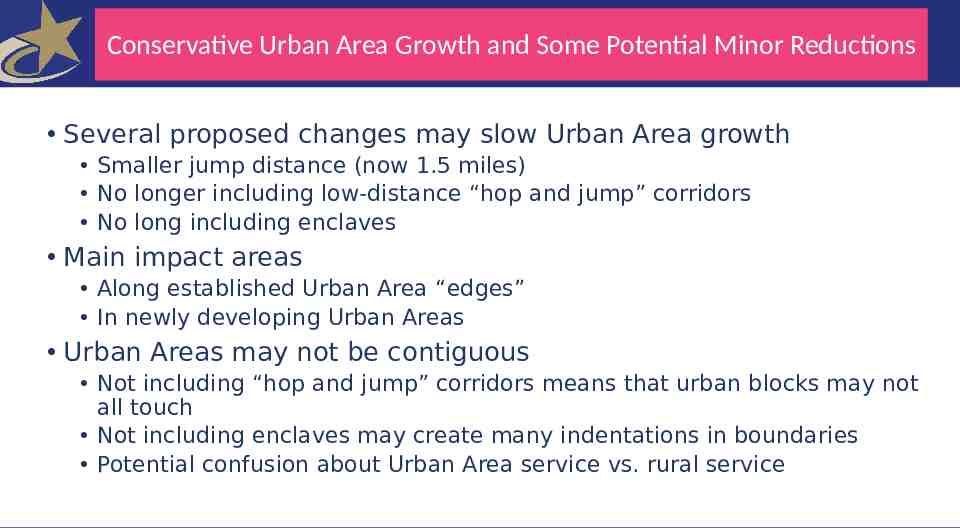
Conservative Urban Area Growth and Some Potential Minor Reductions Several proposed changes may slow Urban Area growth Smaller jump distance (now 1.5 miles) No longer including low-distance “hop and jump” corridors No long including enclaves Main impact areas Along established Urban Area “edges” In newly developing Urban Areas Urban Areas may not be contiguous Not including “hop and jump” corridors means that urban blocks may not all touch Not including enclaves may create many indentations in boundaries Potential confusion about Urban Area service vs. rural service
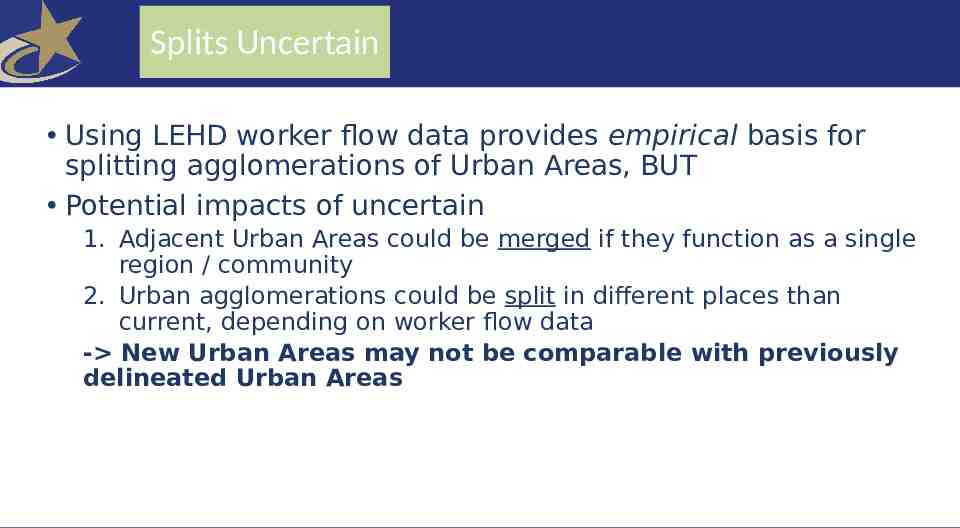
Splits Uncertain Using LEHD worker flow data provides empirical basis for splitting agglomerations of Urban Areas, BUT Potential impacts of uncertain 1. Adjacent Urban Areas could be merged if they function as a single region / community 2. Urban agglomerations could be split in different places than current, depending on worker flow data - New Urban Areas may not be comparable with previously delineated Urban Areas
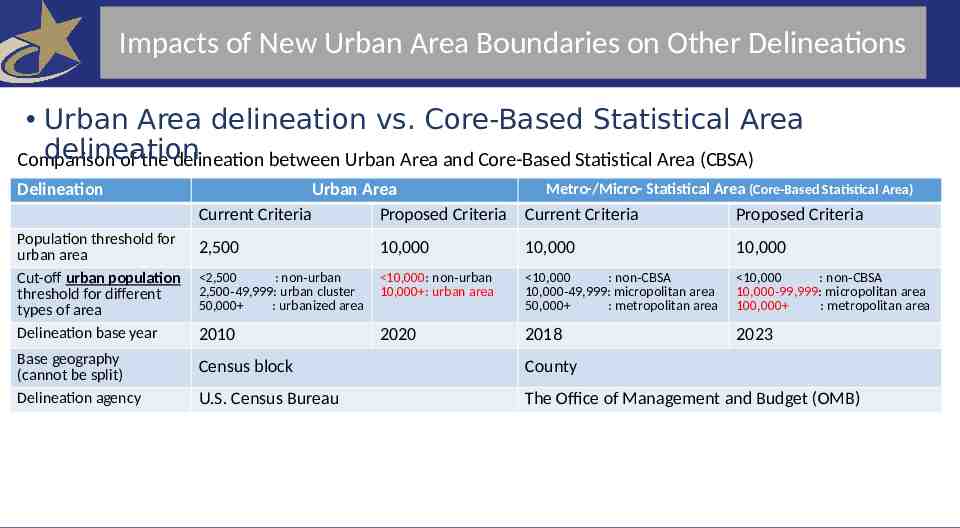
Impacts of New Urban Area Boundaries on Other Delineations Urban Area delineation vs. Core-Based Statistical Area delineation Comparison of the delineation between Urban Area and Core-Based Statistical Area (CBSA) Delineation Metro-/Micro- Statistical Area (Core-Based Statistical Area) Urban Area Current Criteria Proposed Criteria Current Criteria Proposed Criteria Population threshold for urban area Cut-off urban population threshold for different types of area Delineation base year 2,500 10,000 10,000 10,000 2,500 : non-urban 2,500-49,999: urban cluster 50,000 : urbanized area 10,000: non-urban 10,000 : urban area 10,000 : non-CBSA 10,000-49,999: micropolitan area 50,000 : metropolitan area 10,000 : non-CBSA 10,000-99,999: micropolitan area 100,000 : metropolitan area 2010 2020 2018 2023 Base geography (cannot be split) Delineation agency Census block County U.S. Census Bureau The Office of Management and Budget (OMB)
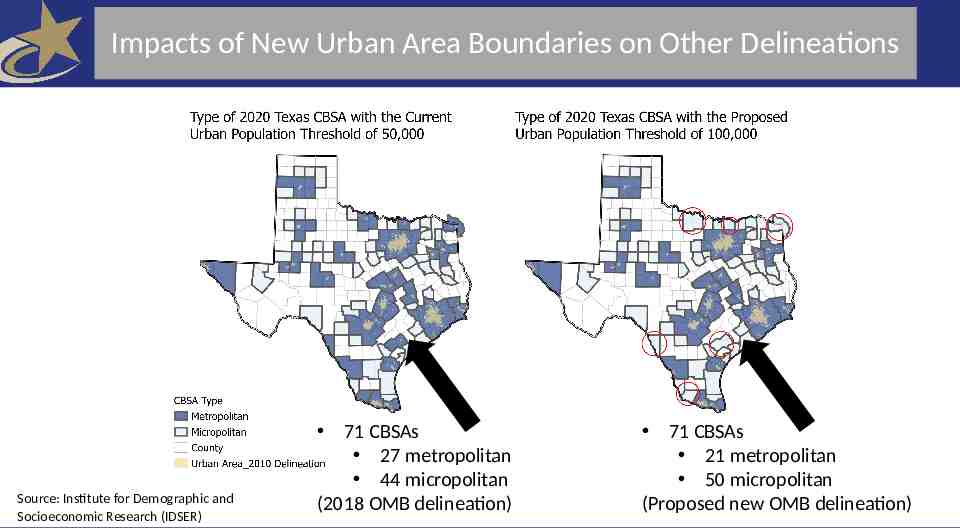
Impacts of New Urban Area Boundaries on Other Delineations Source: Institute for Demographic and Socioeconomic Research (IDSER) 71 CBSAs 27 metropolitan 44 micropolitan (2018 OMB delineation) 71 CBSAs 21 metropolitan 50 micropolitan (Proposed new OMB delineation)
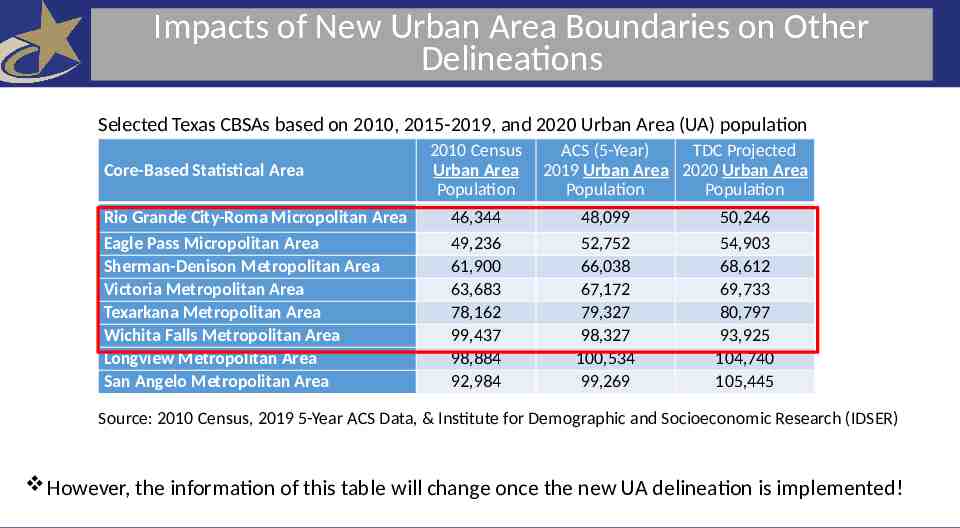
Impacts of New Urban Area Boundaries on Other Delineations Selected Texas CBSAs based on 2010, 2015-2019, and 2020 Urban Area (UA) population Core-Based Statistical Area Rio Grande City-Roma Micropolitan Area Eagle Pass Micropolitan Area Sherman-Denison Metropolitan Area Victoria Metropolitan Area Texarkana Metropolitan Area Wichita Falls Metropolitan Area Longview Metropolitan Area San Angelo Metropolitan Area 2010 Census Urban Area Population 46,344 49,236 61,900 63,683 78,162 99,437 98,884 92,984 ACS (5-Year) TDC Projected 2019 Urban Area 2020 Urban Area Population Population 48,099 52,752 66,038 67,172 79,327 98,327 100,534 99,269 50,246 54,903 68,612 69,733 80,797 93,925 104,740 105,445 Source: 2010 Census, 2019 5-Year ACS Data, & Institute for Demographic and Socioeconomic Research (IDSER) However, the information of this table will change once the new UA delineation is implemented!
Summary and Resources
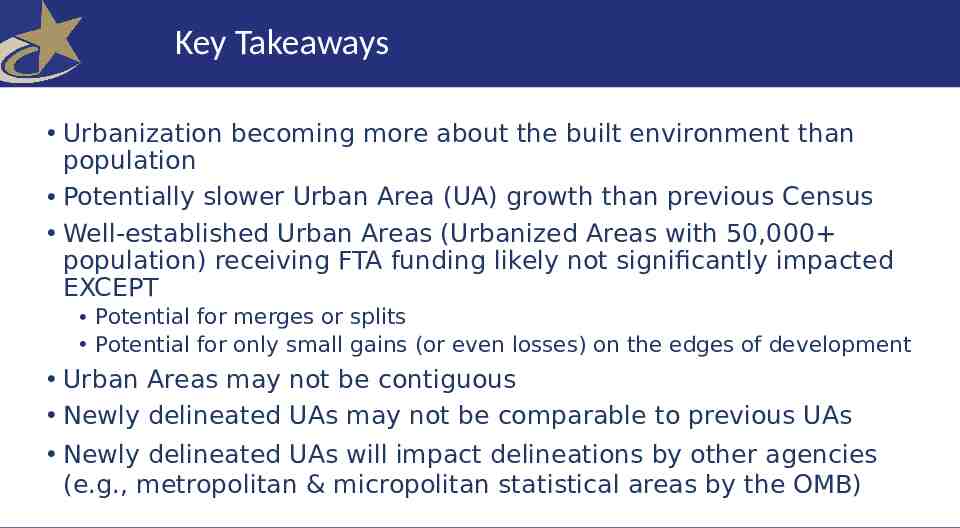
Key Takeaways Urbanization becoming more about the built environment than population Potentially slower Urban Area (UA) growth than previous Census Well-established Urban Areas (Urbanized Areas with 50,000 population) receiving FTA funding likely not significantly impacted EXCEPT Potential for merges or splits Potential for only small gains (or even losses) on the edges of development Urban Areas may not be contiguous Newly delineated UAs may not be comparable to previous UAs Newly delineated UAs will impact delineations by other agencies (e.g., metropolitan & micropolitan statistical areas by the OMB)
Resources Federal Register announcement - Urban Areas for the 2020 Census-Proposed Criteria - Comments due May 20, 2021 TDC Evaluation of the Proposed 2020 Urban Area Criteria Federal Register announcement - Changes to the 2010 Stan dards for Delineating Metropolitan and Micropolitan Statistic al Areas - Comments due March 20, 2021 TDC Evaluation of the Proposed 2020 Metropolitan Statistica l Areas Criteria Local Update of Census Addresses Program (LUCA) - Housing unit data
Questions & Answers
Po-Chun Huang, PhD (210) 458-6545 [email protected] Demographics.Texas.gov @TexasDemography