Building and Fostering a Culture of Success through the Program
50 Slides7.61 MB
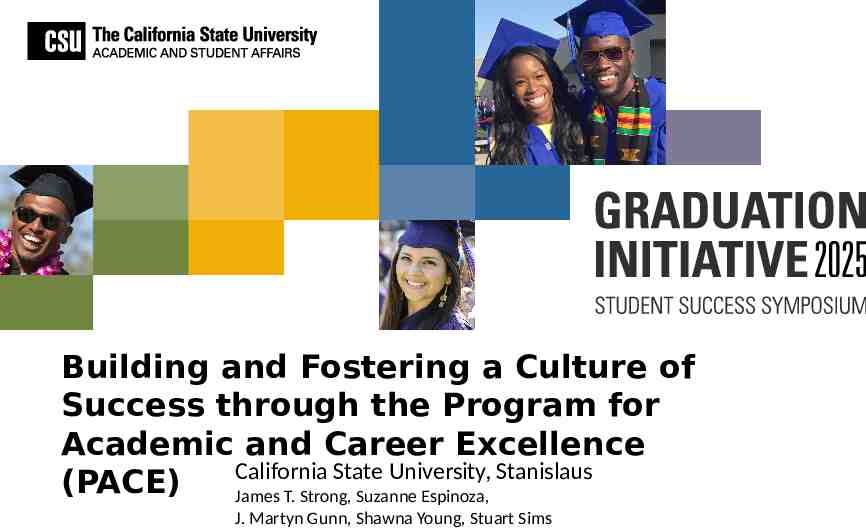
Building and Fostering a Culture of Success through the Program for Academic and Career Excellence California State University, Stanislaus (PACE) James T. Strong, Suzanne Espinoza, J. Martyn Gunn, Shawna Young, Stuart Sims
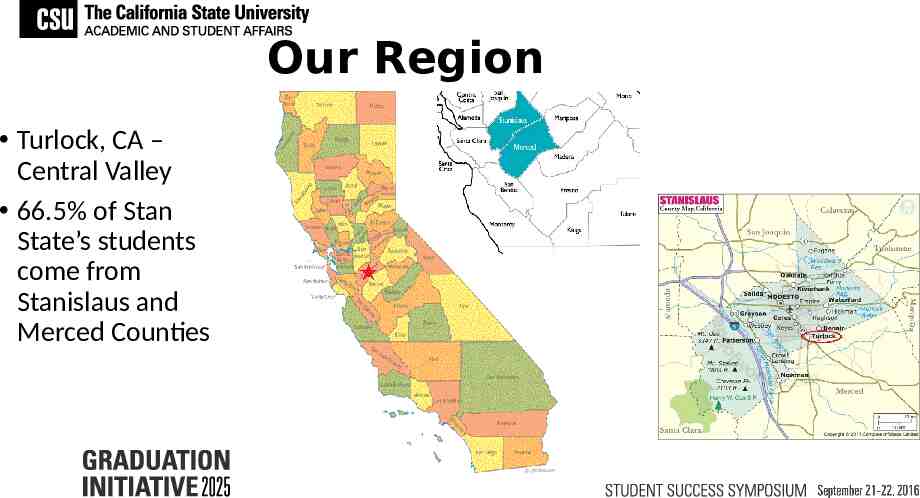
Our Region Turlock, CA – Central Valley 66.5% of Stan State’s students come from Stanislaus and Merced Counties
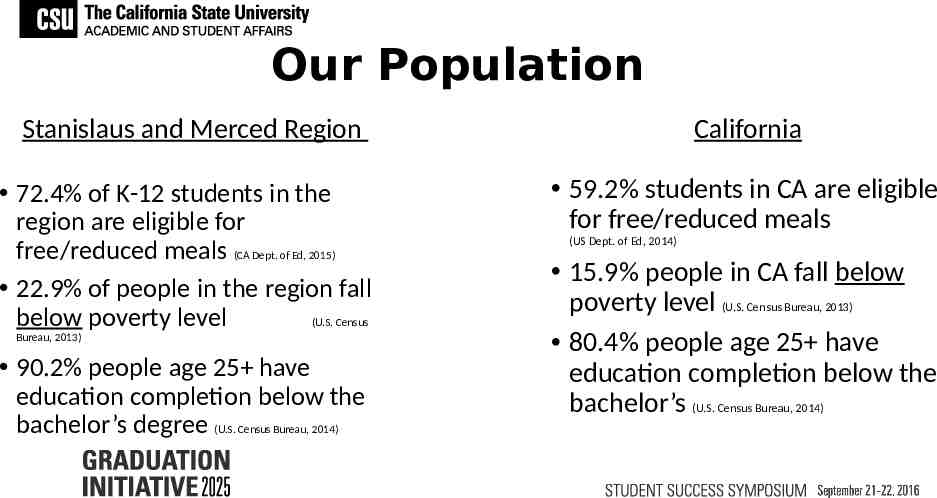
Our Population Stanislaus and Merced Region California 72.4% of K-12 students in the region are eligible for free/reduced meals (CA Dept. of Ed, 2015) 22.9% of people in the region fall below poverty level (U.S. Census 59.2% students in CA are eligible for free/reduced meals Bureau, 2013) 90.2% people age 25 have education completion below the bachelor’s degree (U.S. Census Bureau, 2014) (US Dept. of Ed, 2014) 15.9% people in CA fall below poverty level (U.S. Census Bureau, 2013) 80.4% people age 25 have education completion below the bachelor’s (U.S. Census Bureau, 2014)
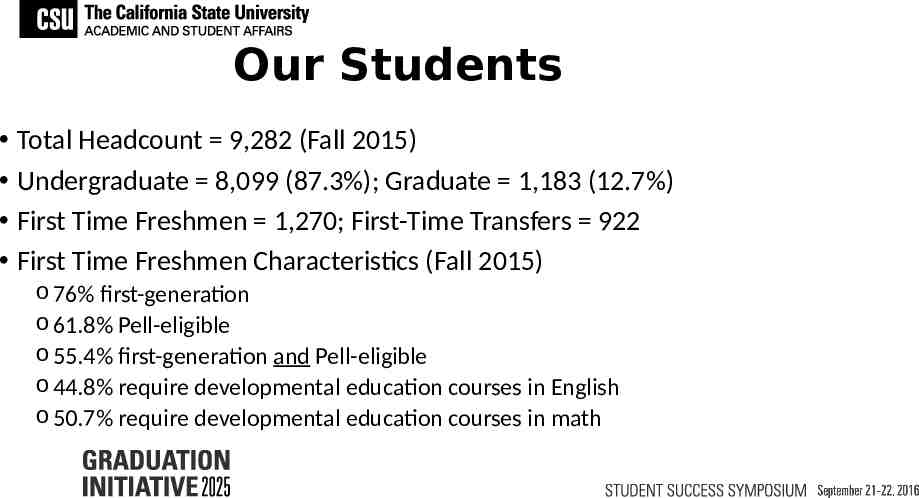
Our Students Total Headcount 9,282 (Fall 2015) Undergraduate 8,099 (87.3%); Graduate 1,183 (12.7%) First Time Freshmen 1,270; First-Time Transfers 922 First Time Freshmen Characteristics (Fall 2015) o 76% first-generation o 61.8% Pell-eligible o 55.4% first-generation and Pell-eligible o 44.8% require developmental education courses in English o 50.7% require developmental education courses in math
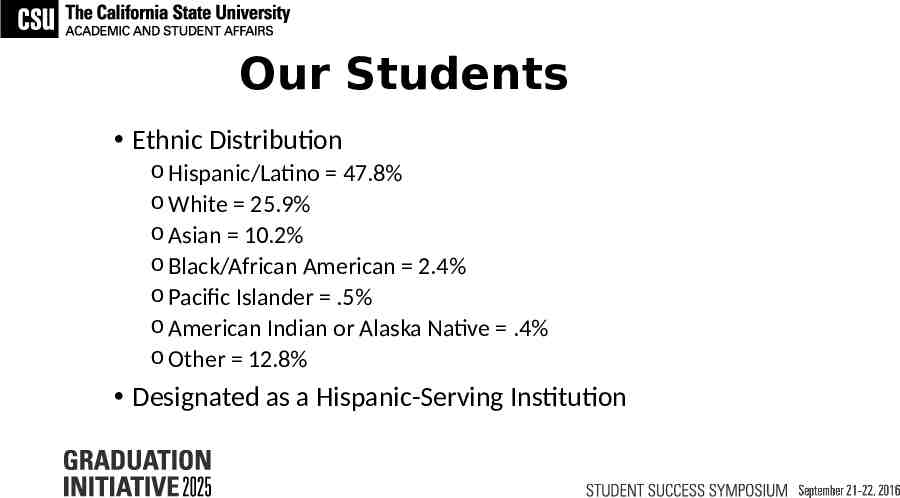
Our Students Ethnic Distribution o Hispanic/Latino 47.8% o White 25.9% o Asian 10.2% o Black/African American 2.4% o Pacific Islander .5% o American Indian or Alaska Native .4% o Other 12.8% Designated as a Hispanic-Serving Institution
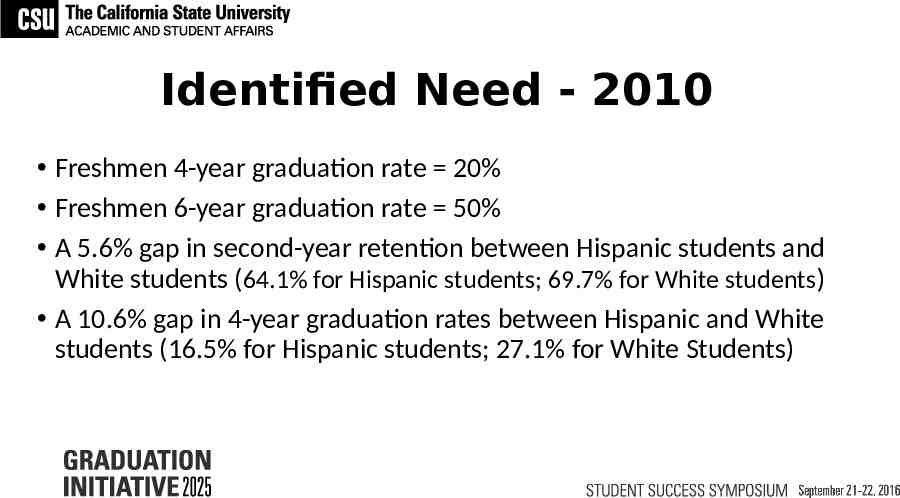
Identified Need - 2010 Freshmen 4-year graduation rate 20% Freshmen 6-year graduation rate 50% A 5.6% gap in second-year retention between Hispanic students and White students (64.1% for Hispanic students; 69.7% for White students ) A 10.6% gap in 4-year graduation rates between Hispanic and White students (16.5% for Hispanic students; 27.1% for White Students)
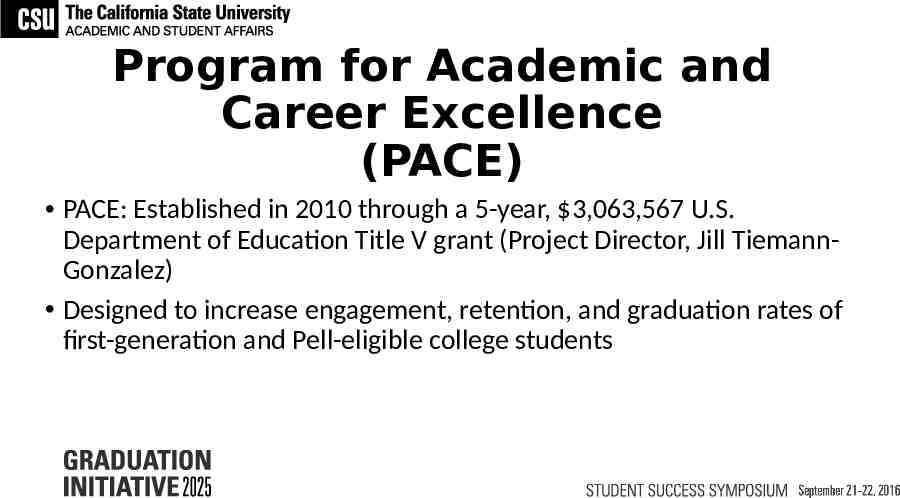
Program for Academic and Career Excellence (PACE) PACE: Established in 2010 through a 5-year, 3,063,567 U.S. Department of Education Title V grant (Project Director, Jill TiemannGonzalez) Designed to increase engagement, retention, and graduation rates of first-generation and Pell-eligible college students
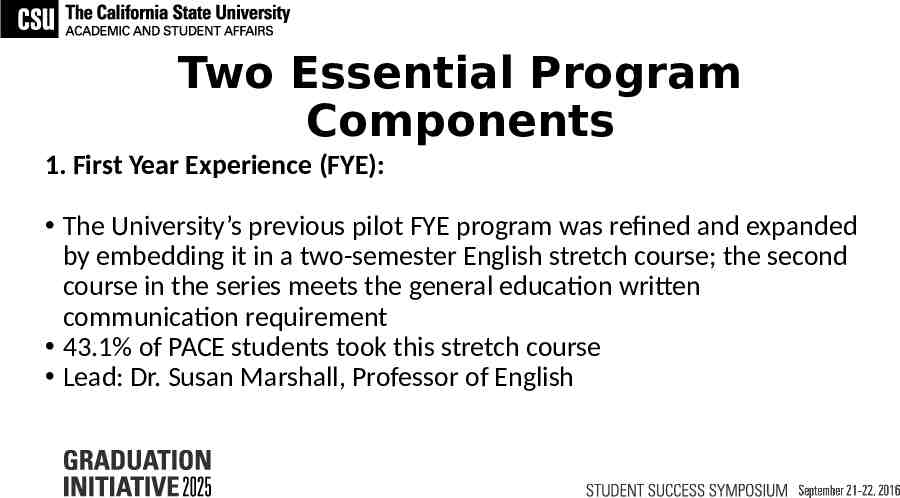
Two Essential Program Components 1. First Year Experience (FYE): The University’s previous pilot FYE program was refined and expanded by embedding it in a two-semester English stretch course; the second course in the series meets the general education written communication requirement 43.1% of PACE students took this stretch course Lead: Dr. Susan Marshall, Professor of English
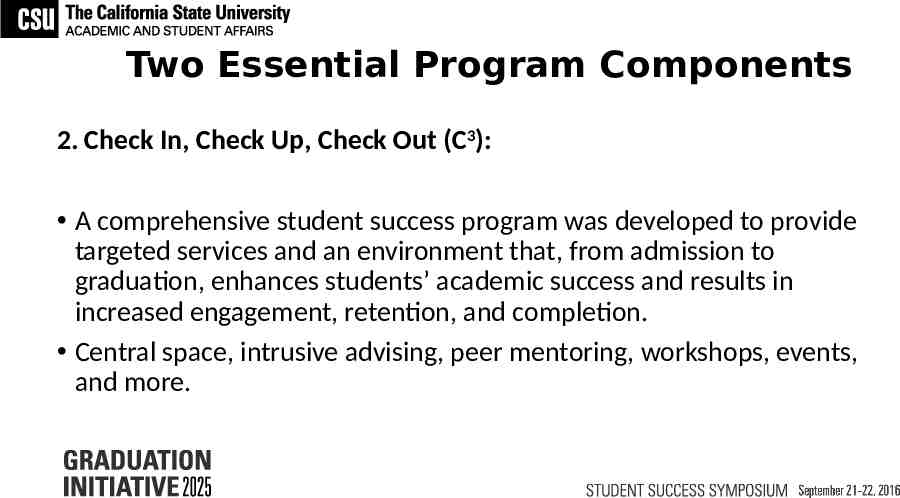
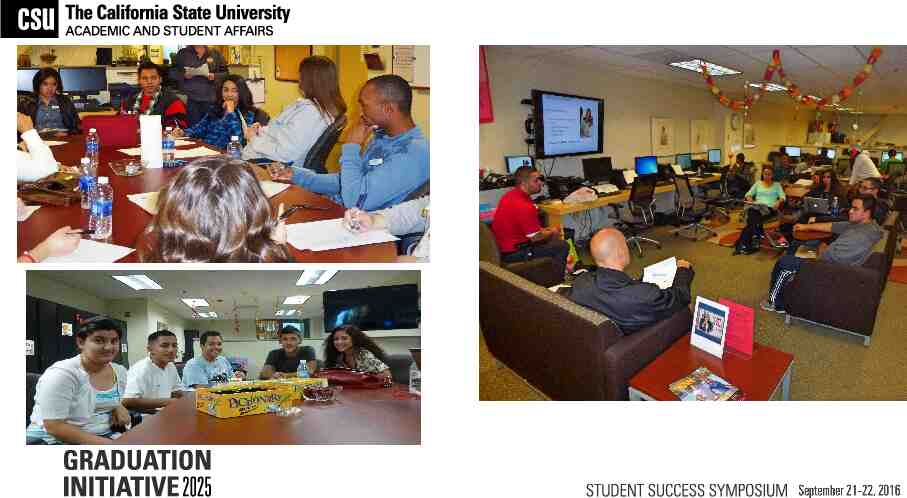
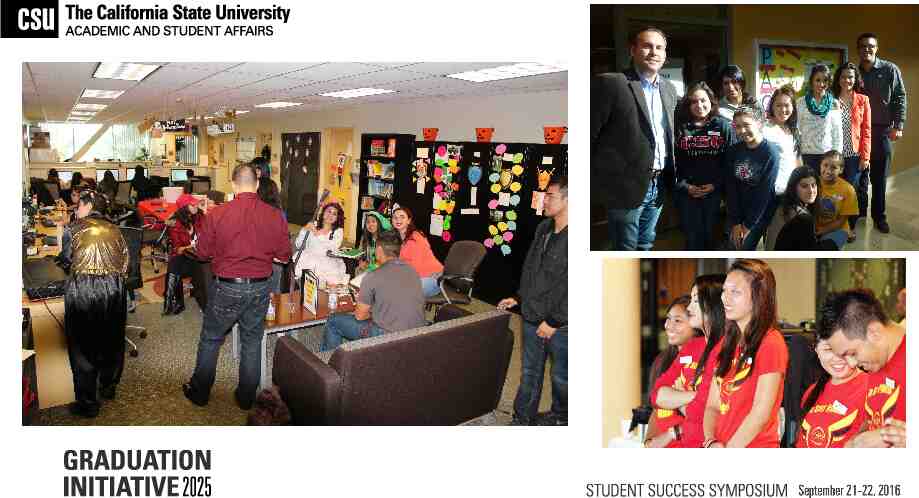
Two Essential Program Components 2. Check In, Check Up, Check Out (C3): A comprehensive student success program was developed to provide targeted services and an environment that, from admission to graduation, enhances students’ academic success and results in increased engagement, retention, and completion. Central space, intrusive advising, peer mentoring, workshops, events, and more.
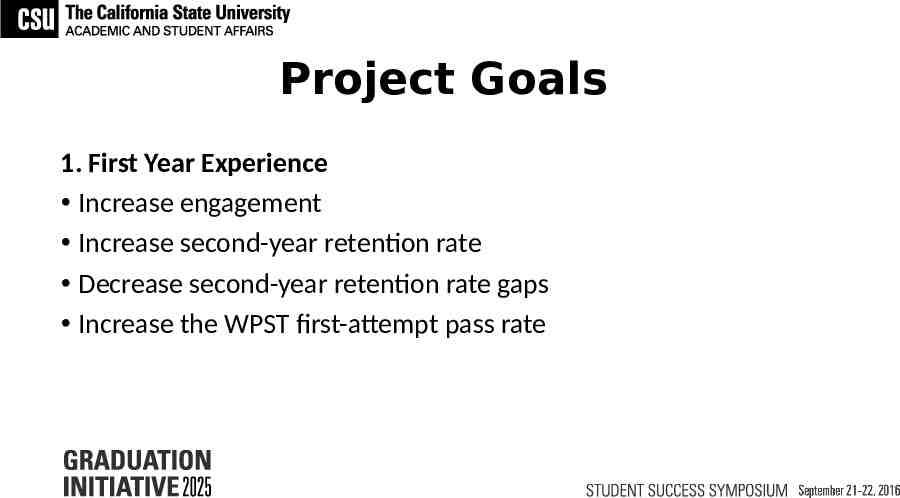
Project Goals 1. First Year Experience Increase engagement Increase second-year retention rate Decrease second-year retention rate gaps Increase the WPST first-attempt pass rate
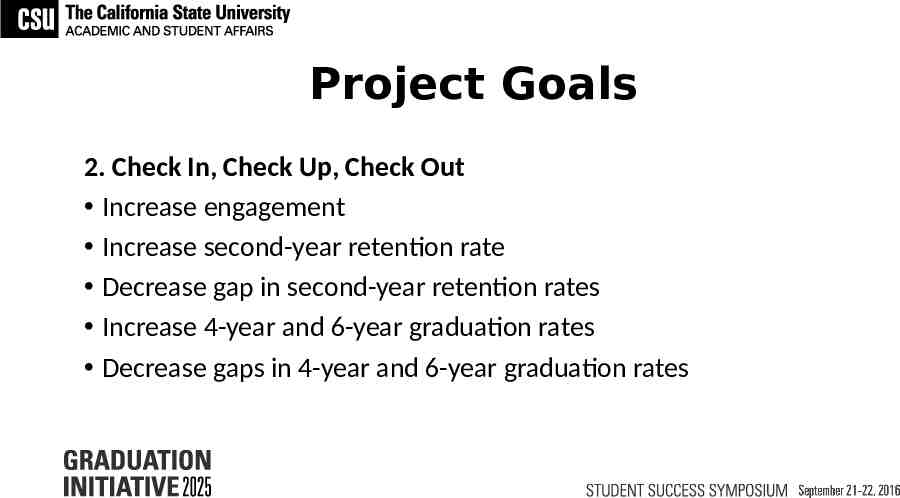
Project Goals 2. Check In, Check Up, Check Out Increase engagement Increase second-year retention rate Decrease gap in second-year retention rates Increase 4-year and 6-year graduation rates Decrease gaps in 4-year and 6-year graduation rates
Participants: Numbers Freshmen cohorts averaging 136 students each year (714 students in total) were directly served by the grant-funded project.
Participants: Selection Students were identified through outreach efforts made at regional high schools. Through collaboration with high school counselors, PACE program personnel delivered information sessions to high school seniors who had been accepted to Stan State. During these sessions, an overview of PACE program services were provided, and program applications were distributed and collected.
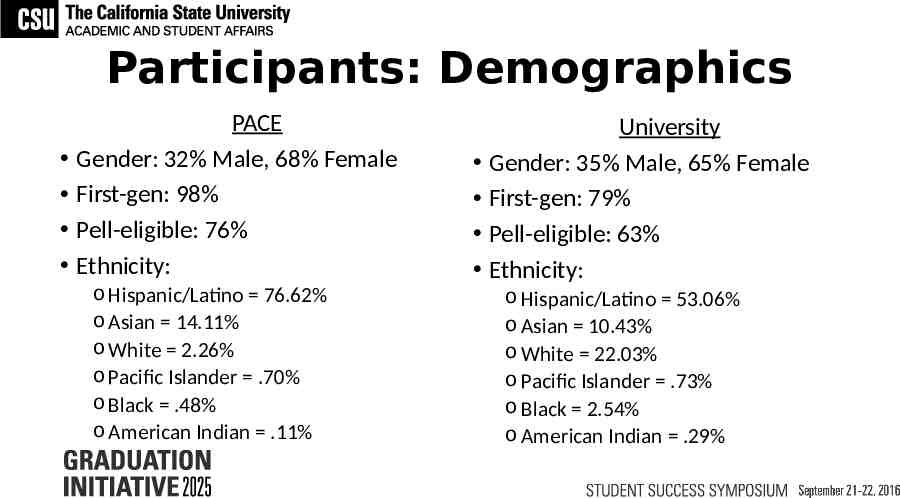
Participants: Demographics PACE Gender: 32% Male, 68% Female First-gen: 98% Pell-eligible: 76% Ethnicity: o Hispanic/Latino 76.62% o Asian 14.11% o White 2.26% o Pacific Islander .70% o Black .48% o American Indian .11% University Gender: 35% Male, 65% Female First-gen: 79% Pell-eligible: 63% Ethnicity: o Hispanic/Latino 53.06% o Asian 10.43% o White 22.03% o Pacific Islander .73% o Black 2.54% o American Indian .29%
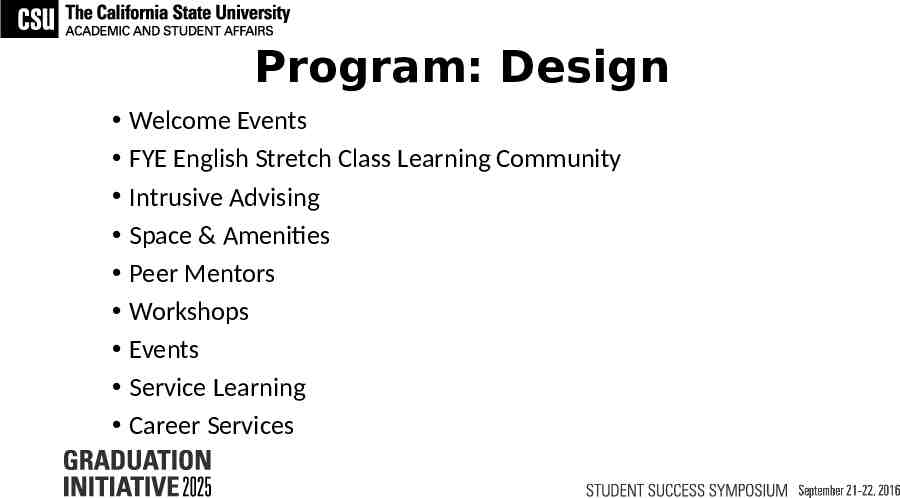
Program: Design Welcome Events FYE English Stretch Class Learning Community Intrusive Advising Space & Amenities Peer Mentors Workshops Events Service Learning Career Services
Program: Resources Space Personnel Equipment and Supplies
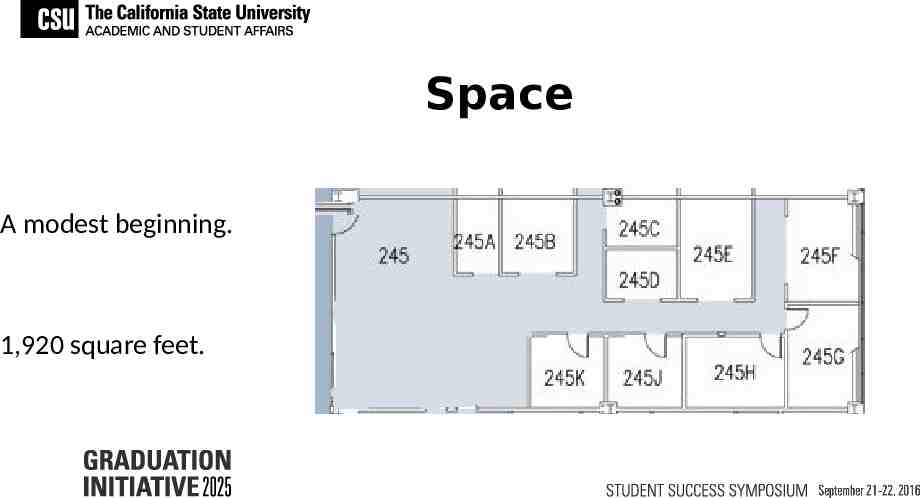
Space A modest beginning. 1,920 square feet.
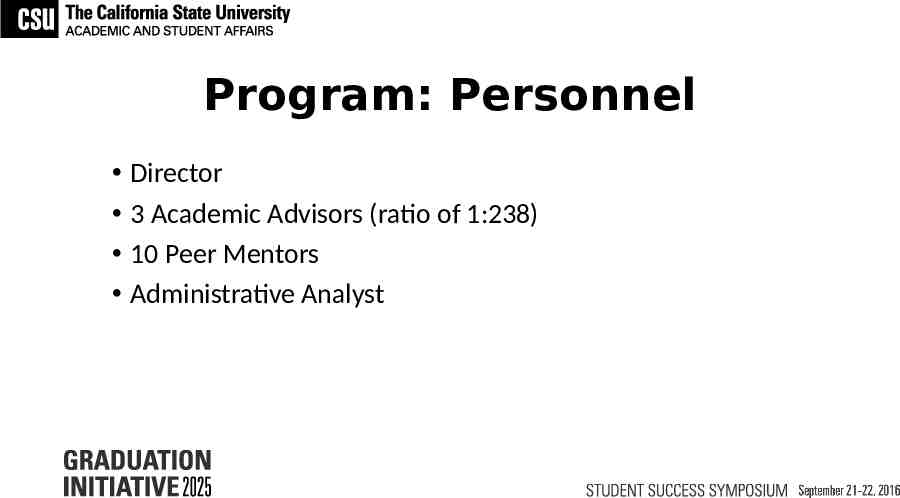
Program: Personnel Director 3 Academic Advisors (ratio of 1:238) 10 Peer Mentors Administrative Analyst
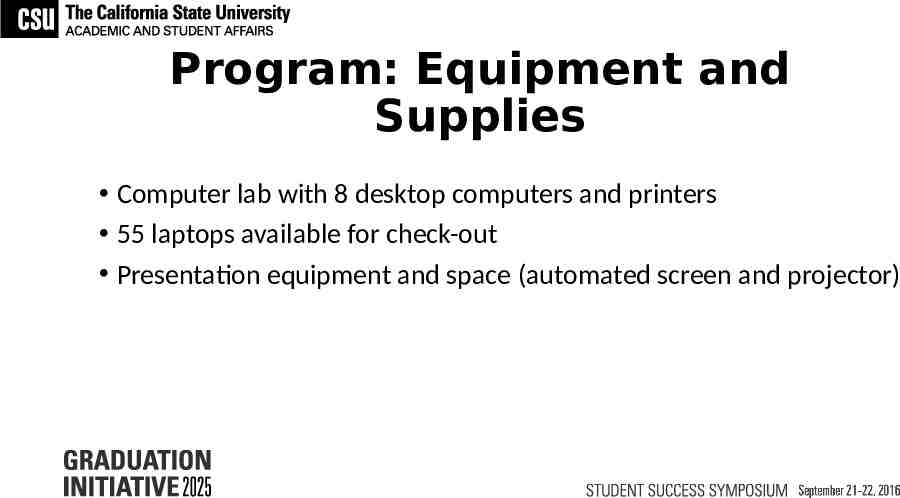
Program: Equipment and Supplies Computer lab with 8 desktop computers and printers 55 laptops available for check-out Presentation equipment and space (automated screen and projector)
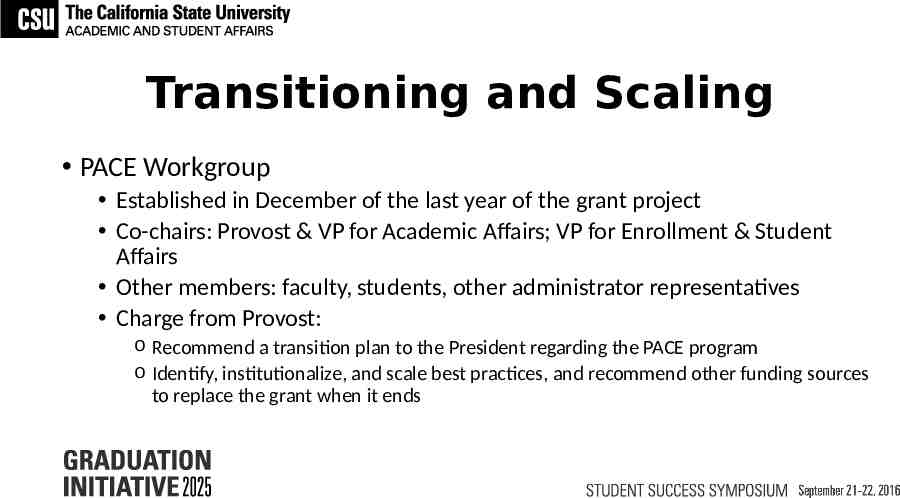
Transitioning and Scaling PACE Workgroup Established in December of the last year of the grant project Co-chairs: Provost & VP for Academic Affairs; VP for Enrollment & Student Affairs Other members: faculty, students, other administrator representatives Charge from Provost: o Recommend a transition plan to the President regarding the PACE program o Identify, institutionalize, and scale best practices, and recommend other funding sources to replace the grant when it ends
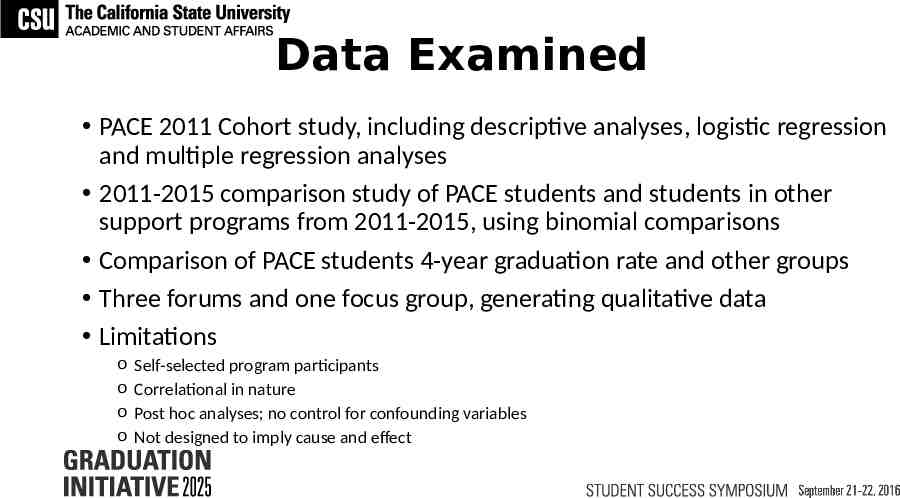
Data Examined PACE 2011 Cohort study, including descriptive analyses, logistic regression and multiple regression analyses 2011-2015 comparison study of PACE students and students in other support programs from 2011-2015, using binomial comparisons Comparison of PACE students 4-year graduation rate and other groups Three forums and one focus group, generating qualitative data Limitations o o o o Self-selected program participants Correlational in nature Post hoc analyses; no control for confounding variables Not designed to imply cause and effect
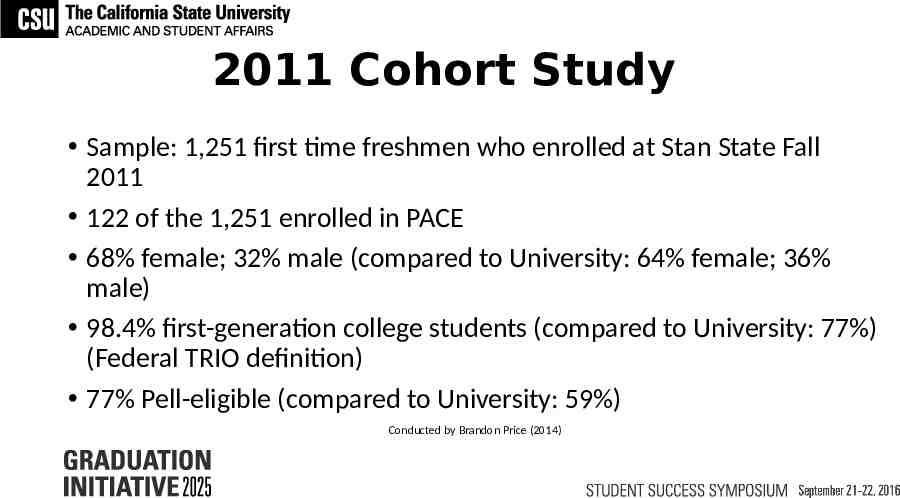
2011 Cohort Study Sample: 1,251 first time freshmen who enrolled at Stan State Fall 2011 122 of the 1,251 enrolled in PACE 68% female; 32% male (compared to University: 64% female; 36% male) 98.4% first-generation college students (compared to University: 77%) (Federal TRIO definition) 77% Pell-eligible (compared to University: 59%) Conducted by Brandon Price (2014)
FINDINGS
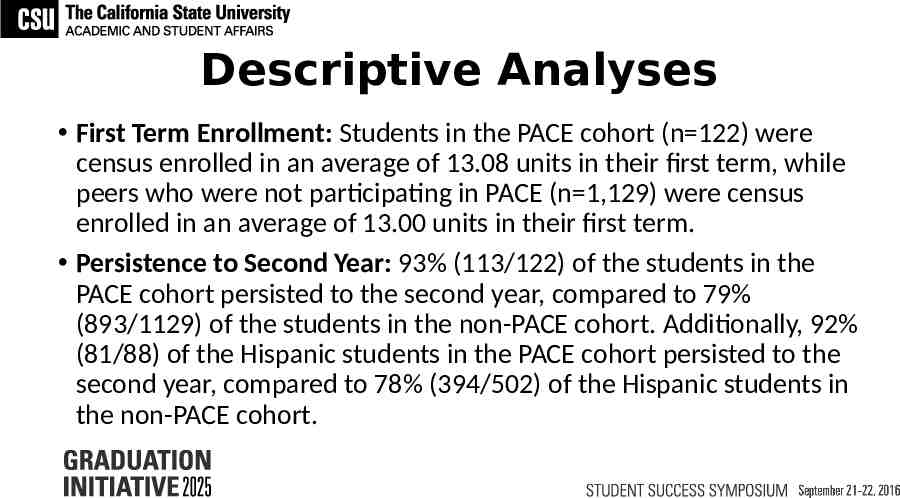
Descriptive Analyses First Term Enrollment: Students in the PACE cohort (n 122) were census enrolled in an average of 13.08 units in their first term, while peers who were not participating in PACE (n 1,129) were census enrolled in an average of 13.00 units in their first term. Persistence to Second Year: 93% (113/122) of the students in the PACE cohort persisted to the second year, compared to 79% (893/1129) of the students in the non-PACE cohort. Additionally, 92% (81/88) of the Hispanic students in the PACE cohort persisted to the second year, compared to 78% (394/502) of the Hispanic students in the non-PACE cohort.
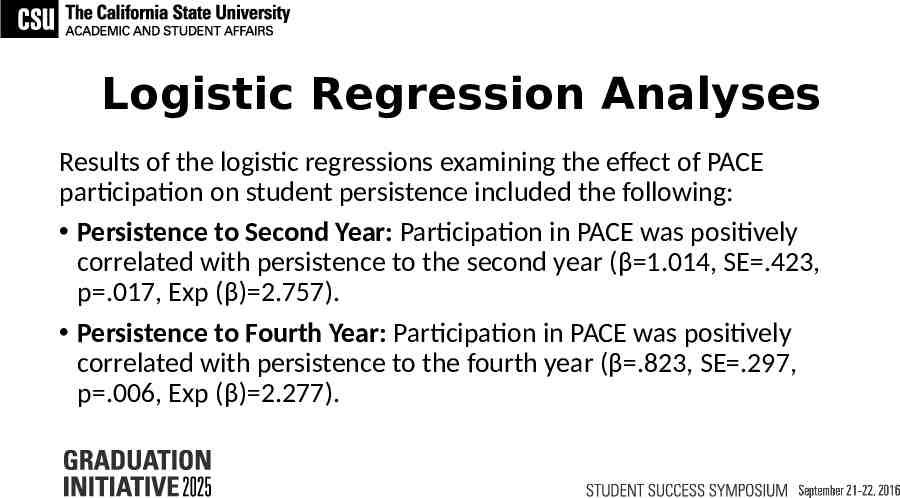
Logistic Regression Analyses Results of the logistic regressions examining the effect of PACE participation on student persistence included the following: Persistence to Second Year: Participation in PACE was positively correlated with persistence to the second year (β 1.014, SE .423, p .017, Exp (β) 2.757). Persistence to Fourth Year: Participation in PACE was positively correlated with persistence to the fourth year (β .823, SE .297, p .006, Exp (β) 2.277).
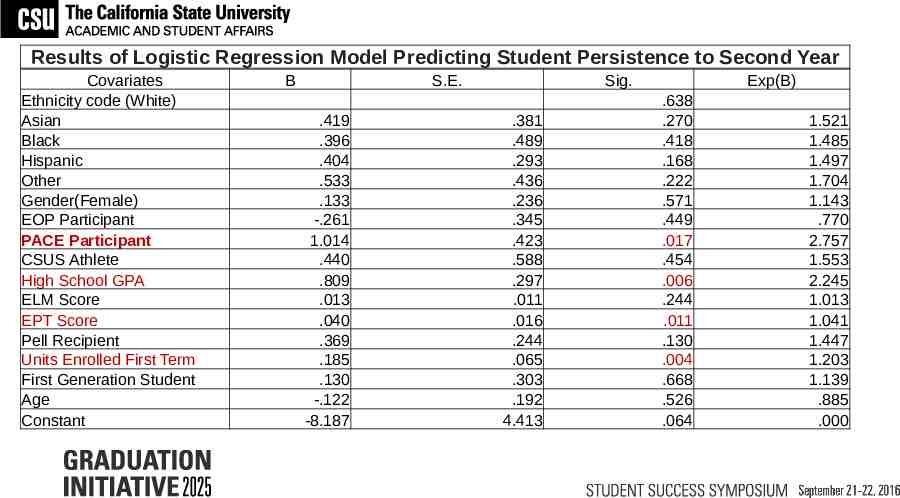
Results of Logistic Regression Model Predicting Student Persistence to Second Year Covariates Ethnicity code (White) Asian Black Hispanic Other Gender(Female) EOP Participant PACE Participant CSUS Athlete High School GPA ELM Score EPT Score Pell Recipient Units Enrolled First Term First Generation Student Age Constant B S.E. .419 .396 .404 .533 .133 -.261 1.014 .440 .809 .013 .040 .369 .185 .130 -.122 -8.187 Sig. .381 .489 .293 .436 .236 .345 .423 .588 .297 .011 .016 .244 .065 .303 .192 4.413 Exp(B) .638 .270 .418 .168 .222 .571 .449 .017 .454 .006 .244 .011 .130 .004 .668 .526 .064 1.521 1.485 1.497 1.704 1.143 .770 2.757 1.553 2.245 1.013 1.041 1.447 1.203 1.139 .885 .000
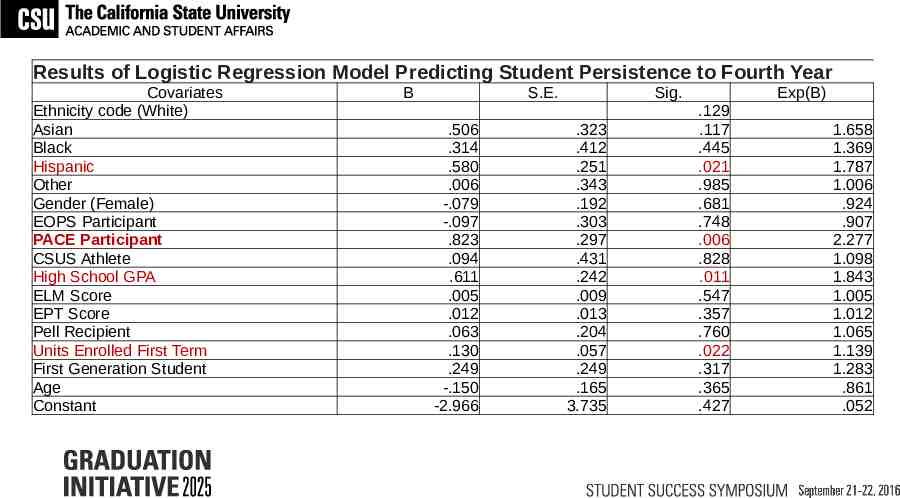
Results of Logistic Regression Model Predicting Student Persistence to Fourth Year Covariates Ethnicity code (White) Asian Black Hispanic Other Gender (Female) EOPS Participant PACE Participant CSUS Athlete High School GPA ELM Score EPT Score Pell Recipient Units Enrolled First Term First Generation Student Age Constant B S.E. .506 .314 .580 .006 -.079 -.097 .823 .094 .611 .005 .012 .063 .130 .249 -.150 -2.966 Sig. .323 .412 .251 .343 .192 .303 .297 .431 .242 .009 .013 .204 .057 .249 .165 3.735 Exp(B) .129 .117 .445 .021 .985 .681 .748 .006 .828 .011 .547 .357 .760 .022 .317 .365 .427 1.658 1.369 1.787 1.006 .924 .907 2.277 1.098 1.843 1.005 1.012 1.065 1.139 1.283 .861 .052
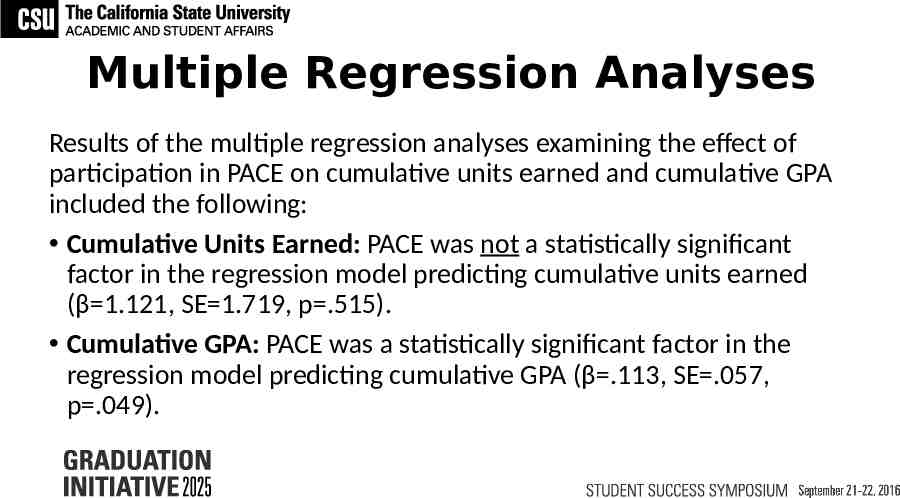
Multiple Regression Analyses Results of the multiple regression analyses examining the effect of participation in PACE on cumulative units earned and cumulative GPA included the following: Cumulative Units Earned: PACE was not a statistically significant factor in the regression model predicting cumulative units earned (β 1.121, SE 1.719, p .515). Cumulative GPA: PACE was a statistically significant factor in the regression model predicting cumulative GPA (β .113, SE .057, p .049).
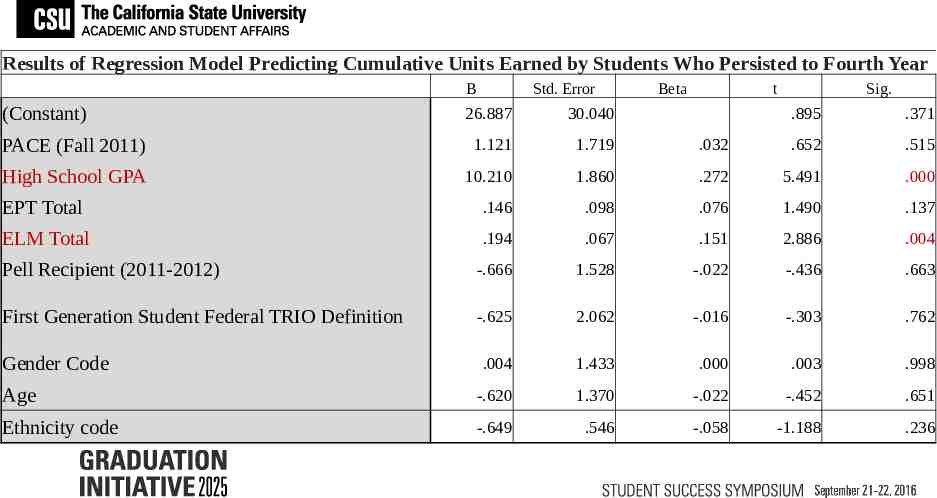
Results of Regression Model Predicting Cumulative Units Earned by Students Who Persisted to Fourth Year B (Constant) Std. Error 26.887 30.040 PACE (Fall 2011) 1.121 1.719 High School GPA 10.210 EPT Total ELM Total Beta t Sig. .895 .371 .032 .652 .515 1.860 .272 5.491 .000 .146 .098 .076 1.490 .137 .194 .067 .151 2.886 .004 Pell Recipient (2011-2012) -.666 1.528 -.022 -.436 .663 First Generation Student Federal TRIO Definition -.625 2.062 -.016 -.303 .762 .004 1.433 .000 .003 .998 Age -.620 1.370 -.022 -.452 .651 Ethnicity code -.649 .546 -.058 -1.188 .236 Gender Code
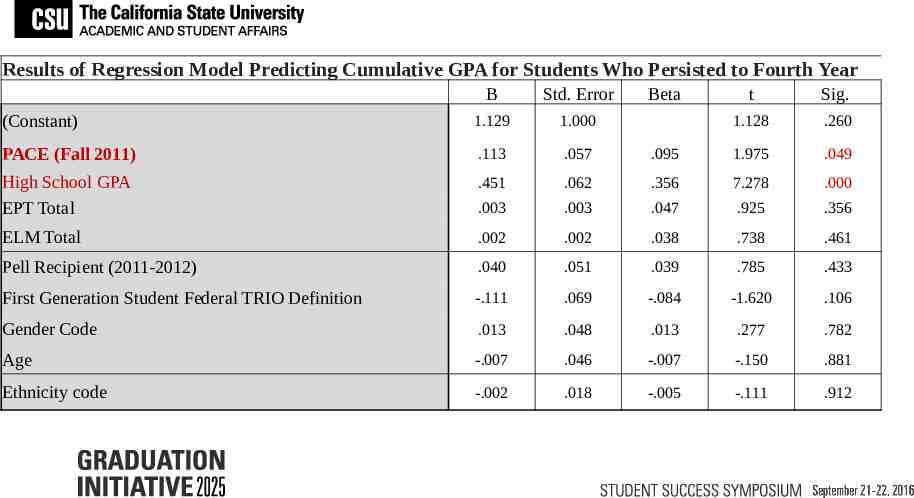
Results of Regression Model Predicting Cumulative GPA for Students Who Persisted to Fourth Year B Std. Error (Constant) 1.129 1.000 PACE (Fall 2011) .113 .057 High School GPA EPT Total .451 Beta t Sig. 1.128 .260 .095 1.975 .049 .062 .356 7.278 .000 .003 .003 .047 .925 .356 ELM Total .002 .002 .038 .738 .461 Pell Recipient (2011-2012) .040 .051 .039 .785 .433 First Generation Student Federal TRIO Definition -.111 .069 -.084 -1.620 .106 Gender Code .013 .048 .013 .277 .782 Age -.007 .046 -.007 -.150 .881 Ethnicity code -.002 .018 -.005 -.111 .912
2011-2015 Comparison Study PACE students were compared to five other student groups (PACE Eligible, Non-PACE, SSS, EOP, and CVMSA) on the following student success indicators over the 5-year period: GPA Units Earned Retention WPST Performance Conducted by John Tillman (2015)
FINDINGS
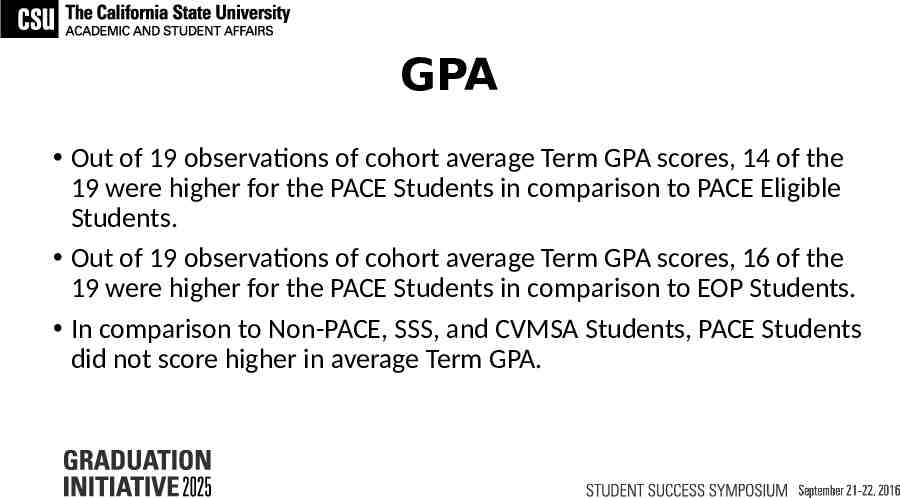
GPA Out of 19 observations of cohort average Term GPA scores, 14 of the 19 were higher for the PACE Students in comparison to PACE Eligible Students. Out of 19 observations of cohort average Term GPA scores, 16 of the 19 were higher for the PACE Students in comparison to EOP Students. In comparison to Non-PACE, SSS, and CVMSA Students, PACE Students did not score higher in average Term GPA.
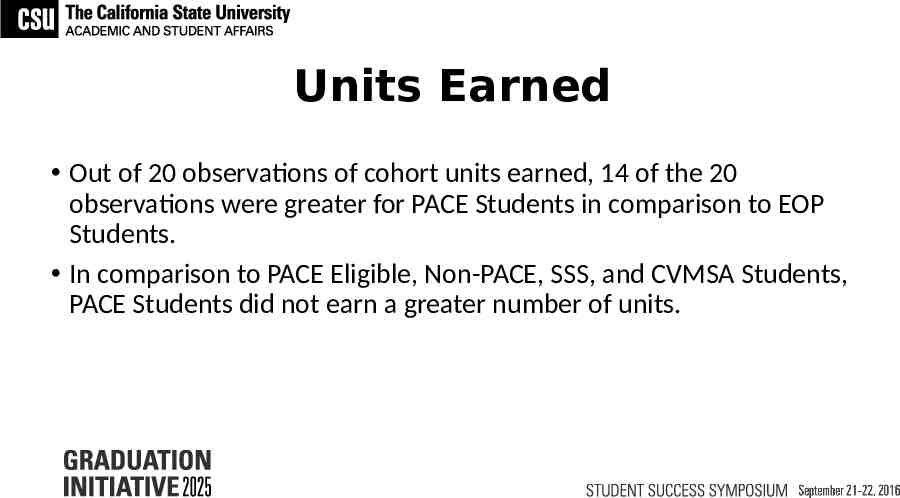
Units Earned Out of 20 observations of cohort units earned, 14 of the 20 observations were greater for PACE Students in comparison to EOP Students. In comparison to PACE Eligible, Non-PACE, SSS, and CVMSA Students, PACE Students did not earn a greater number of units.
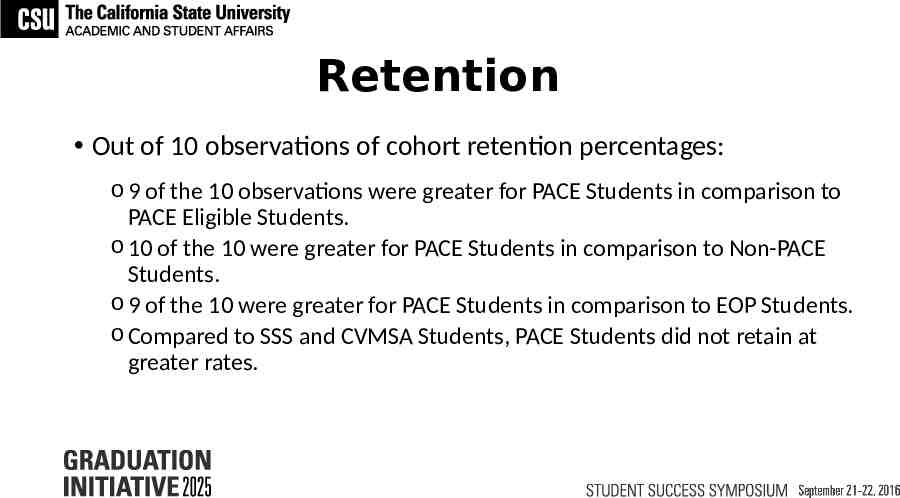
Retention Out of 10 observations of cohort retention percentages: o 9 of the 10 observations were greater for PACE Students in comparison to PACE Eligible Students. o 10 of the 10 were greater for PACE Students in comparison to Non-PACE Students. o 9 of the 10 were greater for PACE Students in comparison to EOP Students. o Compared to SSS and CVMSA Students, PACE Students did not retain at greater rates.
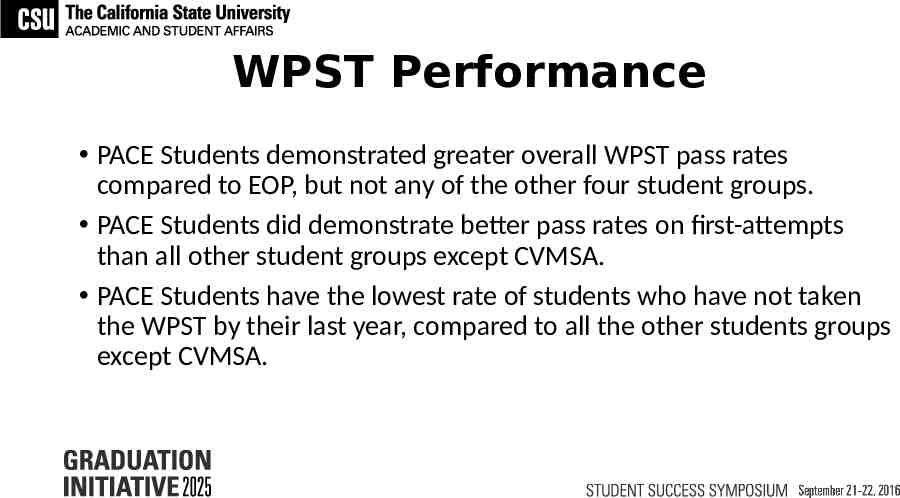
WPST Performance PACE Students demonstrated greater overall WPST pass rates compared to EOP, but not any of the other four student groups. PACE Students did demonstrate better pass rates on first-attempts than all other student groups except CVMSA. PACE Students have the lowest rate of students who have not taken the WPST by their last year, compared to all the other students groups except CVMSA.
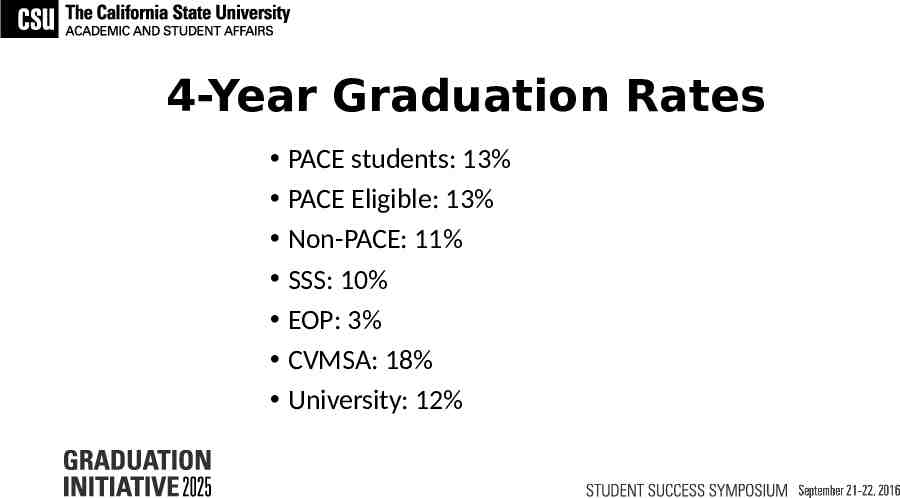
4-Year Graduation Rates PACE students: 13% PACE Eligible: 13% Non-PACE: 11% SSS: 10% EOP: 3% CVMSA: 18% University: 12%
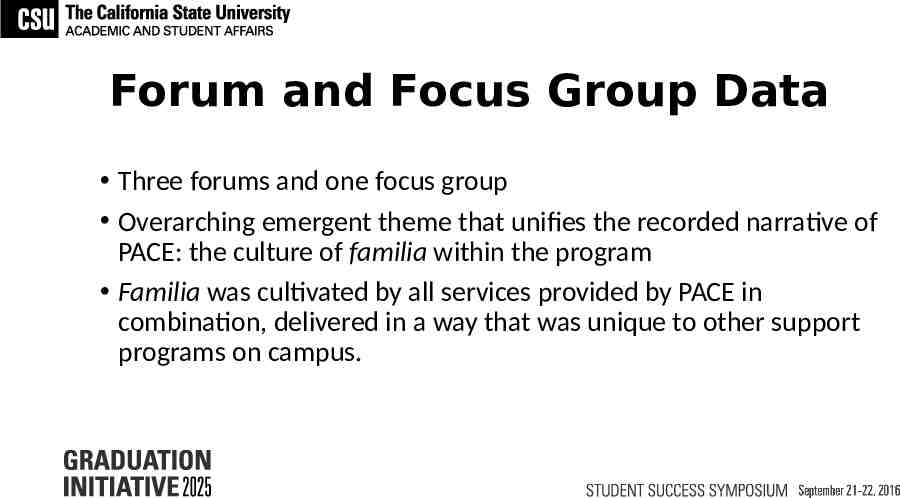
Forum and Focus Group Data Three forums and one focus group Overarching emergent theme that unifies the recorded narrative of PACE: the culture of familia within the program Familia was cultivated by all services provided by PACE in combination, delivered in a way that was unique to other support programs on campus.
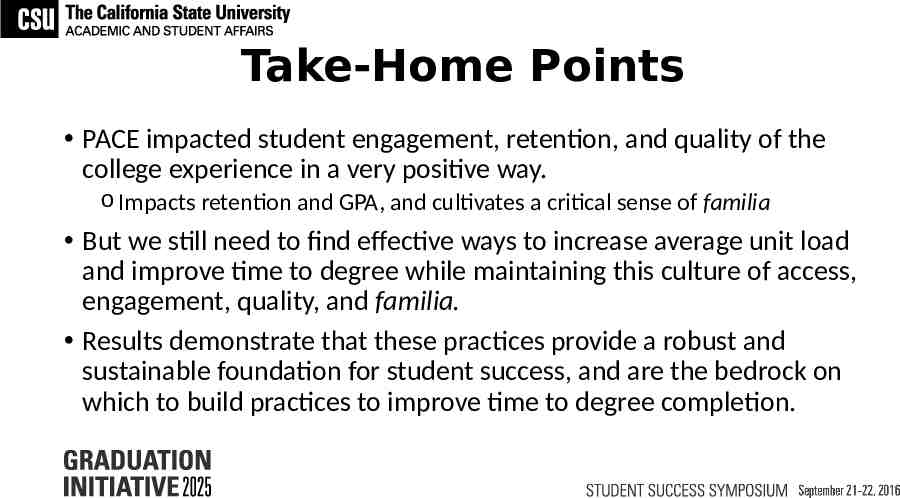
Take-Home Points PACE impacted student engagement, retention, and quality of the college experience in a very positive way. o Impacts retention and GPA, and cultivates a critical sense of familia But we still need to find effective ways to increase average unit load and improve time to degree while maintaining this culture of access, engagement, quality, and familia. Results demonstrate that these practices provide a robust and sustainable foundation for student success, and are the bedrock on which to build practices to improve time to degree completion.
Taking to Scale The Critical Question: How do we translate what we have learned from PACE to help achieve our 2025 Goals?
Moving Forward: Looking toward 2025 Graduation Rate Excellence and Assessment Team (GREAT) Membership: faculty, staff, students, and administrators from across the university
Moving Forward: Looking toward 2025 GREAT Team Charge: Provide recommendations for strategies that, while maintaining student access to an engaging, high-quality education, will position the University to accomplish the following priority goals: o Improve Freshmen 4-year graduation rate; o Eliminate the achievement gaps in graduation rates for underrepresented minority and Pell-eligible students; and o Improve Transfer 2-year graduation rate.
GREAT: Team Details Membership is a grass roots effort, intended to bring together programs and groups to examine practices across the university. The GREAT Team members will: o Identify and examine barriers to increasing graduation rates o Examine evidence of effectiveness in multiple existing programs that improve student success on our campus (e.g., CVMSA, PACE, Early Start) o Make recommendations based on this examination Recommendations will be used to further shape and refine our long-term student success plan and its implementation to reach our Graduation Initiative 2025 Goals.
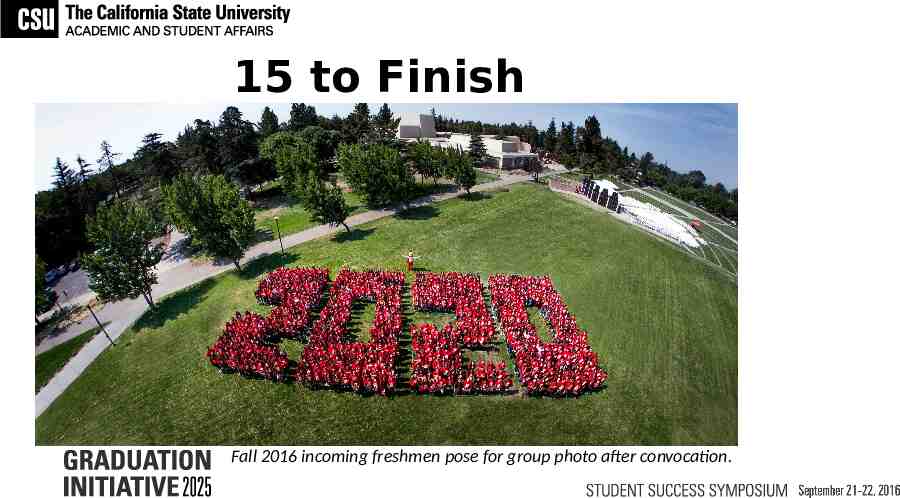
15 to Finish Fall 2016 incoming freshmen pose for group photo after convocation.
Discussion Questions 1. How do we replicate defining characteristics and best practices of small, intimate programs while scaling-up to serve all students? 2. How do we encourage increased unit load while maintaining a quality experience? 3. What are some challenges to, as well as tips for, institutionalizing large, multi-year, multi-million dollar grant projects?
Discussion Questions 1. How do we replicate defining characteristics and best practices of small, intimate programs while scaling-up to serve all students?
Discussion Questions 2. How do we encourage increased unit load while maintaining a quality experience?
Discussion Questions 3. What are some challenges to, as well as tips for, institutionalizing large, multi-year, multi-million dollar grant projects?