Reducing Chronic Absence: AnWhat overview of why matters Will It


32 Slides5.46 MB
Reducing Chronic Absence: AnWhat overview of why matters Will It itTake? and key ingredients for improving student attendance Hedy Chang, Director Spring 2014 www.attendanceworks.o
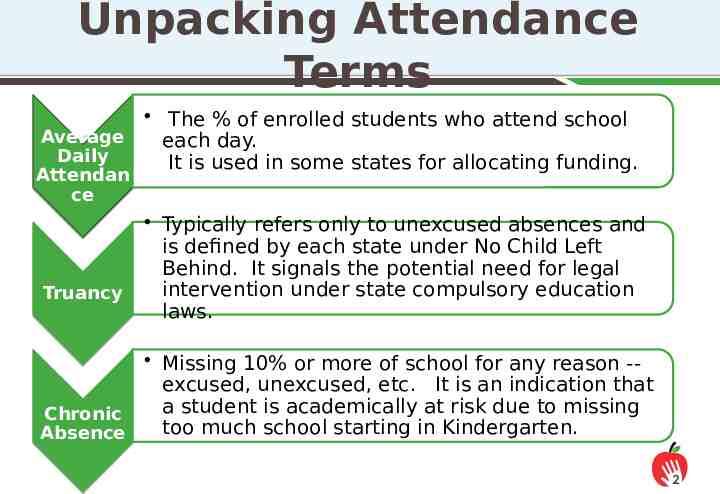
Unpacking Attendance Terms The % of enrolled students who attend school Average each day. Daily It is used in some states for allocating funding. Attendan ce Truancy Typically refers only to unexcused absences and is defined by each state under No Child Left Behind. It signals the potential need for legal intervention under state compulsory education laws. Missing 10% or more of school for any reason -excused, unexcused, etc. It is an indication that a student is academically at risk due to missing Chronic too much school starting in Kindergarten. Absence 2
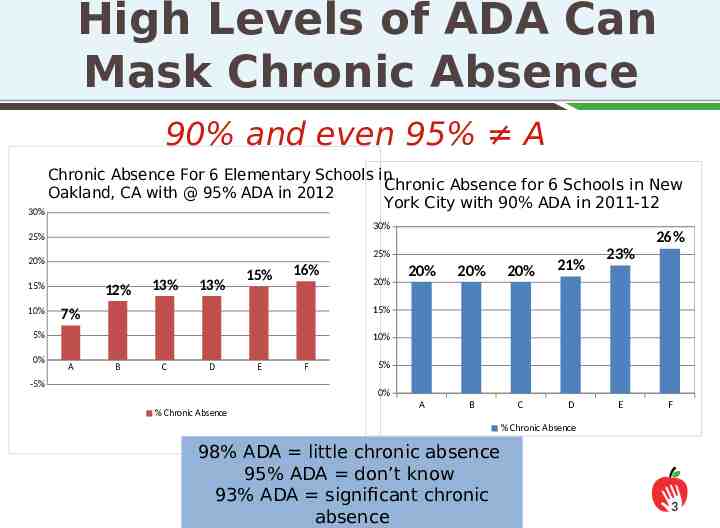
High Levels of ADA Can Mask Chronic Absence 90% and even 95% A Chronic Absence For 6 Elementary Schools in Chronic Absence for 6 Schools in New Oakland, CA with @ 95% ADA in 2012 York City with 90% ADA in 2011-12 30% 30% 26% 25% 25% 20% 15% 10% 12% 13% 13% 15% 16% 20% 20% 20% A B C 23% 15% 7% 5% 0% 20% 21% 10% A B C D -5% E F 5% 0% % Chronic Absence D E F % Chronic Absence 98% ADA little chronic absence 95% ADA don’t know 93% ADA significant chronic absence 3
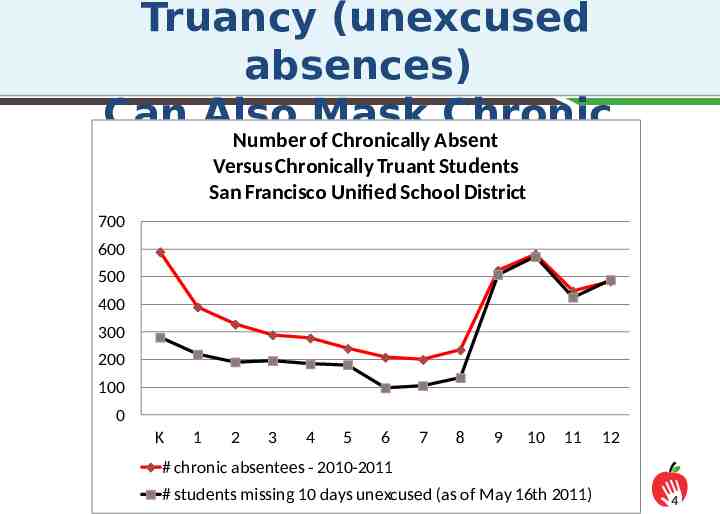
Truancy (unexcused absences) Can Also Mask Chronic Number of Chronically Absent Versus Chronically Truant Students Absence San Francisco Unified School District 700 600 500 400 300 200 100 0 K 1 2 3 4 5 6 7 8 9 10 11 12 # chronic absentees - 2010-2011 # students missing 10 days unexcused (as of May 16th 2011) 4
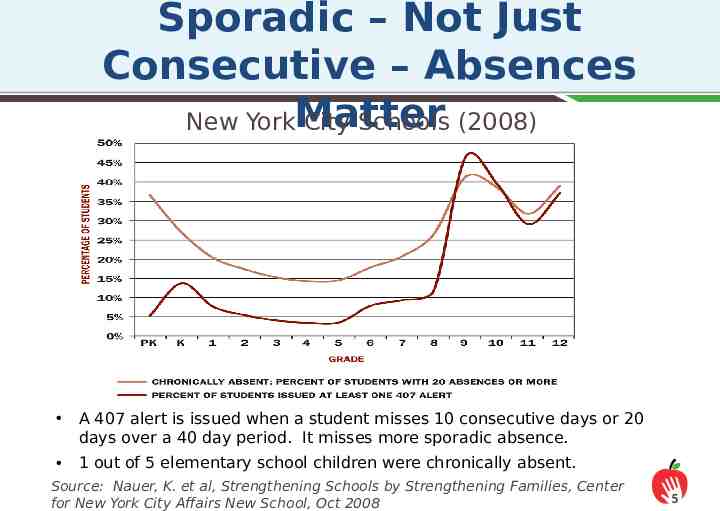
Sporadic – Not Just Consecutive – Absences New YorkMatter City Schools (2008) A 407 alert is issued when a student misses 10 consecutive days or 20 days over a 40 day period. It misses more sporadic absence. 1 out of 5 elementary school children were chronically absent. Source: Nauer, K. et al, Strengthening Schools by Strengthening Families, Center for New York City Affairs New School, Oct 2008 5
Chronic Absence: A Hidden National Crisis Nationwide, as many as 10-15% of students (7.5 million) miss nearly a month of school every year. That’s 135 million days of lost time in the classroom. In some cities, as many as one in four students are missing that much school. Chronic absenteeism is a red alert that students are headed for academic trouble and eventually for dropping out of high school. Poor attendance isn’t just a problem in high school. It can start as early as kindergarten and 6
The Campaign for Grade-Level Reading The Campaign for Grade-Level Reading is focusing on three challenges to reading success that are amenable to community solutions: The Readiness Gap: Too many children from low-income families begin school already far behind. The Attendance Gap (Chronic Absence): Too many children from low-income families miss too many days of school. The Summer Slide (Summer Learning Loss): Too many children lose ground 7
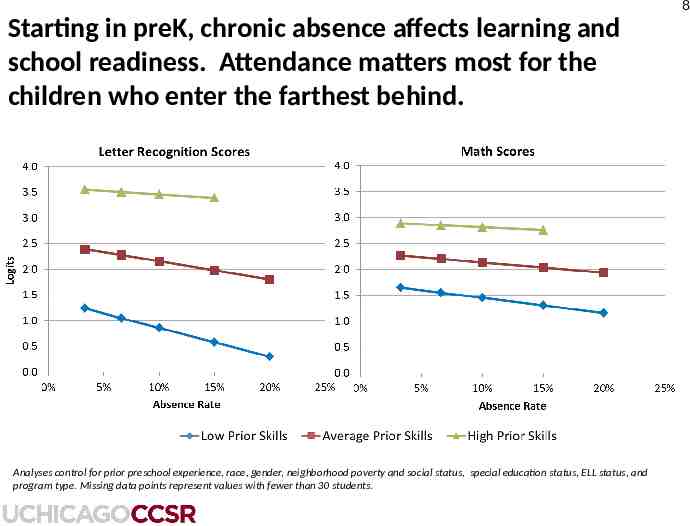
8 Starting in preK, chronic absence affects learning and school readiness. Attendance matters most for the children who enter the farthest behind. Analyses control for prior preschool experience, race, gender, neighborhood poverty and social status, special education status, ELL status, and program type. Missing data points represent values with fewer than 30 students.
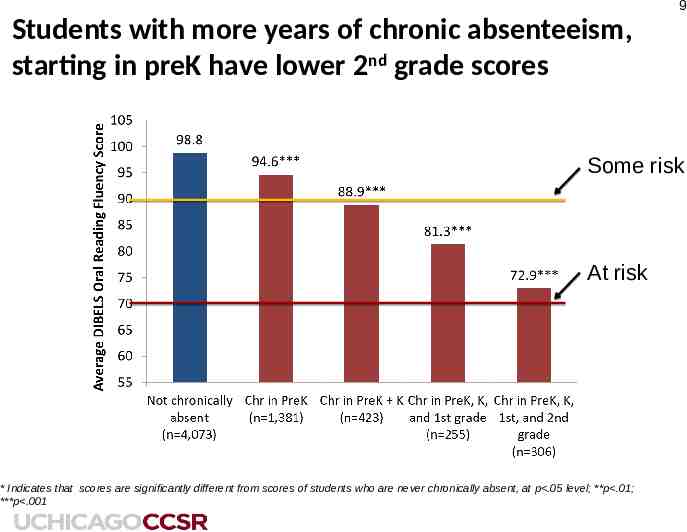
9 Students with more years of chronic absenteeism, starting in preK have lower 2nd grade scores Some risk At risk * Indicates that scores are significantly different from scores of students who are never chronically absent, at p .05 level; **p .01; ***p .001
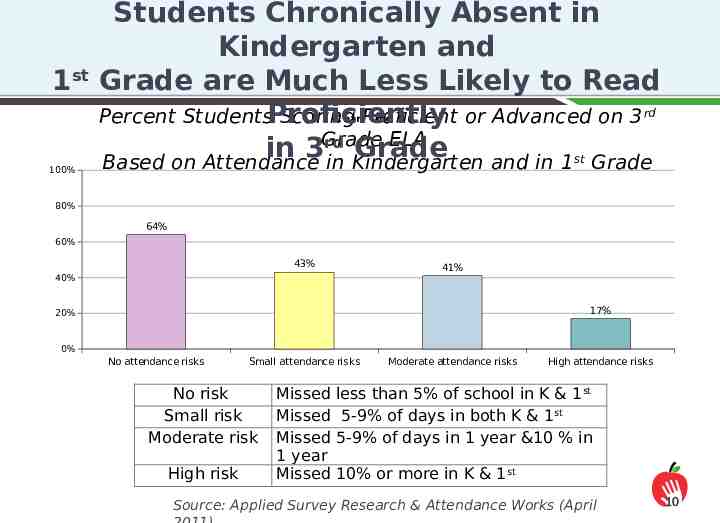
Students Chronically Absent in Kindergarten and 1st Grade are Much Less Likely to Read Percent StudentsProficiently Scoring Proficient or Advanced on 3 rd Grade ELA rd in 3 Grade Based on Attendance in Kindergarten and in 1st Grade Chart Title 100% 80% 64% 60% 43% 41% 40% 17% 20% 0% No attendance risks Small attendance risks No risk Small risk Moderate risk High risk Missed Missed Missed 1 year Missed Moderate attendance risks High attendance risks less than 5% of school in K & 1 st 5-9% of days in both K & 1st 5-9% of days in 1 year &10 % in 10% or more in K & 1st Source: Applied Survey Research & Attendance Works (April 10
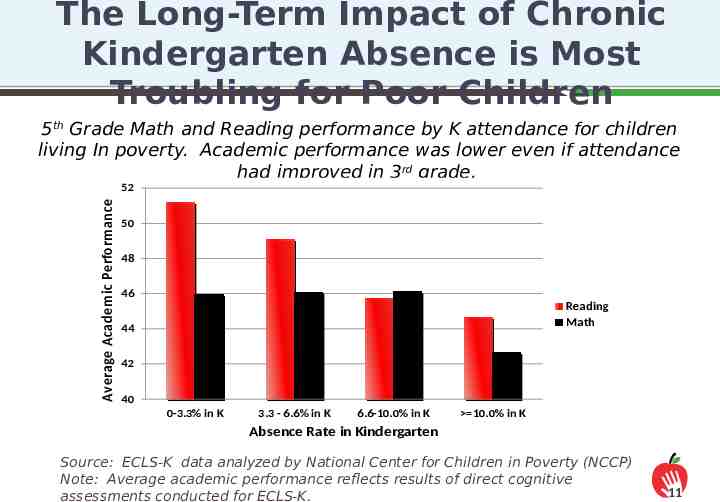
The Long-Term Impact of Chronic Kindergarten Absence is Most Troubling for Poor Children 5th Grade Math and Reading performance by K attendance for children living In poverty. Academic performance was lower even if attendance had improved in 3rd grade. Average Academic Performance 52 50 48 46 Reading Math 44 42 40 0-3.3% in K 3.3 - 6.6% in K 6.6-10.0% in K 10.0% in K Absence Rate in Kindergarten Source: ECLS-K data analyzed by National Center for Children in Poverty (NCCP) Note: Average academic performance reflects results of direct cognitive assessments conducted for ECLS-K. 11
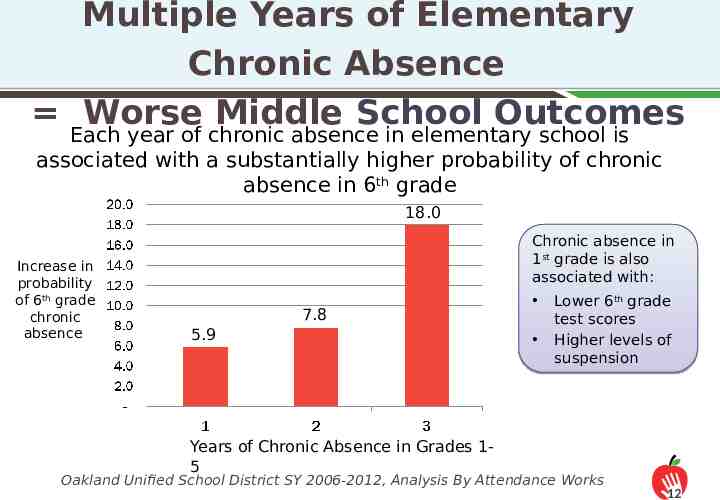
Multiple Years of Elementary Chronic Absence Worse Middle School Outcomes Each year of chronic absence in elementary school is associated with a substantially higher probability of chronic absence in 6th grade 18.0 x Increase in probability of 6th grade chronic absence 5.9 x 7.8 x Chronic absence in 1st grade is also associated with: Lower 6th grade test scores Higher levels of suspension Years of Chronic Absence in Grades 15 Oakland Unified School District SY 2006-2012, Analysis By Attendance Works 12
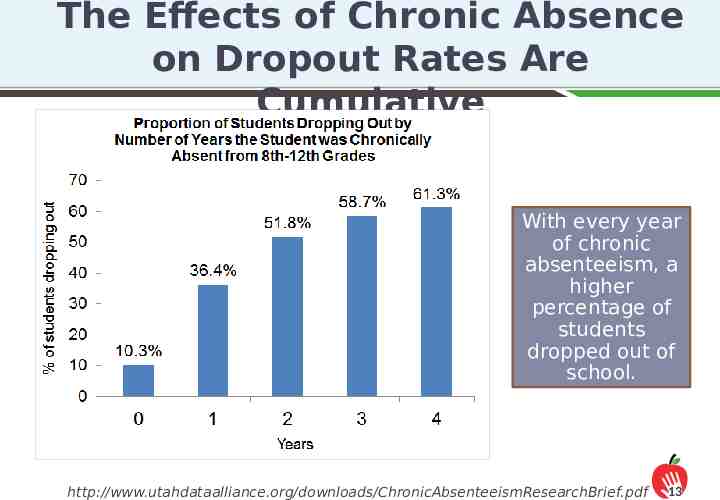
The Effects of Chronic Absence on Dropout Rates Are Cumulative With every year of chronic absenteeism, a higher percentage of students dropped out of school. http://www.utahdataalliance.org/downloads/ChronicAbsenteeismResearchBrief.pdf 13
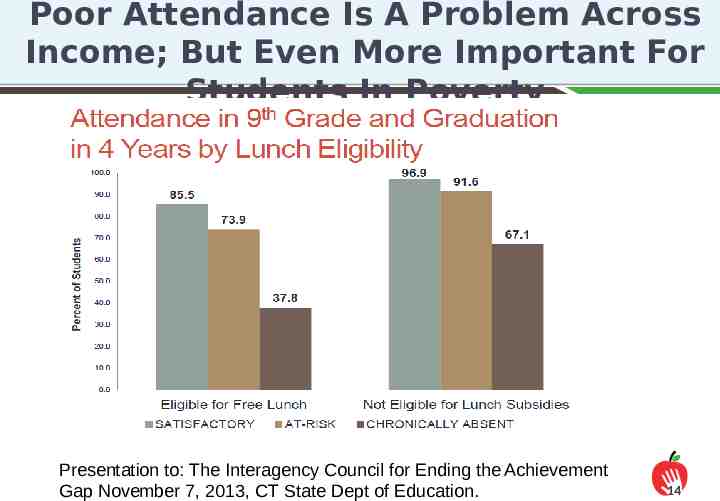
Poor Attendance Is A Problem Across Income; But Even More Important For Students In Poverty Presentation to: The Interagency Council for Ending the Achievement Gap November 7, 2013, CT State Dept of Education. 14
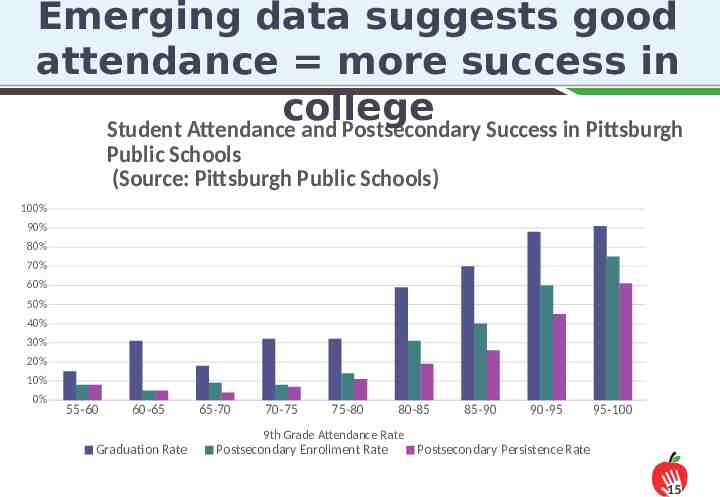
Emerging data suggests good attendance more success in college Student Attendance and Postsecondary Success in Pittsburgh Public Schools (Source: Pittsburgh Public Schools) 100% 90% 80% 70% 60% 50% 40% 30% 20% 10% 0% 55-60 60-65 65-70 70-75 75-80 80-85 85-90 90-95 95-100 9th Grade Attendance Rate Graduation Rate Postsecondary Enrollment Rate Postsecondary Persistence Rate 15
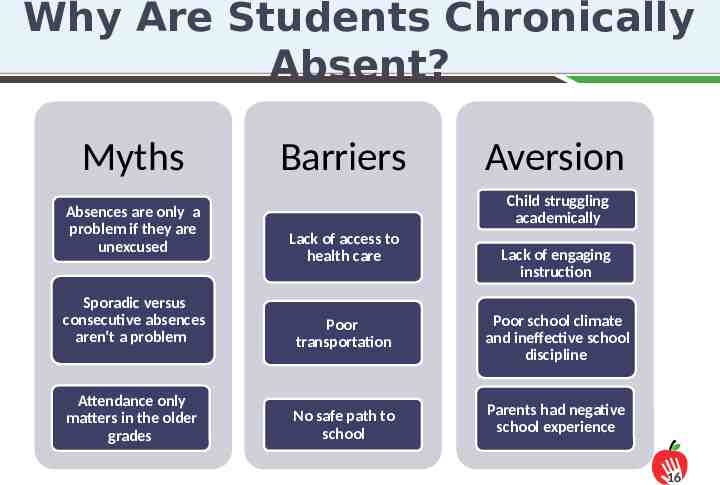
Why Are Students Chronically Absent? Myths Absences are only a problem if they are unexcused Barriers Aversion Child struggling academically Lack of access to health care Lack of engaging instruction Sporadic versus consecutive absences aren’t a problem Poor transportation Poor school climate and ineffective school discipline Attendance only matters in the older grades No safe path to school Parents had negative school experience 16
Going to School Every Day Reflects Hope for a better future Faith that school will help you or your child succeed Capacity Resources, skills, knowledge needed to get to school 17
Universal Strategies for Building a Culture of Attendance & Identifying Barriers 18
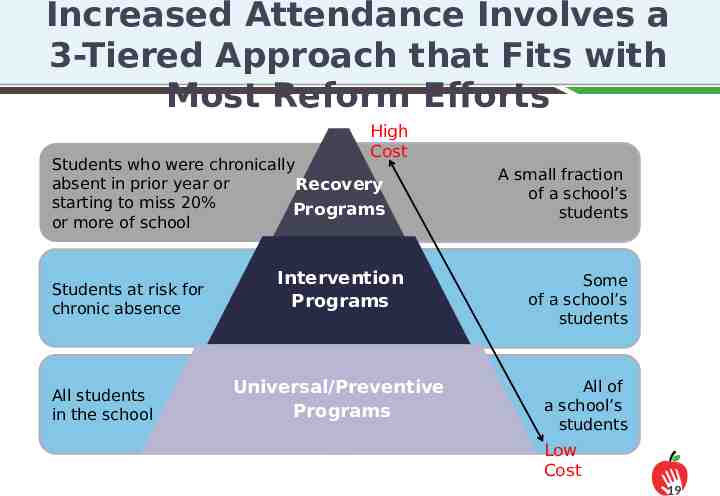
Increased Attendance Involves a 3-Tiered Approach that Fits with Most Reform Efforts High Cost Students who were chronically absent in prior year or Recovery starting to miss 20% Programs or more of school Students at risk for chronic absence All students in the school Intervention Programs Universal/Preventive Programs A small fraction of a school’s students Some of a school’s students All of a school’s students Low Cost 19
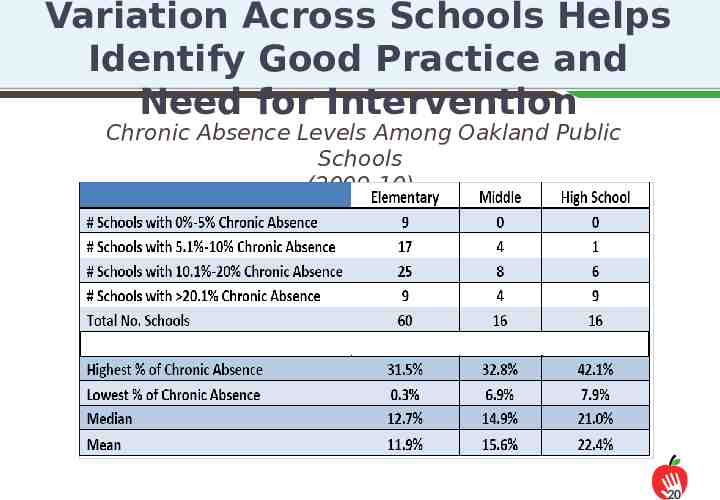
Variation Across Schools Helps Identify Good Practice and Need for Intervention Chronic Absence Levels Among Oakland Public Schools (2009-10) 20
Ingredients for Systemwide Success & Sustainability District Community Conveys why building a habit of attendance is important and what chronic absence is Positive Messagin g Schools Actionabl e Data Is accurate, accessible, and regularly reported Students & Families Ensures monitoring & incentives to address chronic absence Shared Accountabili ty Capacity Building Strategic partnerships between district and community partners address specific attendance barriers and mobilize support for all ingredients Expands ability to interpret data and work together to adopt best practices 21
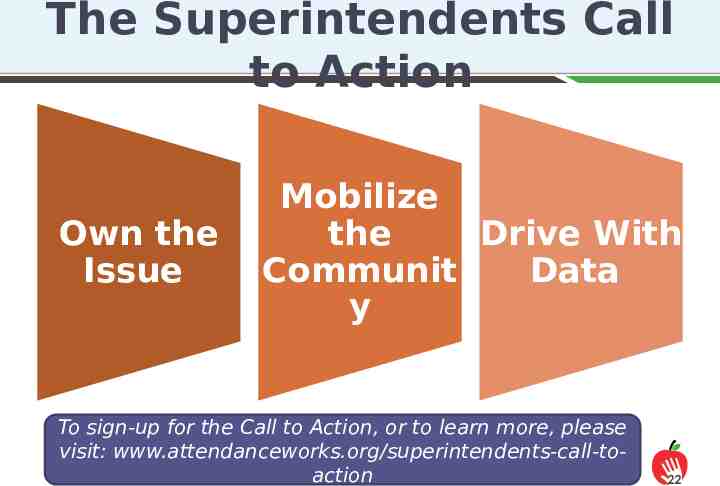
The Superintendents Call to Action Own the Issue Mobilize the Drive With Communit Data y To sign-up for the Call to Action, or to learn more, please visit: www.attendanceworks.org/superintendents-call-toaction 22
Using September to Promote Attendance Awareness http://www.attendanceworks.org/attendancemonth/ 23
Key Messages Key Message #1: Good attendance helps children do well in school and eventually in the work place. 24
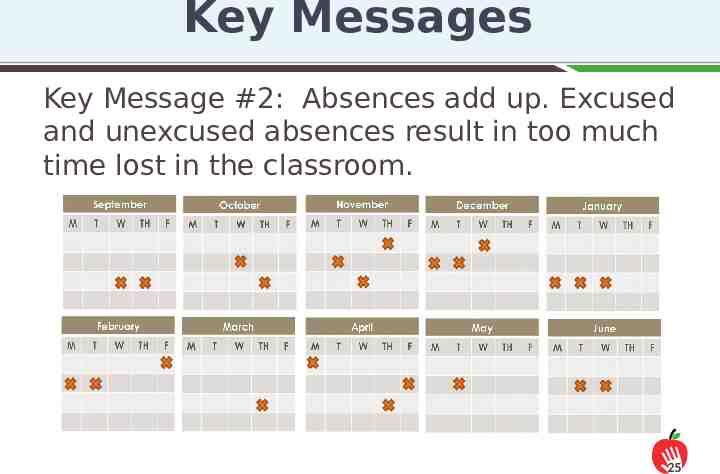
Key Messages Key Message #2: Absences add up. Excused and unexcused absences result in too much time lost in the classroom. 25
Key Messages Key Message #3: Chronic absence, missing 10 percent of the school year or more, affects the whole classroom, not just the students who miss school. 26
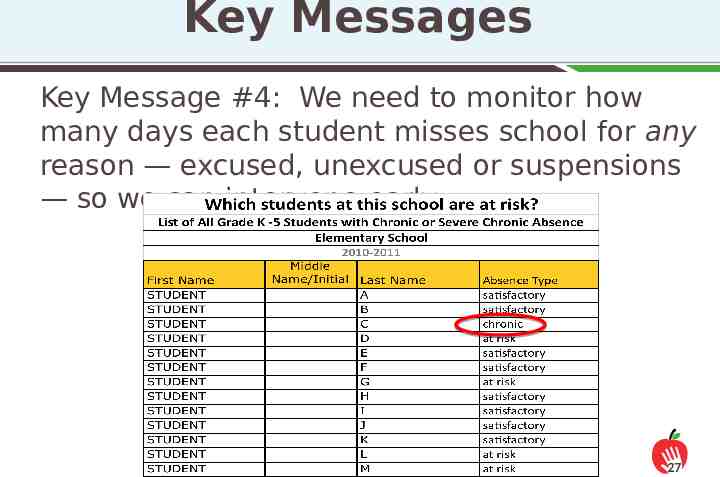
Key Messages Key Message #4: We need to monitor how many days each student misses school for any reason — excused, unexcused or suspensions — so we can intervene early. 27
Key Messages Key Message #5: Chronic absence is a problem we can solve when the whole community, including parents and schools, gets involved. 28
Key Messages Key Message #6: Relationship building is fundamental to any strategy for improving student attendance. 29
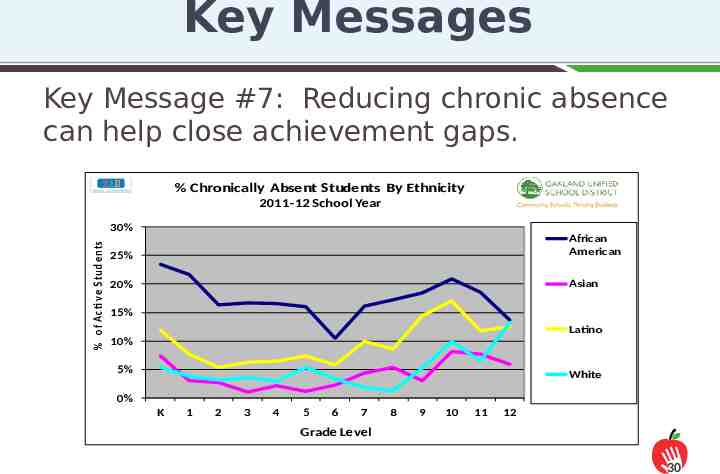
Key Messages Key Message #7: Reducing chronic absence can help close achievement gaps. % Chronically Absent Students By Ethnicity 2011-12 School Year % o f A cti v e S tu d en ts 30% 25% African American 20% Asian 15% Latino 10% 5% White 0% K 1 2 3 4 5 6 7 8 9 10 11 12 Grade Level 30
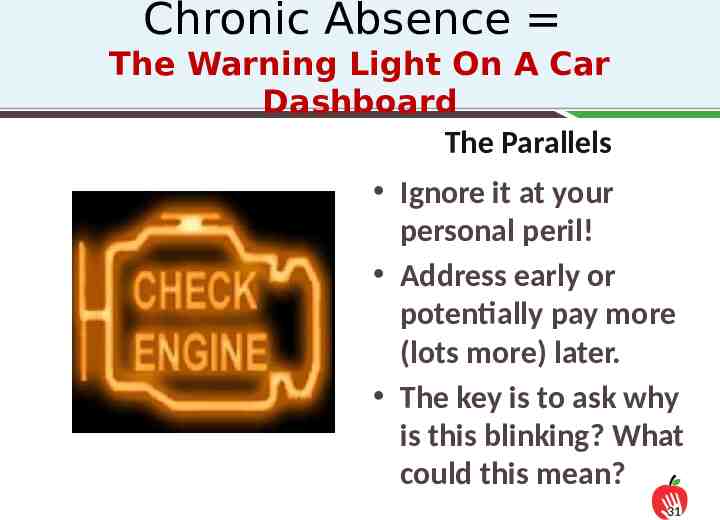
Chronic Absence The Warning Light On A Car Dashboard The Parallels Ignore it at your personal peril! Address early or potentially pay more (lots more) later. The key is to ask why is this blinking? What could this mean? 31
Attendance Works Hedy Chang, Director [email protected] Cecelia Leong, Associate Director [email protected] Phyllis Jordan, Communications Lead [email protected] 301.656.0348 Sue Fothergill, Senior Policy Fellow [email protected] Elise Dizon-Ross, Manager, Research & Development [email protected] www.attendanceworks.org