A Study of Unproductive Units Business Administration AS and

15 Slides626.51 KB
A Study of Unproductive Units Business Administration AS and AST Graduates, 2015-16 Report Prepared by Santa Ana College Research Report Prepared by: Whitney Youngren, M.A.
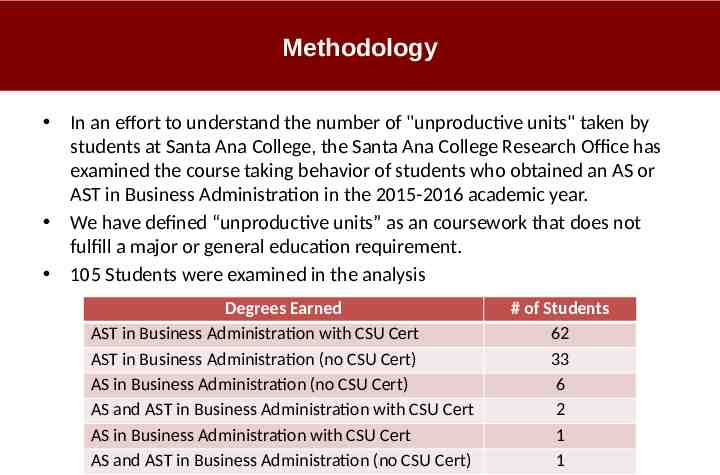
Methodology In an effort to understand the number of "unproductive units" taken by students at Santa Ana College, the Santa Ana College Research Office has examined the course taking behavior of students who obtained an AS or AST in Business Administration in the 2015-2016 academic year. We have defined “unproductive units” as an coursework that does not fulfill a major or general education requirement. 105 Students were examined in the analysis Degrees Earned AST in Business Administration with CSU Cert AST in Business Administration (no CSU Cert) AS in Business Administration (no CSU Cert) AS and AST in Business Administration with CSU Cert AS in Business Administration with CSU Cert AS and AST in Business Administration (no CSU Cert) # of Students 62 33 6 2 1 1
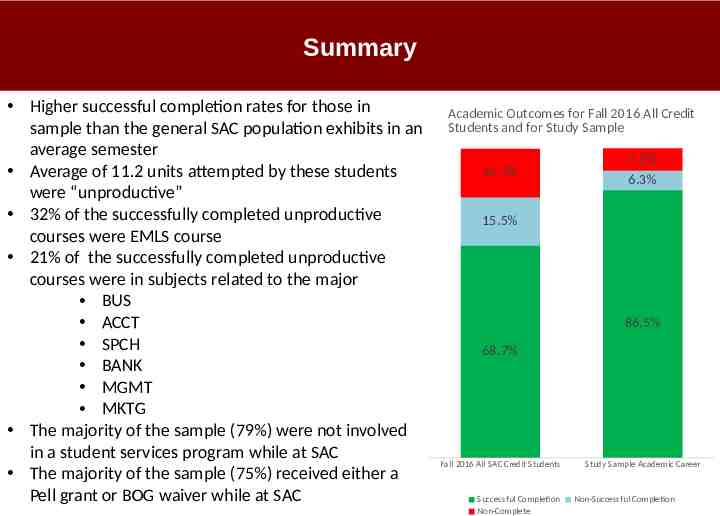
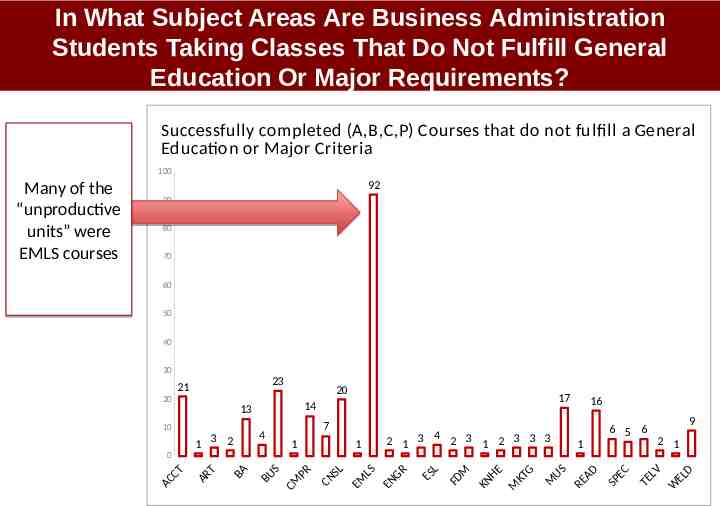
Summary Higher successful completion rates for those in sample than the general SAC population exhibits in an average semester Average of 11.2 units attempted by these students were “unproductive” 32% of the successfully completed unproductive courses were EMLS course 21% of the successfully completed unproductive courses were in subjects related to the major BUS ACCT SPCH BANK MGMT MKTG The majority of the sample (79%) were not involved in a student services program while at SAC The majority of the sample (75%) received either a Pell grant or BOG waiver while at SAC Academic Outcomes for Fall 2016 All Credit Students and for Study Sample 15.7% 7.2% 6.3% 15.5% 86.5% 68.7% Fall 2016 All SAC Credit Students Successful Completion Non-Complete Study Sample Academic Career Non-Successful Completion
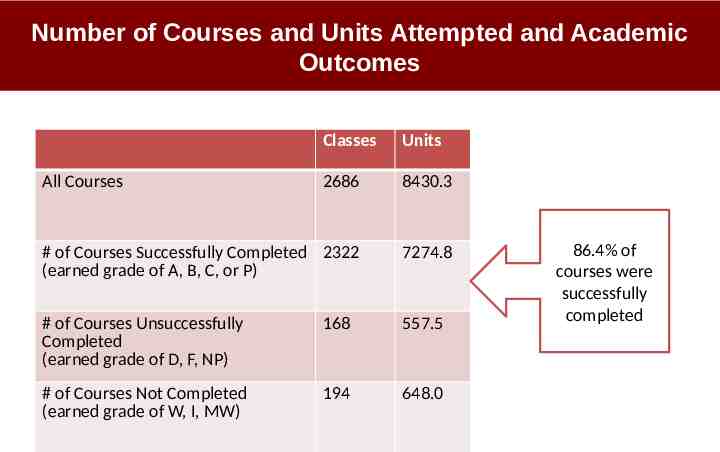
Number of Courses and Units Attempted and Academic Outcomes Classes Units 2686 8430.3 # of Courses Successfully Completed 2322 (earned grade of A, B, C, or P) 7274.8 # of Courses Unsuccessfully Completed (earned grade of D, F, NP) 168 557.5 # of Courses Not Completed (earned grade of W, I, MW) 194 648.0 All Courses 86.4% of courses were successfully completed
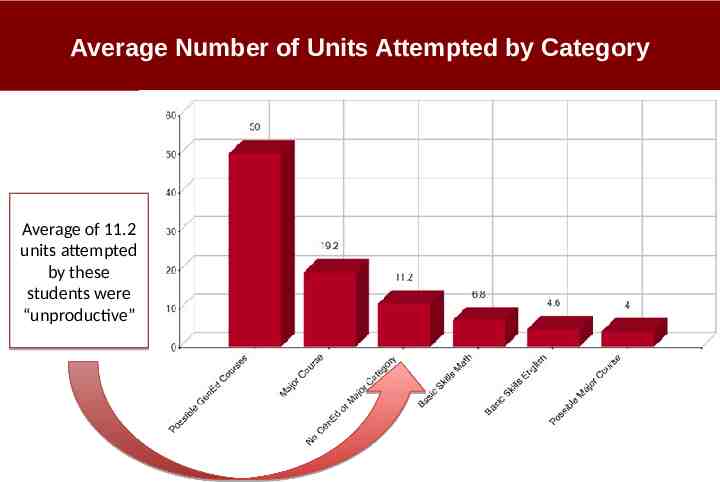
Average Number of Units Attempted by Category Average of 11.2 units attempted by these students were “unproductive”
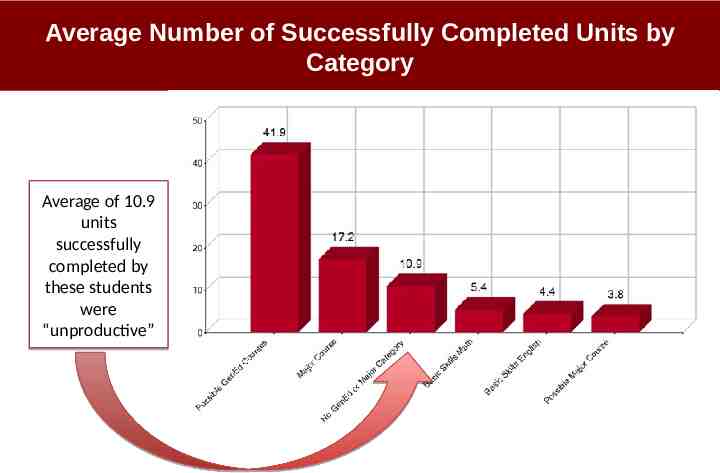
Average Number of Successfully Completed Units by Category Average of 10.9 units successfully completed by these students were “unproductive”
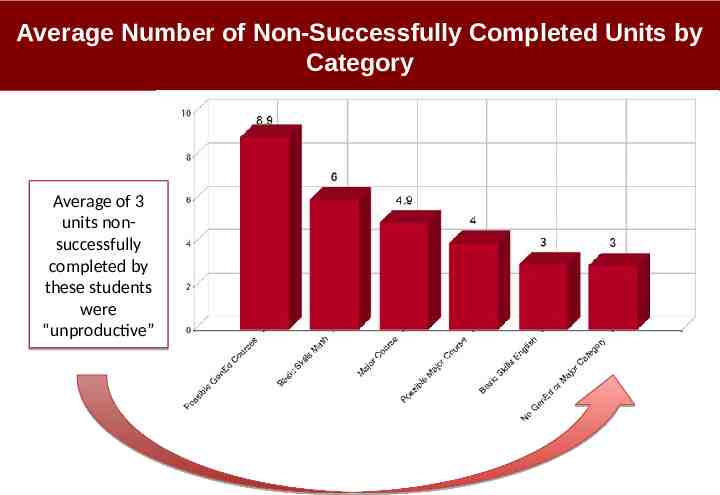
Average Number of Non-Successfully Completed Units by Category Average of 3 units nonsuccessfully completed by these students were “unproductive”
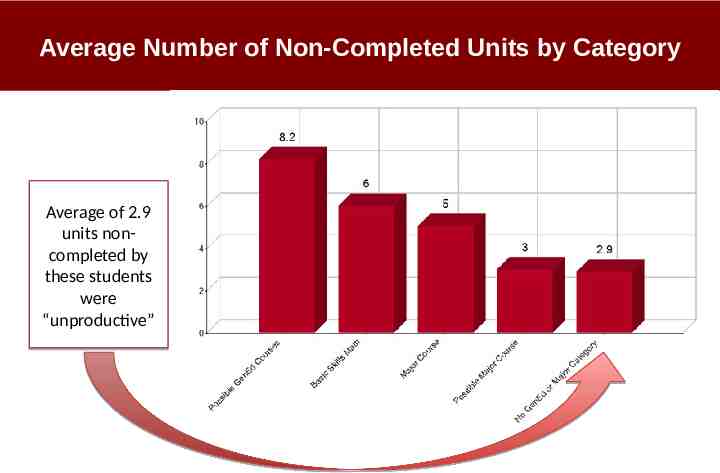
Average Number of Non-Completed Units by Category Average of 2.9 units noncompleted by these students were “unproductive”
In What Subject Areas Are Business Administration Students Taking Classes That Do Not Fulfill General Education Or Major Requirements? Successfully completed (A,B,C,P) Courses that do not fulfill a General Education or Major Criteria 100 Many of the “unproductive units” were EMLS courses 92 90 80 70 60 50 40 30 23 21 20 20 10 7 4 1 3 2 17 14 13 1 2 1 3 4 2 3 1 2 3 3 3 1 16 1 6 5 6 9 2 1 0 C AC T T AR BA S BU CM PR SL N C EM LS GR N E L ES M FD G HE KT N K M M US AD RE EC SP TE LV EL W D
Demographics and Program Involvement of Study Subjects
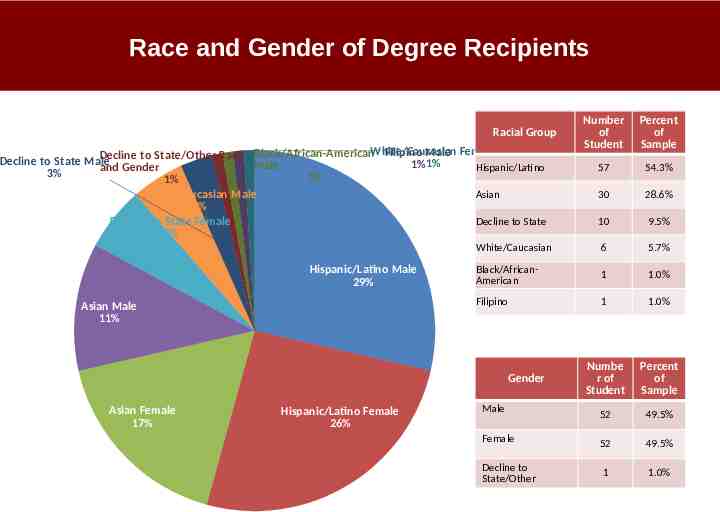
Race and Gender of Degree Recipients Number of Student Percent of Sample 57 54.3% 30 28.6% 10 9.5% White/Caucasian 6 5.7% Black/AfricanAmerican 1 1.0% Filipino 1 1.0% Numbe r of Student Percent of Sample 52 49.5% 52 49.5% 1 1.0% Racial Group Filipino Male Female Decline to State/Other Race Black/African-AmericanWhite/Caucasian Decline to State Male 1% 1% Male Hispanic/Latino and Gender 3% 1% 1% White/Caucasian Male Asian 5% Decline to State Female Decline to State 6% Hispanic/Latino Male 29% Asian Male 11% Gender Asian Female 17% Hispanic/Latino Female 26% Male Female Decline to State/Other
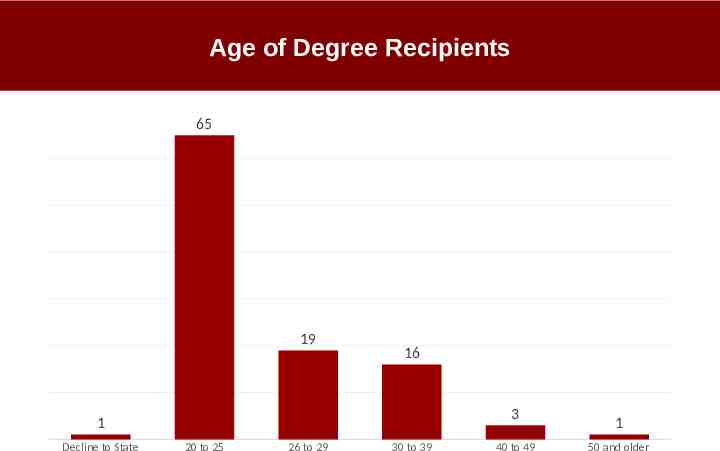
Age of Degree Recipients 65 19 16 3 1 Decline to State 20 to 25 26 to 29 30 to 39 40 to 49 1 50 and older
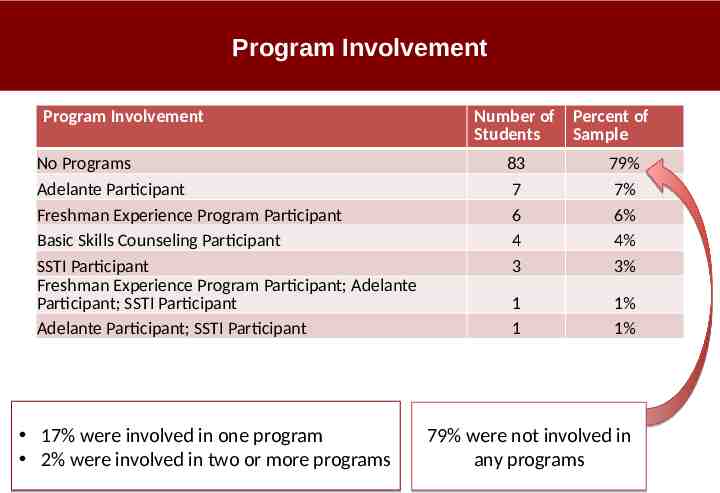
Program Involvement Program Involvement No Programs Adelante Participant Freshman Experience Program Participant Basic Skills Counseling Participant SSTI Participant Freshman Experience Program Participant; Adelante Participant; SSTI Participant Adelante Participant; SSTI Participant 17% were involved in one program 2% were involved in two or more programs Number of Percent of Students Sample 83 7 6 4 3 79% 7% 6% 4% 3% 1 1 1% 1% 79% were not involved in any programs
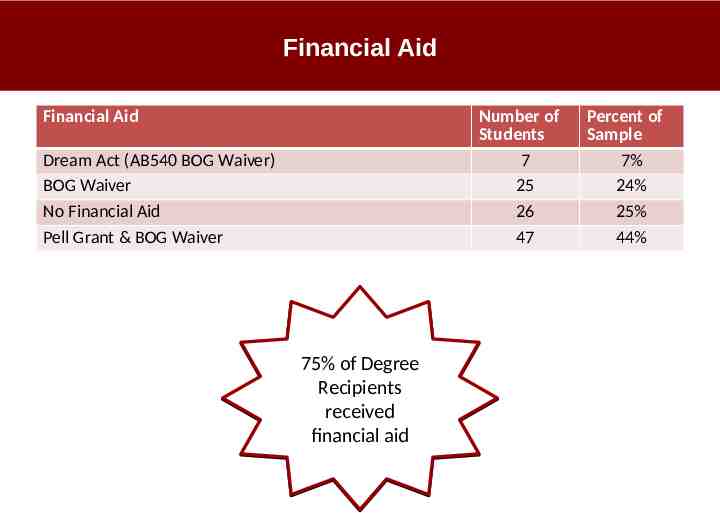
Financial Aid Financial Aid Number of Students 7 25 26 47 Dream Act (AB540 BOG Waiver) BOG Waiver No Financial Aid Pell Grant & BOG Waiver 75% of Degree Recipients received financial aid Percent of Sample 7% 24% 25% 44%
Source and Department Information Janice Love, M.A. Director of College Research Renee Limback Research Analyst Yan Ma, M.A. Research Analyst Whitney Youngren, M.A. Research Analyst Data Source Information Source: RSCCD Data Warehouse, Student Degree table, Term “20152”, “20153”, “20161”, & “20160”, Degrees included: "SAC.BUS.AST, SAC.CSU.CA, SAC.CSU.CTF“, "SAC.BUS.AST", "SAC.BUS.AS", "SAC.BUS.AST, SAC.CSU.CTF", "SAC.BUS.AS”, SAC.BUS.AST,SAC.CSU.CA,SAC.CSU.CTF", "SAC.BUS.AS,SAC.BUS.AST", "SAC.BUS.AS, SAC.CSU.CA, SAC.CSU.CTF"; SEAT