Zephyr/Science Photo Library Basis of the BOLD signal Maria Molina


46 Slides8.77 MB
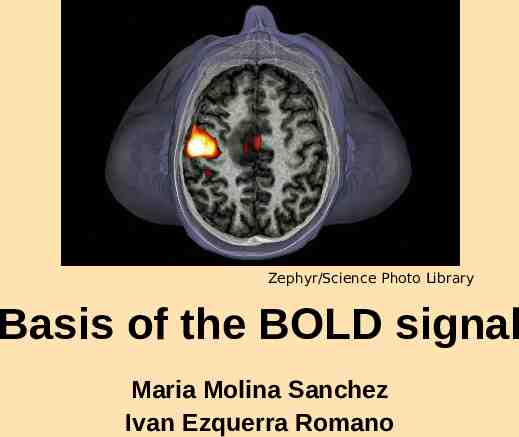
Zephyr/Science Photo Library Basis of the BOLD signal Maria Molina Sanchez Ivan Ezquerra Romano
MRI BASICS fMRI - BOLD SIGNAL 2
The MRI Scanner Earth’s magnetic field: 0.00003 Tesla 3 Clinical MRI: 1.5 - 7 Tesla
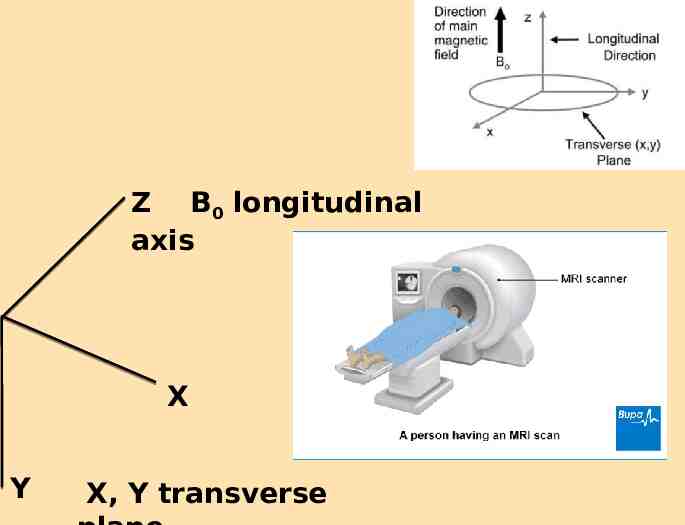
Z B0 longitudinal axis X Y X, Y transverse
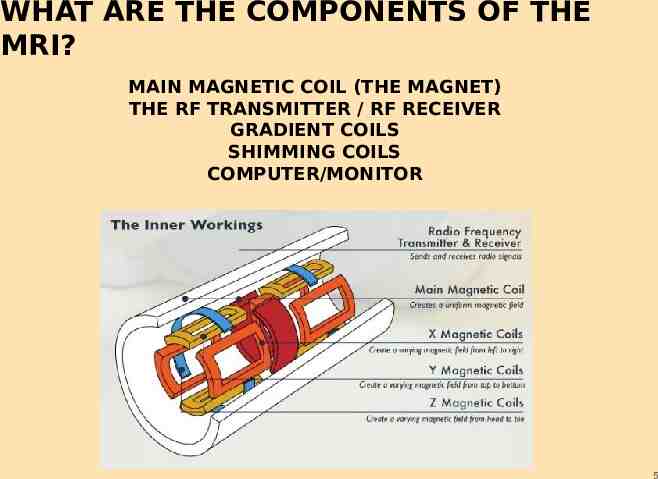
WHAT ARE THE COMPONENTS OF THE MRI? MAIN MAGNETIC COIL (THE MAGNET) THE RF TRANSMITTER / RF RECEIVER GRADIENT COILS SHIMMING COILS COMPUTER/MONITOR 5
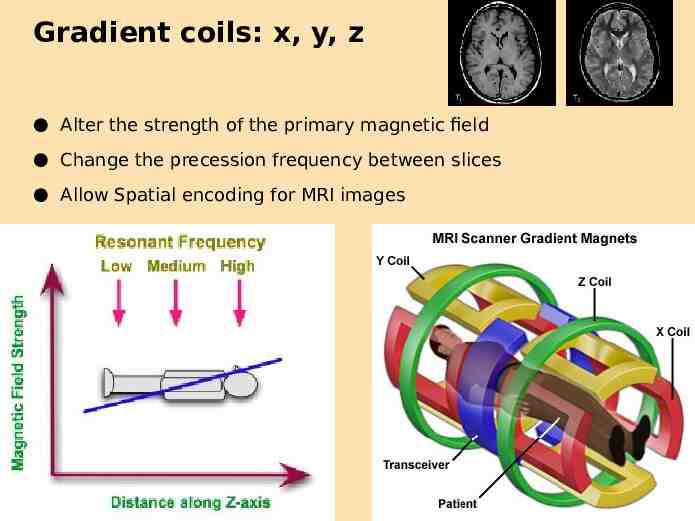
Gradient coils: x, y, z 6 Alter the strength of the primary magnetic field Change the precession frequency between slices Allow Spatial encoding for MRI images
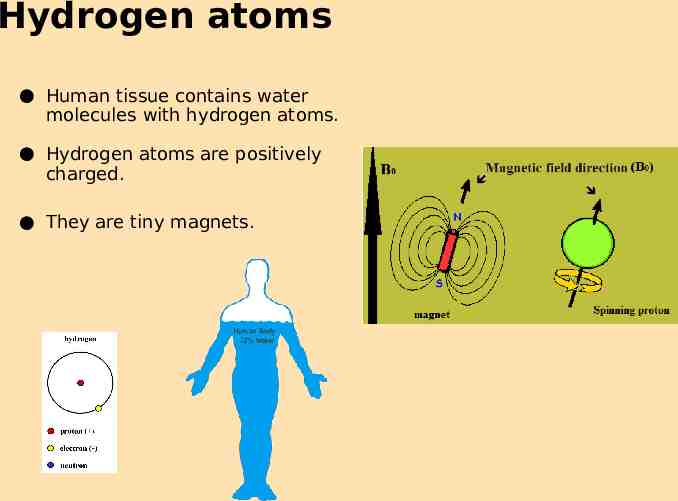
Hydrogen atoms Human tissue contains water molecules with hydrogen atoms. Hydrogen atoms are positively charged. They are tiny magnets.
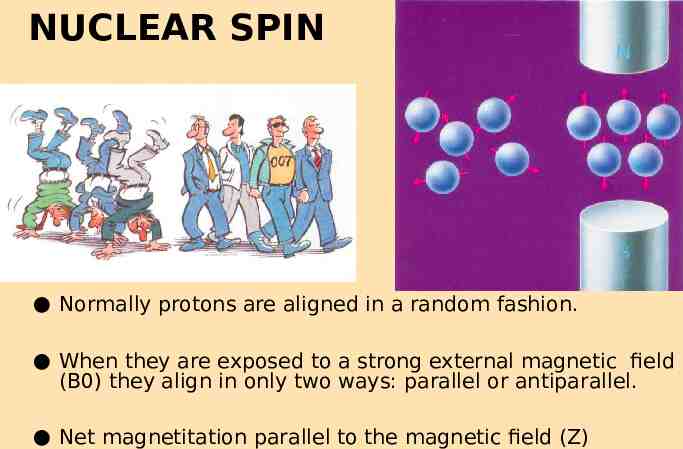
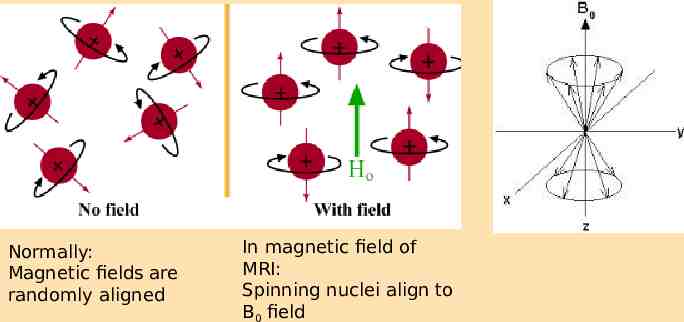
NUCLEAR SPIN 8 Normally protons are aligned in a random fashion. When they are exposed to a strong external magnetic field (B0) they align in only two ways: parallel or antiparallel. Net magnetitation parallel to the magnetic field (Z)
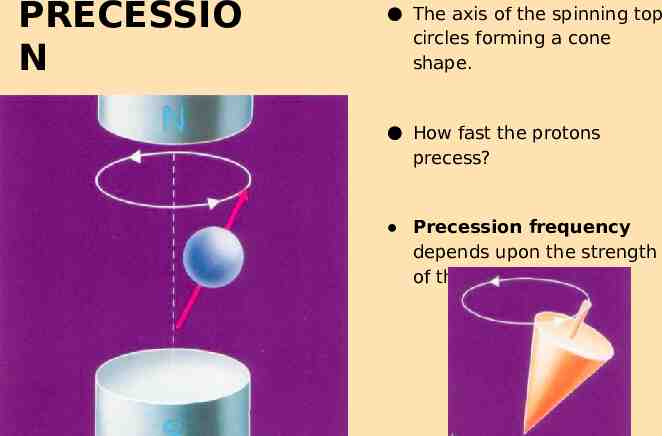
PRECESSIO N The axis of the spinning top circles forming a cone shape. How fast the protons precess? Precession frequency depends upon the strength of the magnetic field.
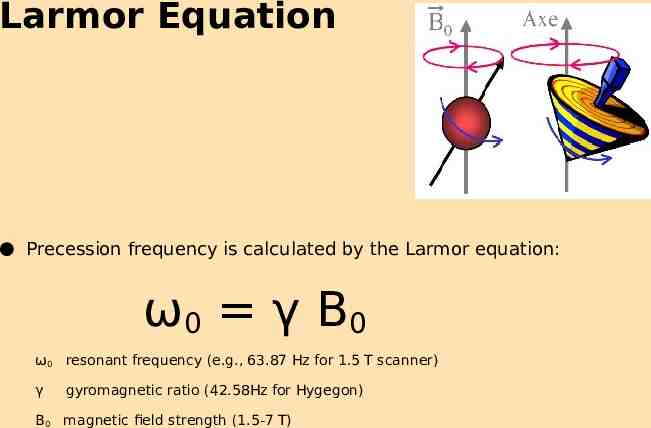
Larmor Equation 10 Precession frequency is calculated by the Larmor equation: ω0 γ Β 0 ω0 resonant frequency (e.g., 63.87 Hz for 1.5 T scanner) γ gyromagnetic ratio (42.58Hz for Hygegon) Β0 magnetic field strength (1.5-7 T)
Normally: Magnetic fields are randomly aligned In magnetic field of MRI: Spinning nuclei align to B0 field
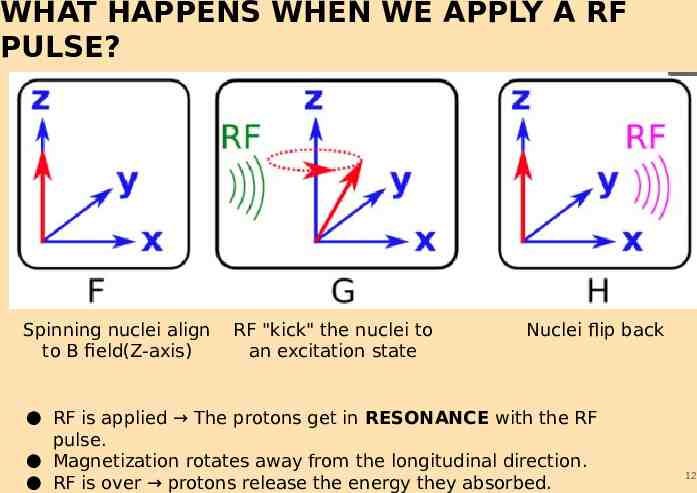
WHAT HAPPENS WHEN WE APPLY A RF PULSE? Spinning nuclei align to B field(Z-axis) RF "kick" the nuclei to an excitation state Nuclei flip back RF is applied The protons get in RESONANCE with the RF pulse. Magnetization rotates away from the longitudinal direction. RF is over protons release the energy they absorbed. 12
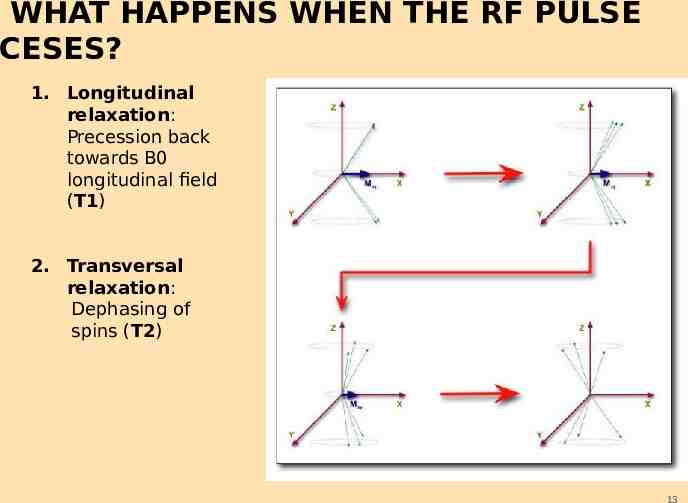
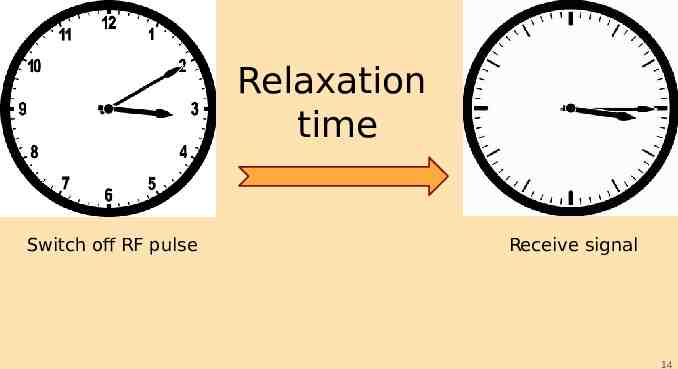
WHAT HAPPENS WHEN THE RF PULSE CESES? 1. Longitudinal relaxation: Precession back towards B0 longitudinal field (T1) 2. Transversal relaxation: Dephasing of spins (T2) 13
Relaxation time Switch off RF pulse Receive signal 14
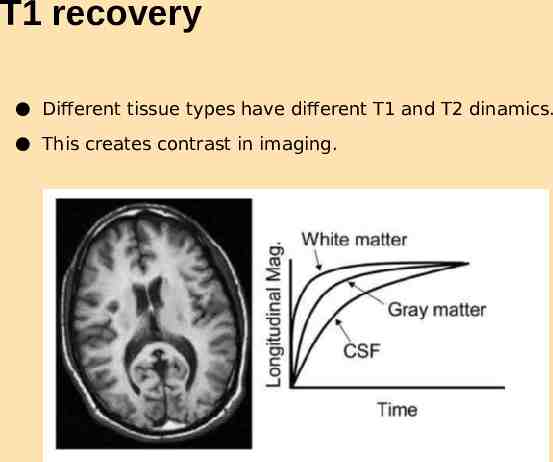
T1 recovery Different tissue types have different T1 and T2 dinamics. This creates contrast in imaging.
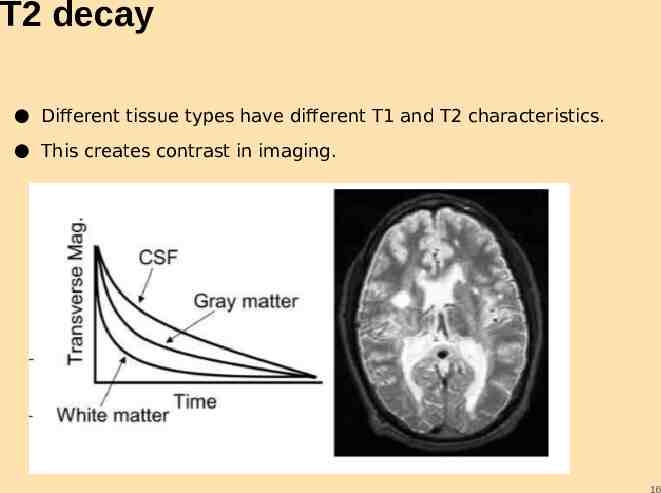
T2 decay Different tissue types have different T1 and T2 characteristics. This creates contrast in imaging. 16
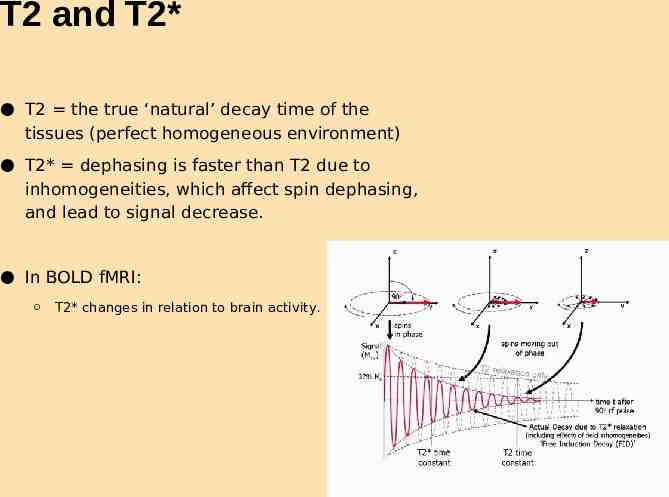
T2 and T2* T2 the true ‘natural’ decay time of the tissues (perfect homogeneous environment) T2* dephasing is faster than T2 due to inhomogeneities, which affect spin dephasing, and lead to signal decrease. In BOLD fMRI: T2* changes in relation to brain activity.
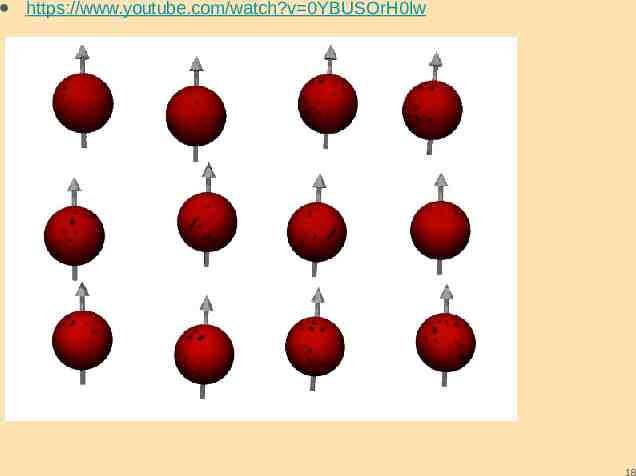
https://www.youtube.com/watch?v 0YBUSOrH0lw 18
The BOLD Signal 19
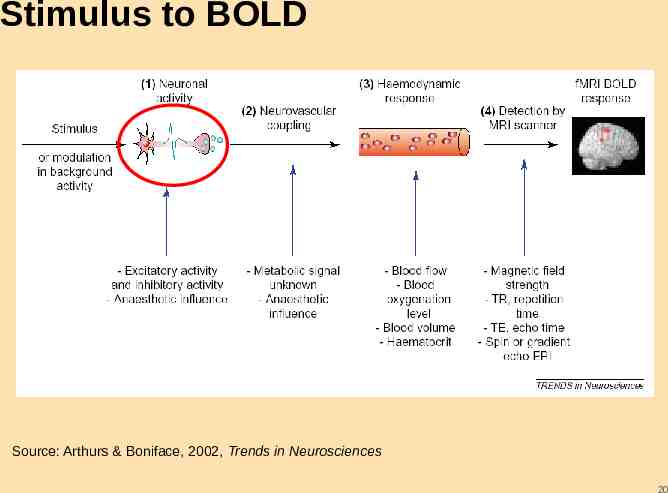
Stimulus to BOLD Source: Arthurs & Boniface, 2002, Trends in Neurosciences 20
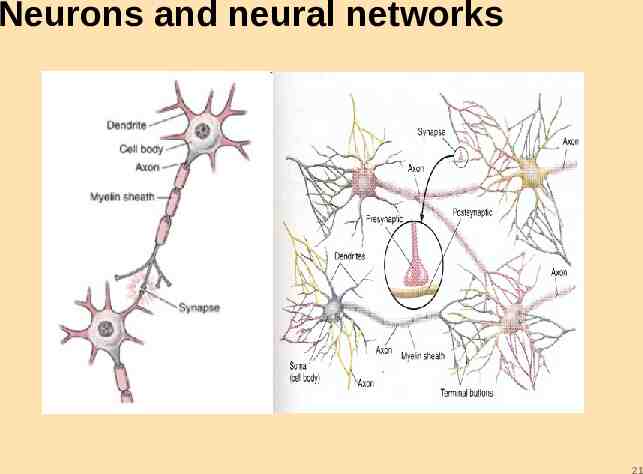
Neurons and neural networks 21
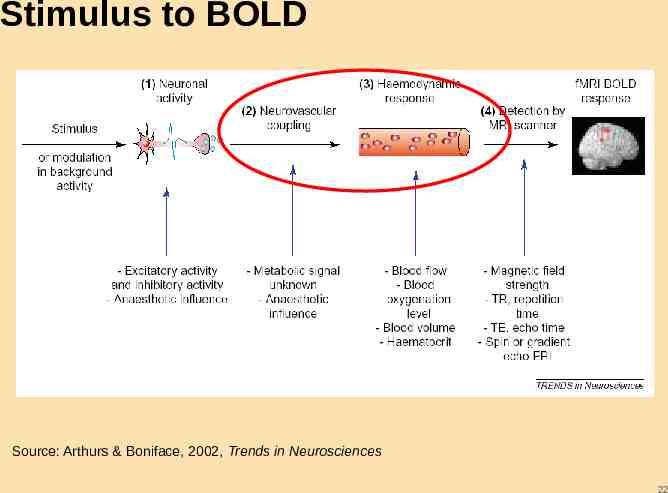
Stimulus to BOLD Source: Arthurs & Boniface, 2002, Trends in Neurosciences 22
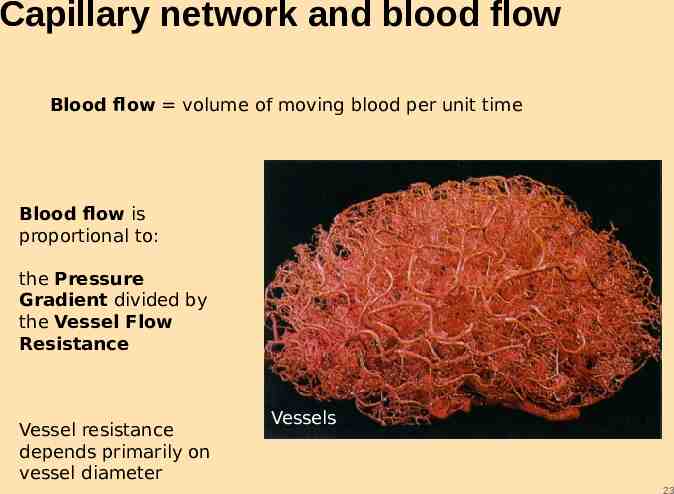
Capillary network and blood flow Blood flow volume of moving blood per unit time Blood flow is proportional to: the Pressure Gradient divided by the Vessel Flow Resistance Vessel resistance depends primarily on vessel diameter Vessels 23
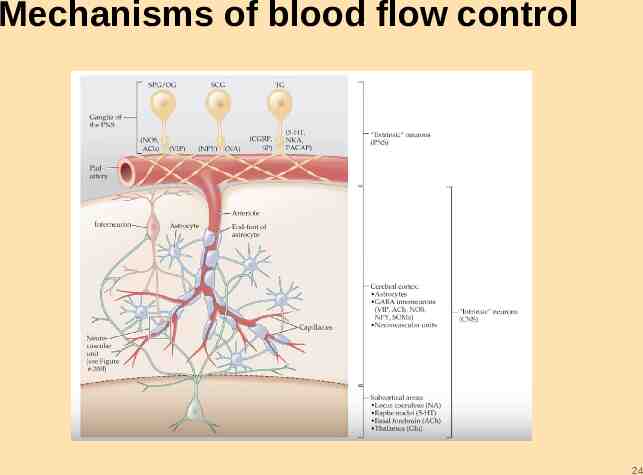
Mechanisms of blood flow control 24
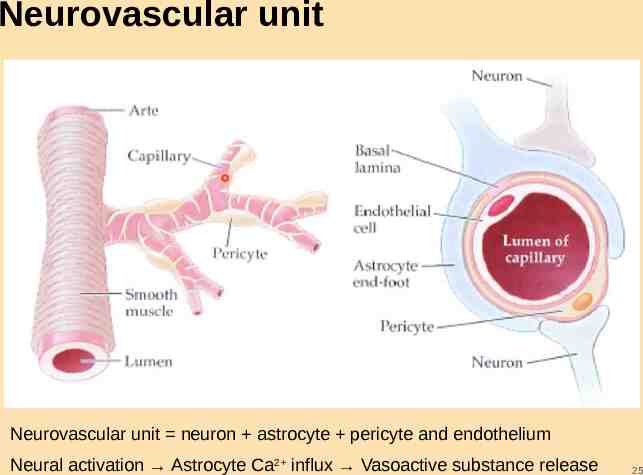
Neurovascular unit Neurovascular unit neuron astrocyte pericyte and endothelium Neural activation Astrocyte Ca2 influx Vasoactive substance release 25
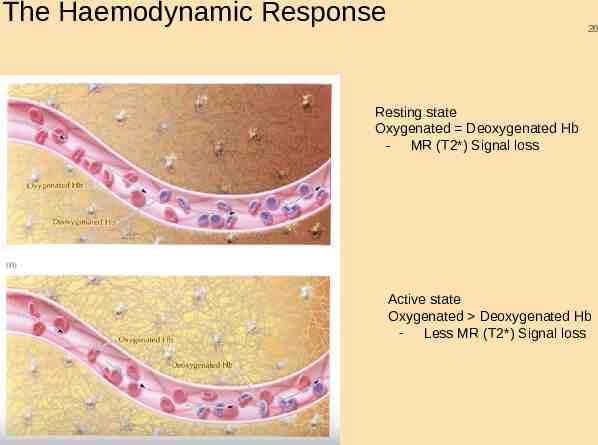
The Haemodynamic Response 26 Resting state Oxygenated Deoxygenated Hb - MR (T2*) Signal loss Active state Oxygenated Deoxygenated Hb - Less MR (T2*) Signal loss
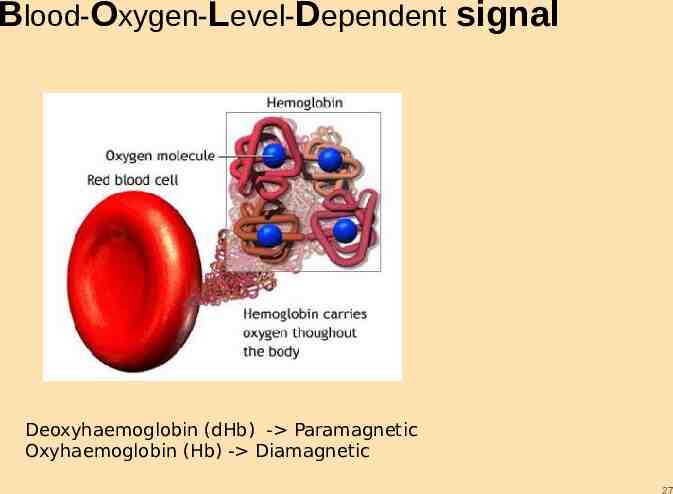
Blood-Oxygen-Level-Dependent signal Deoxyhaemoglobin (dHb) - Paramagnetic Oxyhaemoglobin (Hb) - Diamagnetic 27
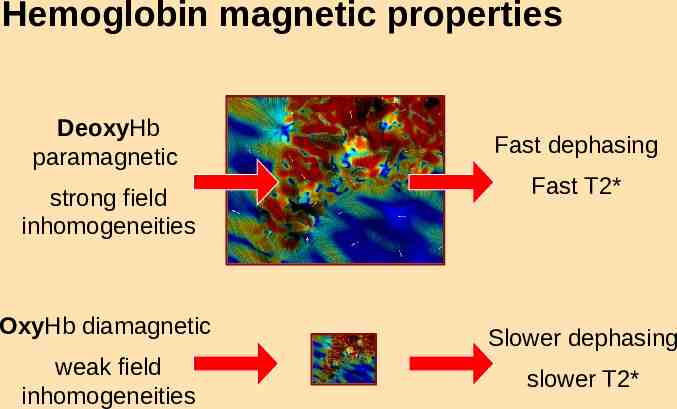
Hemoglobin magnetic properties DeoxyHb paramagnetic Fast dephasing strong field inhomogeneities Fast T2* OxyHb diamagnetic Slower dephasing weak field inhomogeneities slower T2*
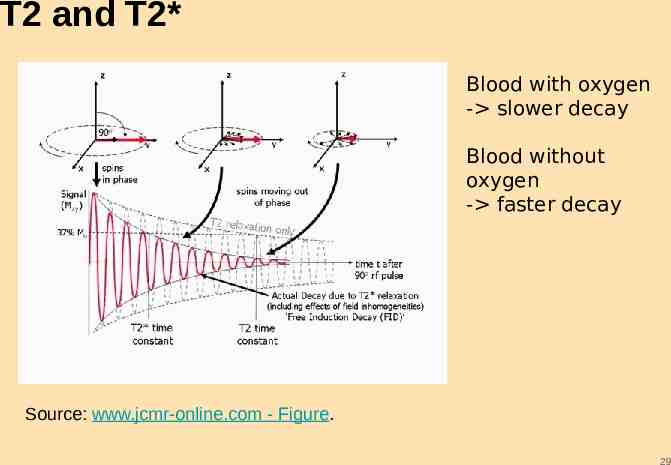
T2 and T2* Blood with oxygen - slower decay Blood without oxygen - faster decay Source: www.jcmr-online.com - Figure. 29
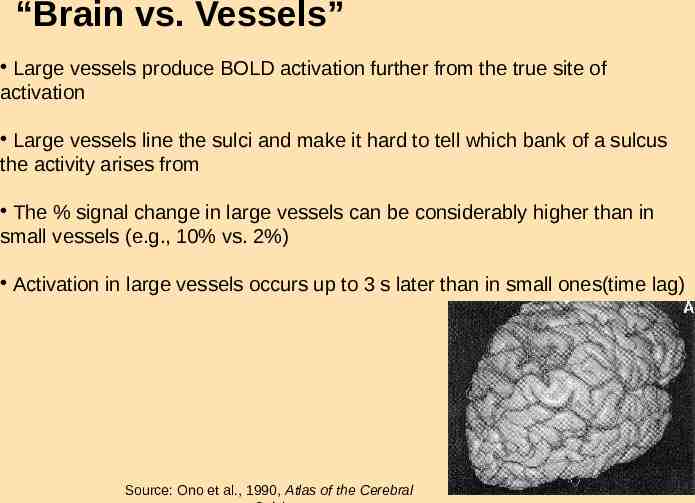
“Brain vs. Vessels” Large vessels produce BOLD activation further from the true site of activation Large vessels line the sulci and make it hard to tell which bank of a sulcus the activity arises from The % signal change in large vessels can be considerably higher than in small vessels (e.g., 10% vs. 2%) Activation in large vessels occurs up to 3 s later than in small ones(time lag) Source: Ono et al., 1990, Atlas of the Cerebral
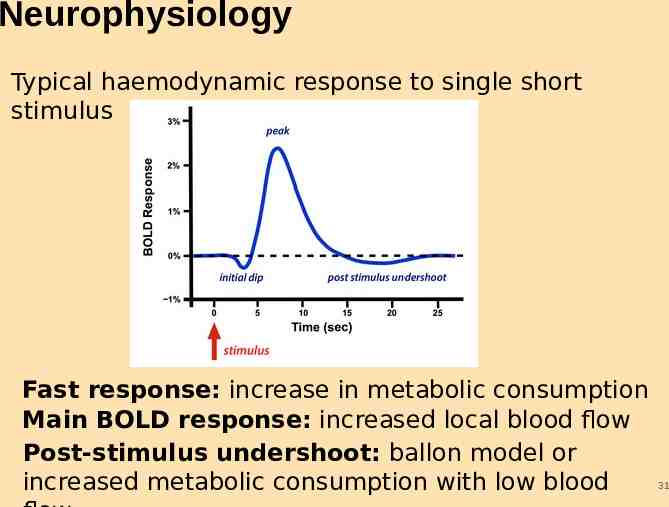
Neurophysiology Typical haemodynamic response to single short stimulus Fast response: increase in metabolic consumption Main BOLD response: increased local blood flow Post-stimulus undershoot: ballon model or increased metabolic consumption with low blood 31
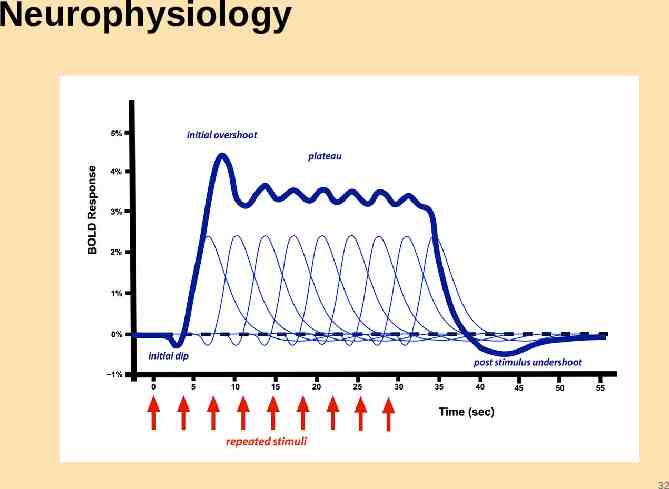
Neurophysiology 32
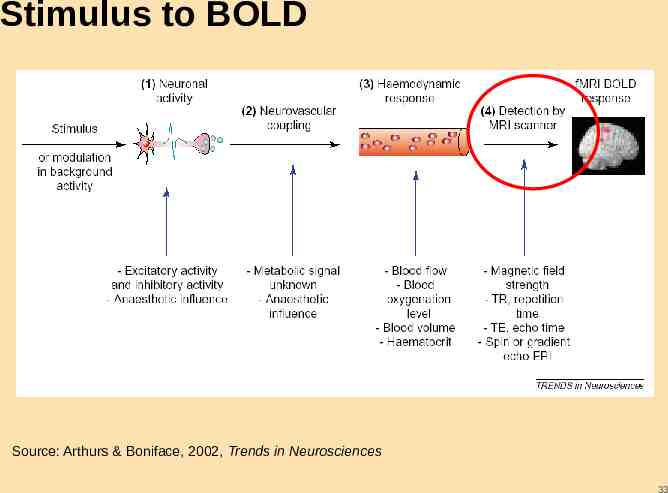
Stimulus to BOLD Source: Arthurs & Boniface, 2002, Trends in Neurosciences 33
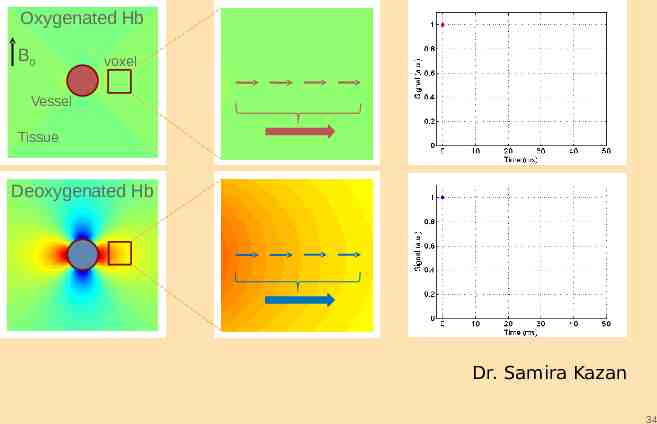
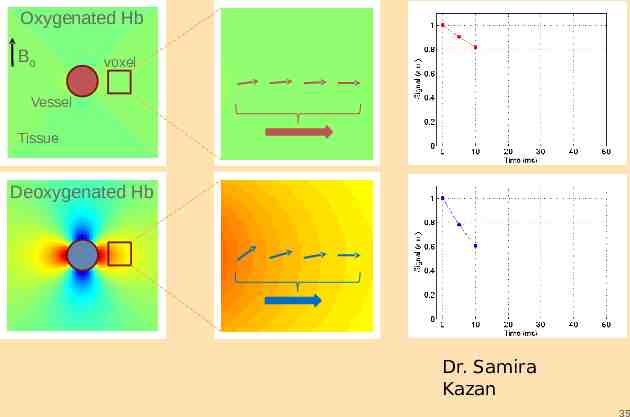
Oxygenated Hb B0 voxel Vessel Tissue Deoxygenated Hb 34 Dr. Samira Kazan 34
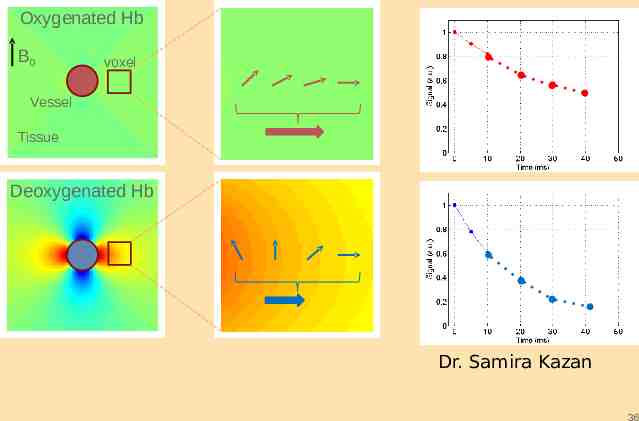
Oxygenated Hb B0 voxel Vessel Tissue Deoxygenated Hb 35 Dr. Samira Kazan 35
Oxygenated Hb B0 voxel Vessel Tissue Deoxygenated Hb 36 Dr. Samira Kazan 36
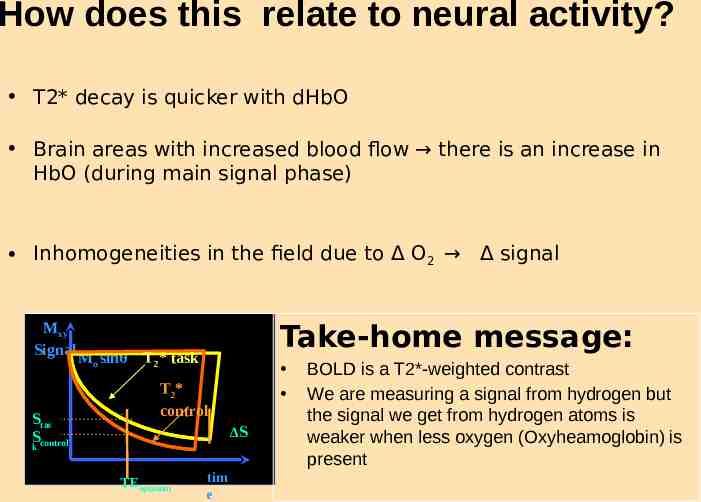
How does this relate to neural activity? T2* decay is quicker with dHbO Brain areas with increased blood flow there is an increase in HbO (during main signal phase) Inhomogeneities in the field due to Δ O2 Δ signal Mxy Signal Stas S k control Take-home message: Mo sinθ T2* task T2* control ΔS TEoptimum tim e BOLD is a T2*-weighted contrast We are measuring a signal from hydrogen but the signal we get from hydrogen atoms is weaker when less oxygen (Oxyheamoglobin) is present
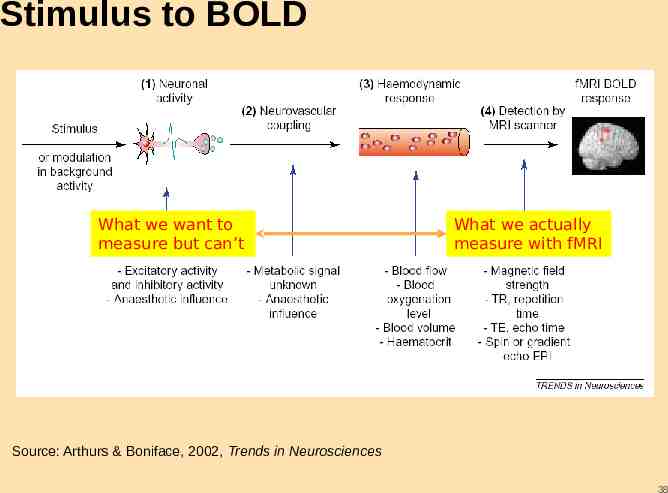
Stimulus to BOLD What we want to measure but can’t What we actually measure with fMRI Source: Arthurs & Boniface, 2002, Trends in Neurosciences 38
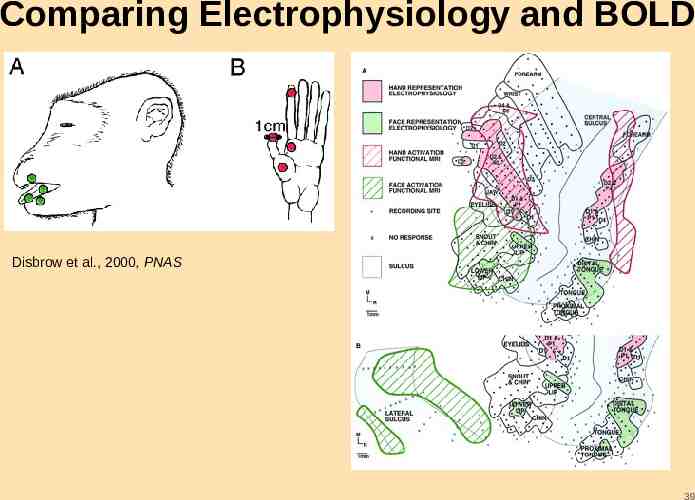
Comparing Electrophysiology and BOLD Disbrow et al., 2000, PNAS 39
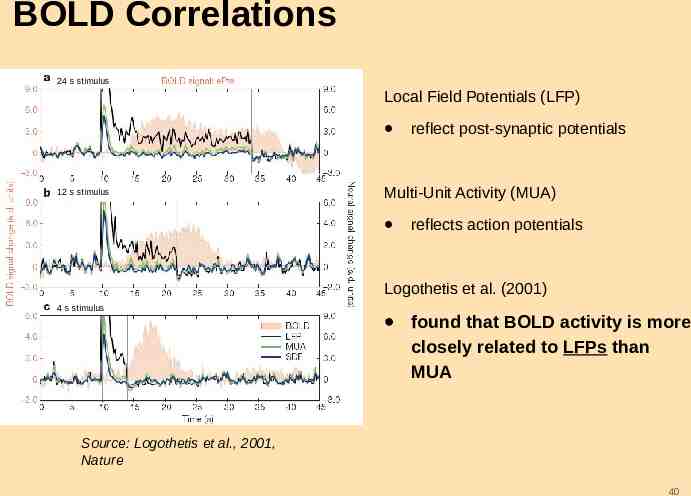
BOLD Correlations 24 s stimulus Local Field Potentials (LFP) 12 s stimulus reflect post-synaptic potentials Multi-Unit Activity (MUA) reflects action potentials Logothetis et al. (2001) 4 s stimulus found that BOLD activity is more closely related to LFPs than MUA Source: Logothetis et al., 2001, Nature 40
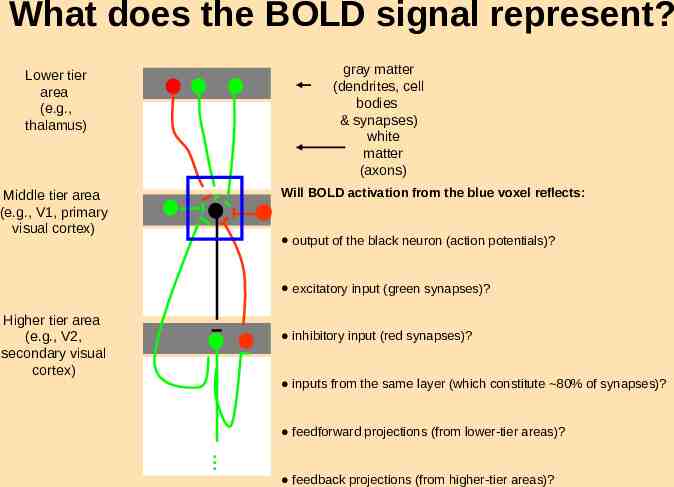
What does the BOLD signal represent? gray matter (dendrites, cell bodies & synapses) white matter (axons) Lower tier area (e.g., thalamus) Will BOLD activation from the blue voxel reflects: Middle tier area (e.g., V1, primary visual cortex) output of the black neuron (action potentials)? excitatory input (green synapses)? Higher tier area (e.g., V2, secondary visual cortex) inhibitory input (red synapses)? inputs from the same layer (which constitute 80% of synapses)? feedforward projections (from lower-tier areas)? feedback projections (from higher-tier areas)?
Advantages of BOLD High spatial resolution Non-invasive Increasing availability Enables visualising of entire brain areas/networks engaged in specific activities 42
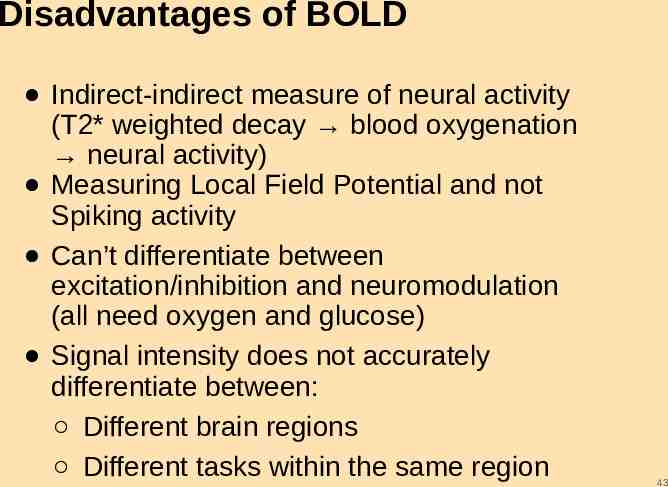
Disadvantages of BOLD Indirect-indirect measure of neural activity (T2* weighted decay blood oxygenation neural activity) Measuring Local Field Potential and not Spiking activity Can’t differentiate between excitation/inhibition and neuromodulation (all need oxygen and glucose) Signal intensity does not accurately differentiate between: Different brain regions Different tasks within the same region 43
Thanks! Any questions? 44
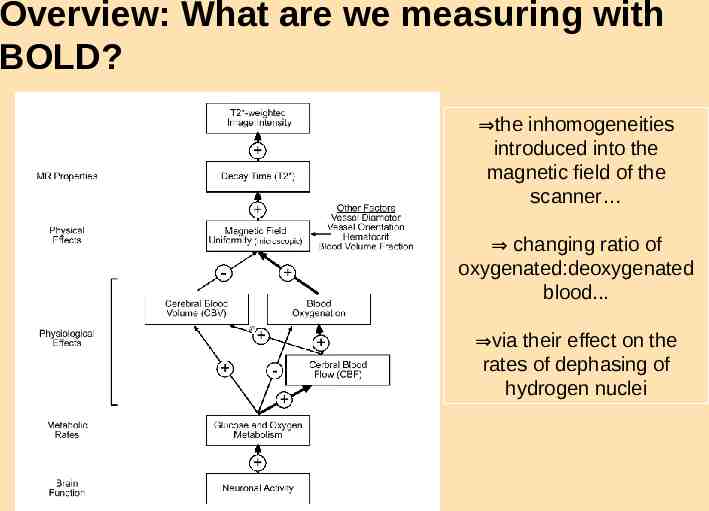
Overview: What are we measuring with BOLD? the inhomogeneities introduced into the magnetic field of the scanner changing ratio of oxygenated:deoxygenated blood. via their effect on the rates of dephasing of hydrogen nuclei
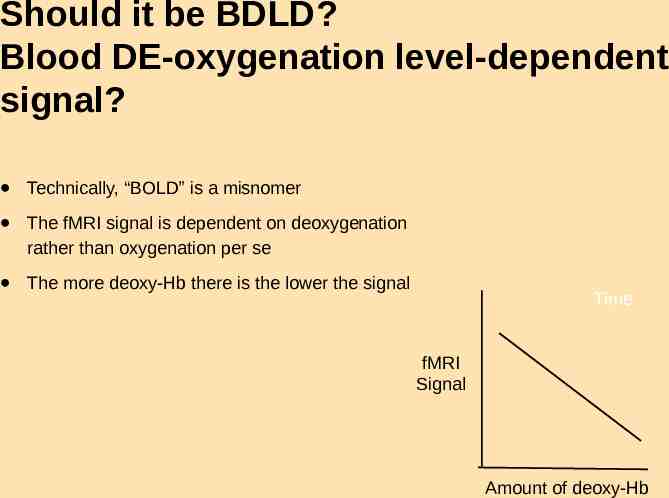
Should it be BDLD? Blood DE-oxygenation level-dependent signal? Technically, “BOLD” is a misnomer The fMRI signal is dependent on deoxygenation rather than oxygenation per se The more deoxy-Hb there is the lower the signal Time fMRI Signal Amount of deoxy-Hb