You Exec provides business resources that move your career

32 Slides7.28 MB
You Exec provides business resources that move your career forward. Access our full library of presentations, spreadsheet models, and business book summaries. We do the work, you take the credit. Errors & Omissions Liability (E&O): You Exec makes no guarantee that the statements, analysis, projections, estimates, graphs, reports, numbers, and any derivatives sourced from this presentation are free of errors and omissions. You Exec assumes no liability for erroneous outcomes derived from this Watch explainer presentation. Please do not resell this presentation. For a This video will walk you through the commercial or group license, please visit Unlimited benefits of this framework. Paid members, and schedule a demo. please log in for a better viewing experience.
DECISION-MAKING MODELS Presented by You Exec
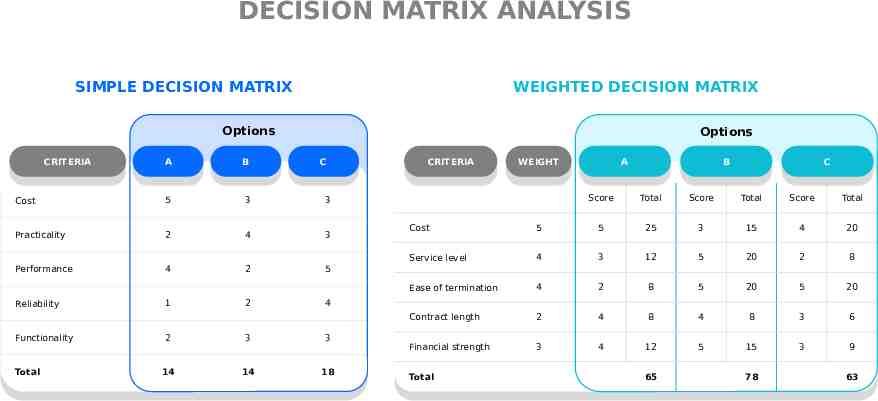
DECISION MATRIX ANALYSIS SIMPLE DECISION MATRIX WEIGHTED DECISION MATRIX Options CRITERIA CRITERIA Options A A B B Cost 5 3 3 Practicality 2 4 3 Performance 4 2 5 Reliability Functionality Total 1 2 C C CRITERIA CRITERIA WEIGHT WEIGHT A A B B C C Score Total Score Total Score Total Cost 5 5 25 3 15 4 20 Service level 4 3 12 5 20 2 8 Ease of termination 4 2 8 5 20 5 20 Contract length 2 4 8 4 8 3 6 Financial strength 3 4 12 5 15 3 9 4 2 3 3 14 14 18 Total 65 78 63
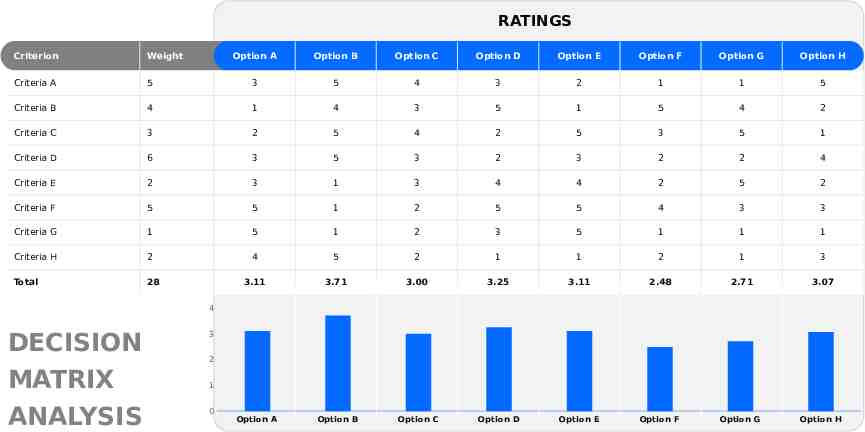
RATINGS Criterion Weight Option A Option B Option C Option D Option E Option F Option G Option H Criteria A 5 3 5 4 3 2 1 1 5 Criteria B 4 1 4 3 5 1 5 4 2 Criteria C 3 2 5 4 2 5 3 5 1 Criteria D 6 3 5 3 2 3 2 2 4 Criteria E 2 3 1 3 4 4 2 5 2 Criteria F 5 5 1 2 5 5 4 3 3 Criteria G 1 5 1 2 3 5 1 1 1 Criteria H 2 4 5 2 1 1 2 1 3 Total 28 3.11 3.71 3.00 3.25 3.11 2.48 2.71 3.07 Option B Option C Option D Option E Option F Option G Option H 4 DECISION MATRIX ANALYSIS 3 2 1 0 Option A
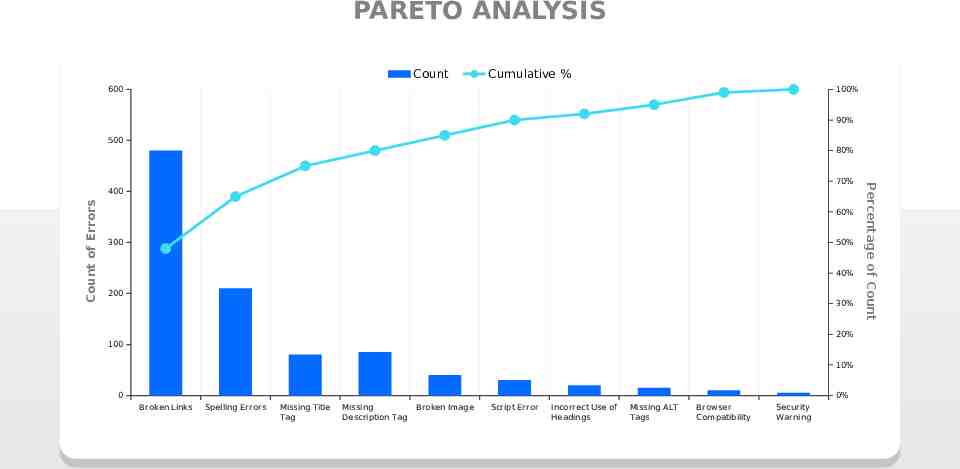
PARETO ANALYSIS Count Cumulative % 600 100% 90% 500 80% Count of Errors 60% 300 50% 40% 200 30% 20% 100 10% 0 0% Broken Links Spelling Errors Missing Title Tag Missing Description Tag Broken Image Script Error Incorrect Use of Headings Missing ALT Tags Browser Compatibility Security Warning Percentage of Count 70% 400
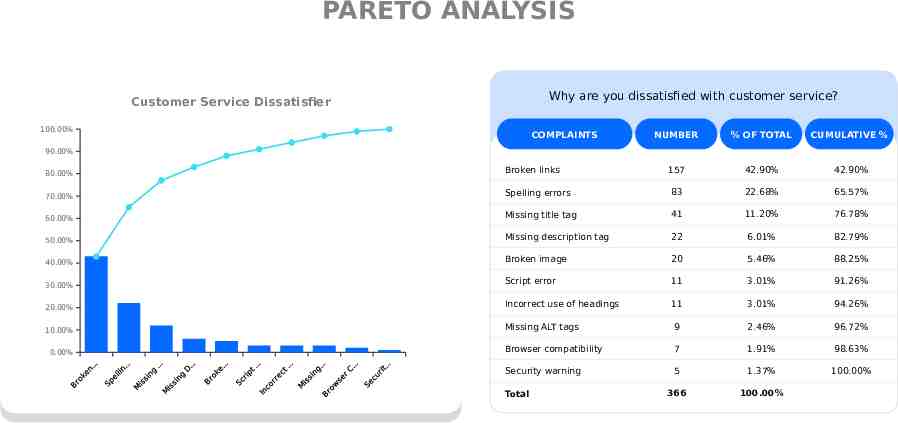
PARETO ANALYSIS Why are you dissatisfied with customer service? Customer Service Dissatisfier 100.00% COMPLAINTS NUMBER % OF TOTAL CUMULATIVE % 157 42.90% 42.90% 90.00% 80.00% Broken links 70.00% Spelling errors 83 22.68% 65.57% 60.00% Missing title tag 41 11.20% 76.78% 50.00% Missing description tag 22 6.01% 82.79% 40.00% Broken image 20 5.46% 88.25% 30.00% Script error 11 3.01% 91.26% 20.00% Incorrect use of headings 11 3.01% 94.26% 10.00% Missing ALT tags 9 2.46% 96.72% Browser compatibility 7 1.91% 98.63% Security warning 5 1.37% 100.00% 366 100.00% 0.00% Total
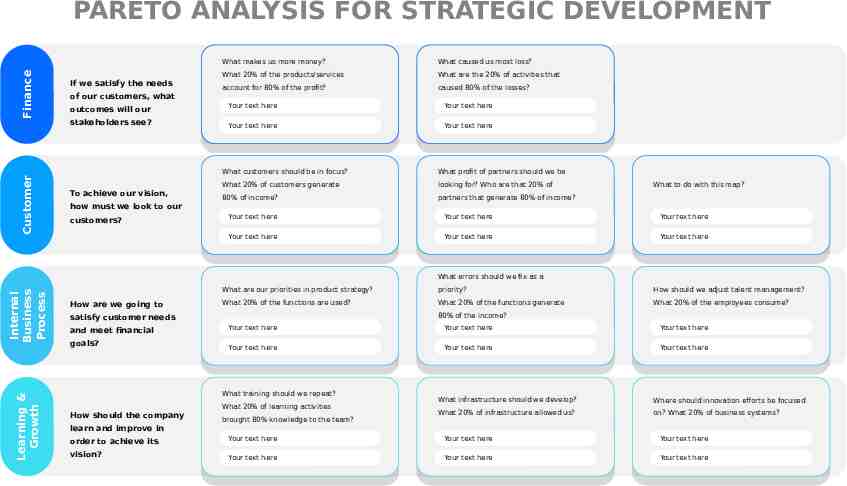
Customer Finance PARETO ANALYSIS FOR STRATEGIC DEVELOPMENT If we satisfy the needs of our customers, what outcomes will our stakeholders see? To achieve our vision, What makes us more money? What caused us most loss? What 20% of the products/services What are the 20% of activities that account for 80% of the profit? caused 80% of the losses? Your text here Your text here Your text here Your text here What customers should be in focus? What profit of partners should we be What 20% of customers generate looking for? Who are that 20% of 80% of income? partners that generate 80% of income? What to do with this map? how must we look to our customers? Your text here Your text here Your text here Your text here Your text here Your text here Learning & Growth Internal Business Process What errors should we fix as a How are we going to What are our priorities in product strategy? priority? How should we adjust talent management? What 20% of the functions are used? What 20% of the functions generate What 20% of the employees consume? 80% of the income? satisfy customer needs and meet financial goals? Your text here Your text here Your text here Your text here Your text here Your text here What training should we repeat? How should the company learn and improve in order to achieve its vision? What 20% of learning activities brought 80% knowledge to the team? What infrastructure should we develop? Where should innovation efforts be focused What 20% of infrastructure allowed us? on? What 20% of business systems? Your text here Your text here Your text here Your text here Your text here Your text here
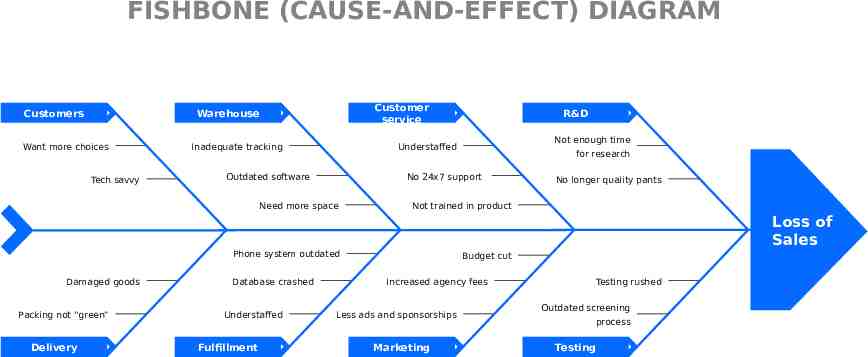
FISHBONE (CAUSE-AND-EFFECT) DIAGRAM Customers Customer service Warehouse Want more choices Tech savvy Inadequate tracking R&D Not enough time Understaffed Outdated software for research No 24x7 support Need more space No longer quality pants Not trained in product Loss of Sales Phone system outdated Damaged goods Packing not “green” Delivery Database crashed Understaffed Fulfillment Budget cut Increased agency fees Less ads and sponsorships Marketing Testing rushed Outdated screening process Testing
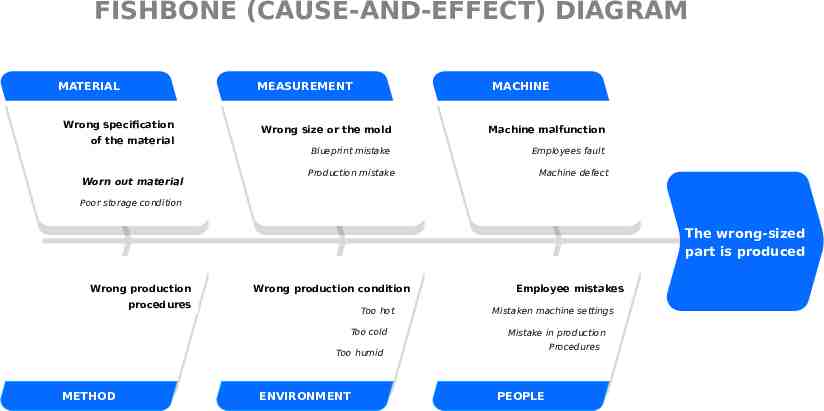
FISHBONE (CAUSE-AND-EFFECT) DIAGRAM MATERIAL MEASUREMENT Wrong specification of the material Worn out material MACHINE Wrong size or the mold Machine malfunction Blueprint mistake Employees fault Production mistake Machine defect Poor storage condition The wrong-sized part is produced Wrong production Wrong production condition procedures Too hot Too cold Employee mistakes Mistaken machine settings Mistake in production Procedures Too humid METHOD ENVIRONMENT PEOPLE
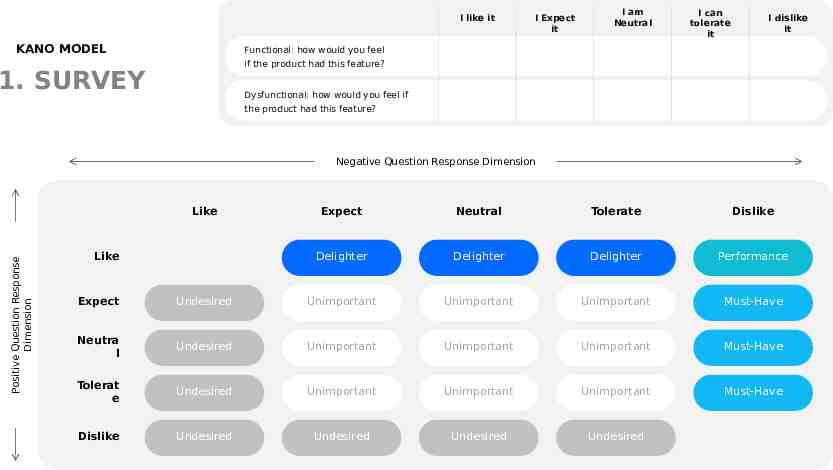
I like it KANO MODEL I Expect it I am Neutral I can tolerate it I dislike it Functional: how would you feel if the product had this feature? 1. SURVEY Dysfunctional: how would you feel if the product had this feature? Negative Question Response Dimension Positive Question Response Dimension Like Like Expect Neutral Tolerate Dislike Delighter Delighter Delighter Performance Expect Undesired Unimportant Unimportant Unimportant Must-Have Neutra l Undesired Unimportant Unimportant Unimportant Must-Have Tolerat e Undesired Unimportant Unimportant Unimportant Must-Have Dislike Undesired Undesired Undesired Undesired
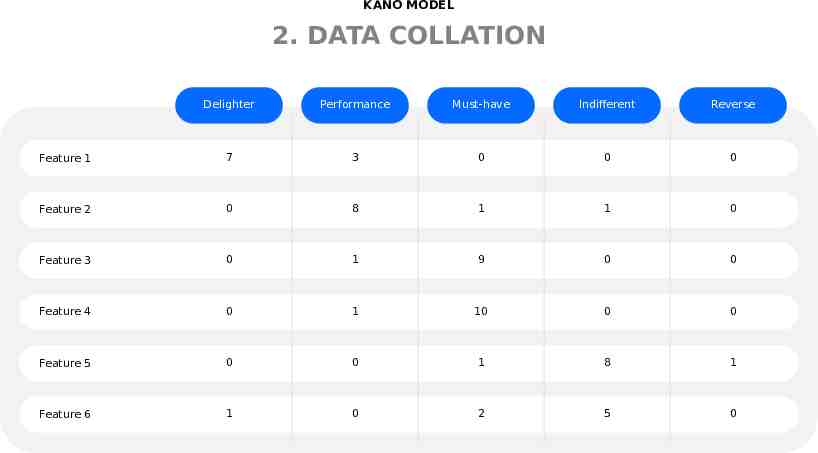
KANO MODEL 2. DATA COLLATION Delighter Performance Must-have Indifferent Reverse Feature 1 7 3 0 0 0 Feature 2 0 8 1 1 0 Feature 3 0 1 9 0 0 Feature 4 0 1 10 0 0 Feature 5 0 0 1 8 1 Feature 6 1 0 2 5 0
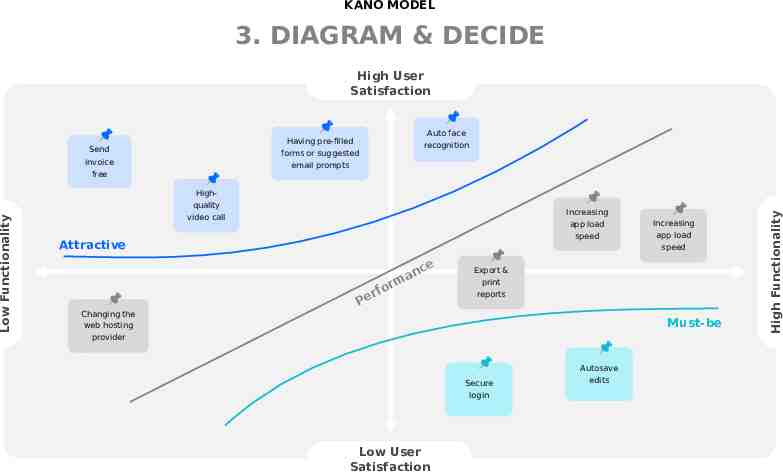
KANO MODEL 3. DIAGRAM & DECIDE High User Satisfaction Auto face Send forms or suggested email prompts invoice free recognition Low Functionality Highquality Increasing app load speed video call Attractive rfo Pe e nc a rm Increasing app load speed Export & print reports Changing the web hosting Must-be provider Secure login Low User Satisfaction Autosave edits High Functionality Having pre-filled
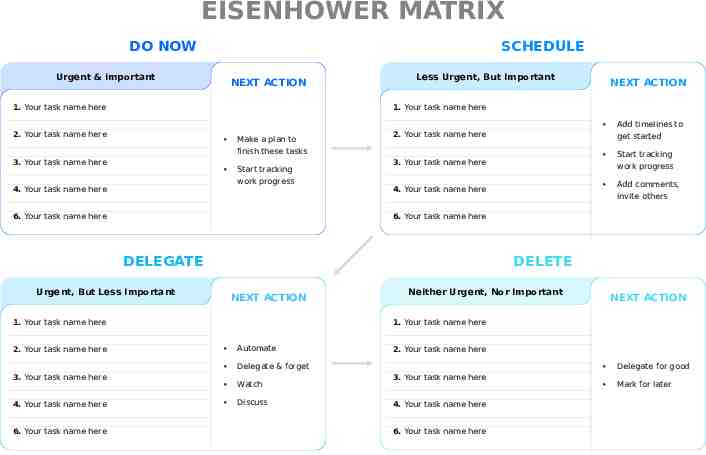
EISENHOWER MATRIX DO NOW SCHEDULE Urgent & important NEXT ACTION Less Urgent, But Important 1. Your task name here 1. Your task name here 2. Your task name here 2. Your task name here NEXT ACTION Make a plan to get started finish these tasks 3. Your task name here 4. Your task name here Start tracking work progress 6. Your task name here 3. Your task name here 4. Your task name here NEXT ACTION 1. Your task name here 4. Your task name here 6. Your task name here Start tracking work progress Add comments, invite others DELETE Urgent, But Less Important 3. Your task name here 6. Your task name here DELEGATE 2. Your task name here Add timelines to Neither Urgent, Nor Important NEXT ACTION 1. Your task name here Automate Delegate & forget Watch Discuss 2. Your task name here 3. Your task name here 4. Your task name here 6. Your task name here Delegate for good Mark for later
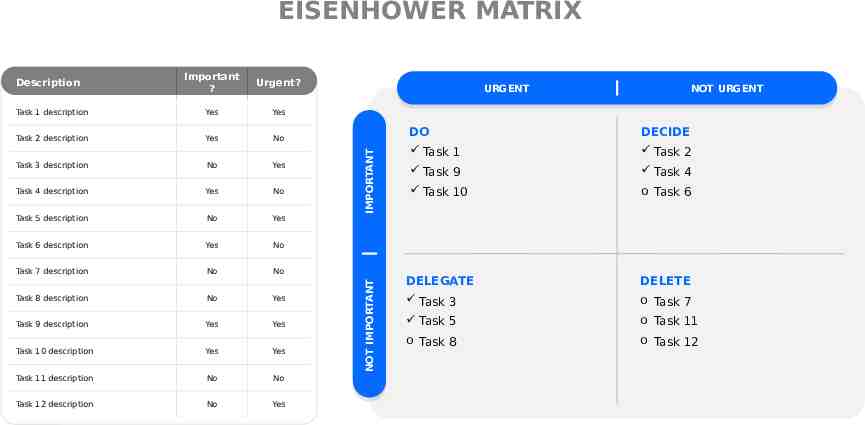
EISENHOWER MATRIX Task 1 description Yes Yes Task 2 description Yes No Task 3 description No Yes Task 4 description Yes No Task 5 description No Yes Task 6 description Yes No Task 7 description No No Task 8 description No Yes Task 9 description Yes Yes Task 10 description Yes Yes Task 11 description No No Task 12 description No Yes URGENT IMPORTANT Urgent? NOT IMPORTANT Important ? Description NOT URGENT DO DECIDE Task 1 Task 2 Task 9 Task 4 Task 10 o Task 6 DELEGATE DELETE Task 3 o Task 7 Task 5 o Task 11 o Task 8 o Task 12
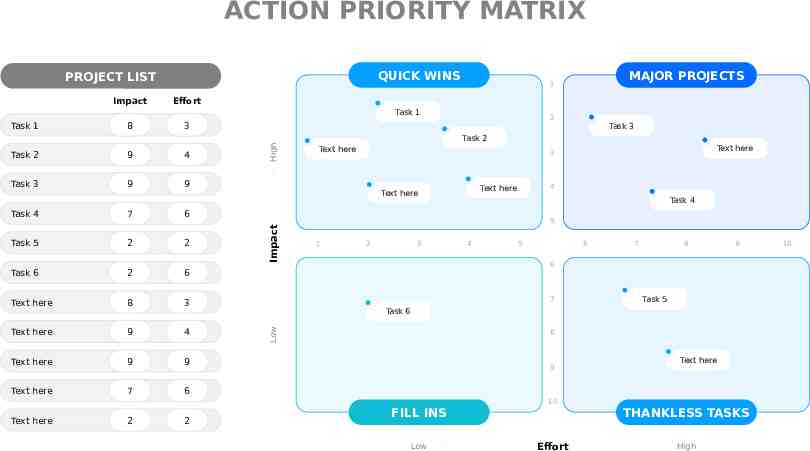
ACTION PRIORITY MATRIX QUICK WINS PROJECT LIST Impact Effort Task 1 Task 1 8 MAJOR PROJECTS 1 2 3 Task 3 4 Task 3 9 9 Task 4 7 6 Task 5 2 2 Task 6 2 6 Text here 8 3 Text here 9 4 Text here 9 9 Text here 7 6 Text here Text here 3 4 Text here Text here Impact 9 Task 4 5 1 2 3 4 5 6 7 8 9 6 7 Task 5 Task 6 Low Task 2 High Task 2 8 9 Text here 10 Text here 2 2 FILL INS Low THANKLESS TASKS Effort High 10
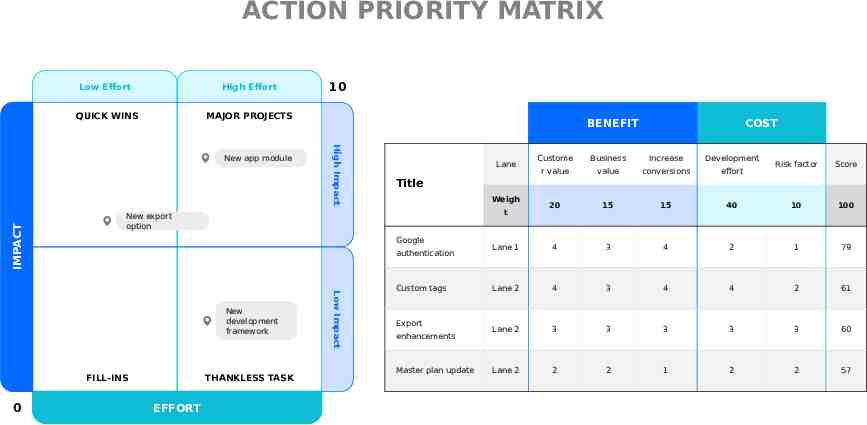
ACTION PRIORITY MATRIX Low Effort High Effort QUICK WINS MAJOR PROJECTS IMPACT Increase Development r value value conversions effort 20 15 15 Lane 1 4 3 Lane 2 4 Lane 2 Lane 2 Weigh t authentication Low Impact THANKLESS TASK EFFORT Business Risk factor Score 40 10 100 4 2 1 79 3 4 4 2 61 3 3 3 3 3 60 2 2 1 2 2 57 Title Google FILL-INS COST Custome Lane New export option New development framework 0 BENEFIT High Impact New app module 10 Custom tags Export enhancements Master plan update
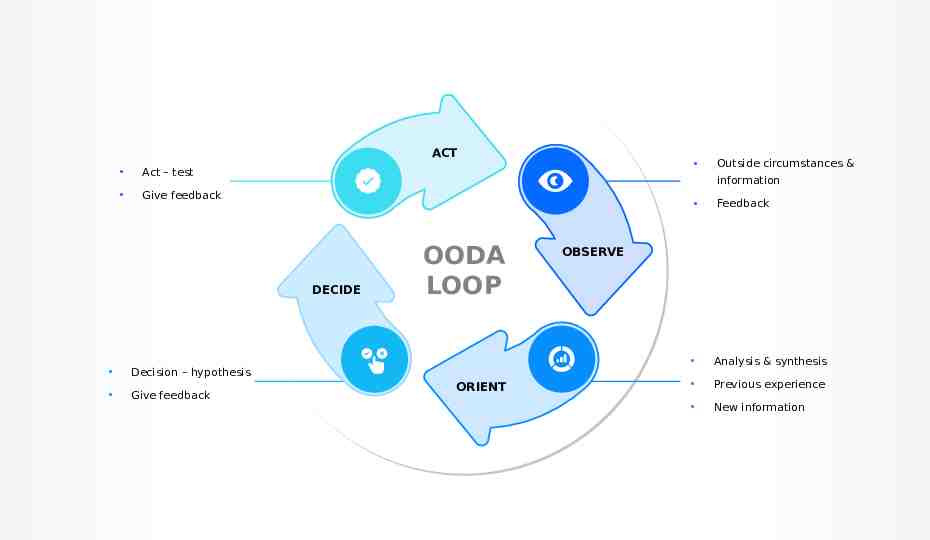
ACT Act – test Give feedback Decision – hypothesis Give feedback Outside circumstances & information DECIDE OODA LOOP ORIENT Feedback Analysis & synthesis Previous experience New information OBSERVE
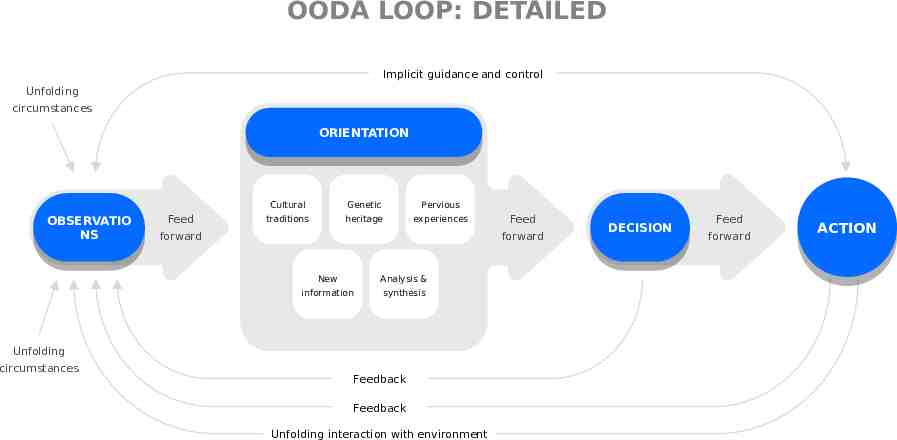
OODA LOOP: DETAILED Implicit guidance and control Unfolding circumstances ORIENTATION ORIENTATION OBSERVATIO OBSERVATIO NS NS Feed Cultural Genetic Pervious traditions heritage experiences forward forward New Analysis & information synthesis Unfolding circumstances Feed Feedback Feedback Unfolding interaction with environment DECISION DECISION Feed forward ACTION ACTION
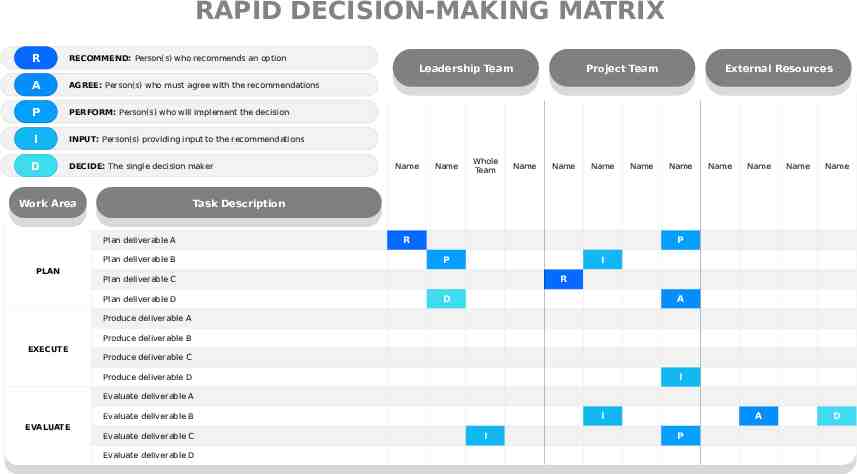
RAPID DECISION-MAKING MATRIX R RECOMMEND: Person(s) who recommends an option A AGREE: Person(s) who must agree with the recommendations P PERFORM: Person(s) who will implement the decision I INPUT: Person(s) providing input to the recommendations D DECIDE: The single decision maker Work Area Work Area Name Name Whole Team Name Project Team Project Team Name Name Name External Resources External Resources Name Name Name Name Name Task Description Task Description Plan deliverable A Plan deliverable B PLAN Leadership Team Leadership Team R P P I R Plan deliverable C Plan deliverable D D A Produce deliverable A Produce deliverable B EXECUTE Produce deliverable C I Produce deliverable D Evaluate deliverable A I Evaluate deliverable B EVALUATE Evaluate deliverable C Evaluate deliverable D I A P D
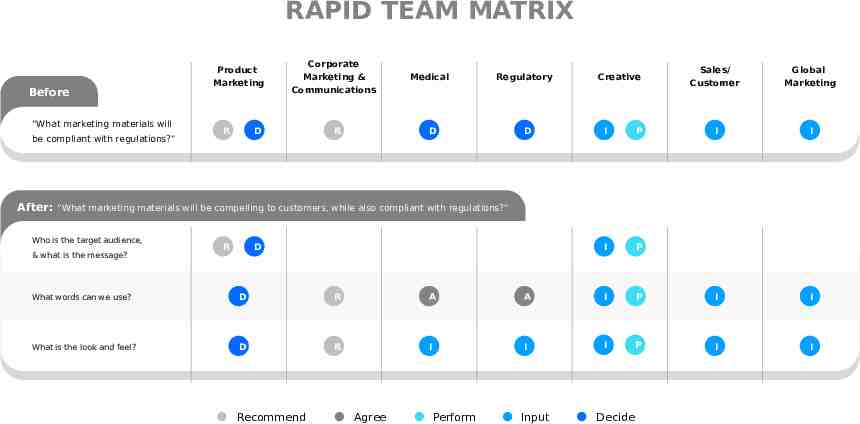
RAPID TEAM MATRIX Before “What marketing materials will be compliant with regulations?” Product Marketing R Corporate Marketing & Communications D R Medical Regulatory D D Creative I P I P Sales/ Customer Global Marketing I I After: “What marketing materials will be compelling to customers, while also compliant with regulations?” Who is the target audience, & what is the message? R D What words can we use? D R A A I P I I What is the look and feel? D R I I I P I I Recommend Agree Perform Input Decide
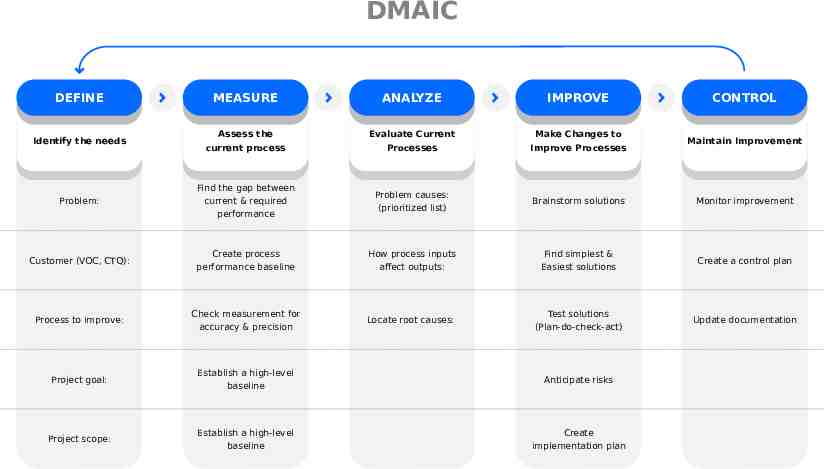
DMAIC DEFINE DEFINE MEASURE MEASURE ANALYZE ANALYZE IMPROVE IMPROVE Assess the Evaluate Current Make Changes to current process Processes Improve Processes Problem: Find the gap between current & required performance Problem causes: (prioritized list) Brainstorm solutions Monitor improvement Customer (VOC, CTQ): Create process performance baseline How process inputs affect outputs: Find simplest & Easiest solutions Create a control plan Process to improve: Check measurement for accuracy & precision Locate root causes: Test solutions (Plan-do-check-act) Update documentation Project goal: Establish a high-level baseline Anticipate risks Project scope: Establish a high-level baseline Create implementation plan Identify the needs CONTROL CONTROL Maintain Improvement
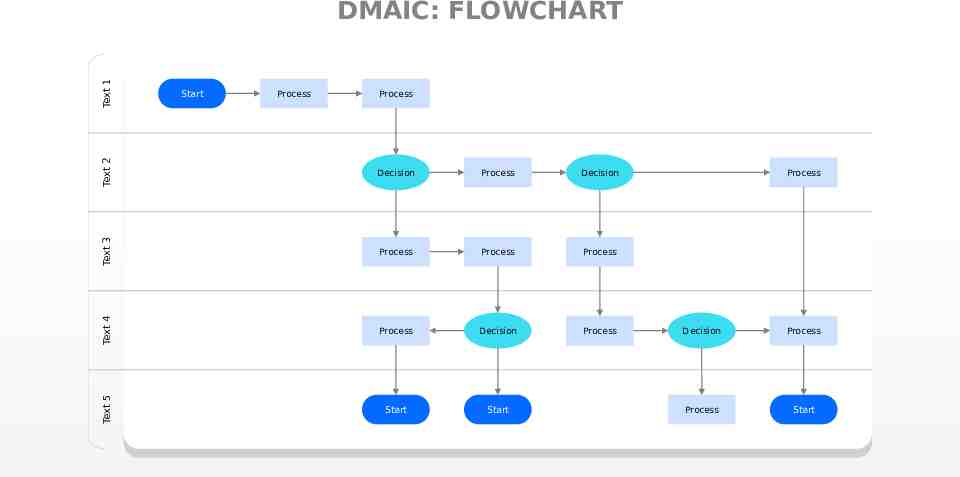
Text 2 Process Decision Process Decision Text 3 Process Process Process Process Text 4 Start Process Decision Process Text 5 Text 1 DMAIC: FLOWCHART Start Start Process Decision Process Process Start
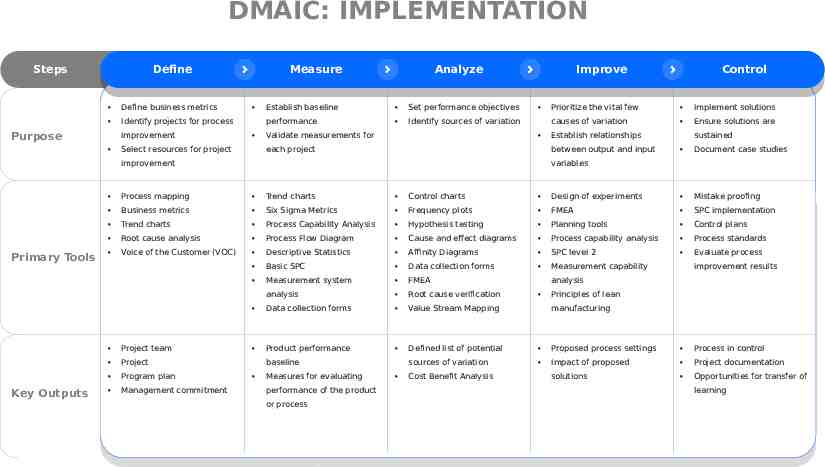
DMAIC: IMPLEMENTATION Steps Define Define business metrics Identify projects for process Purpose improvement Measure Select resources for project Analyze Establish baseline Set performance objectives performance Identify sources of variation Validate measurements for Improve each project Primary Tools Key Outputs Prioritize the vital few Implement solutions causes of variation Ensure solutions are Establish relationships between output and input improvement Control sustained Document case studies variables Process mapping Trend charts Control charts Design of experiments Mistake proofing Business metrics Six Sigma Metrics Frequency plots FMEA SPC implementation Trend charts Process Capability Analysis Hypothesis testing Planning tools Control plans Root cause analysis Process Flow Diagram Cause and effect diagrams Process capability analysis Process standards Voice of the Customer (VOC) Descriptive Statistics Affinity Diagrams SPC level 2 Evaluate process Basic SPC Data collection forms Measurement capability Measurement system FMEA Project team Project Program plan Management commitment improvement results analysis analysis Root cause verification Data collection forms Value Stream Mapping Product performance Defined list of potential Proposed process settings Process in control sources of variation Impact of proposed Project documentation solutions Opportunities for transfer of baseline Measures for evaluating performance of the product or process Cost Benefit Analysis Principles of lean manufacturing learning
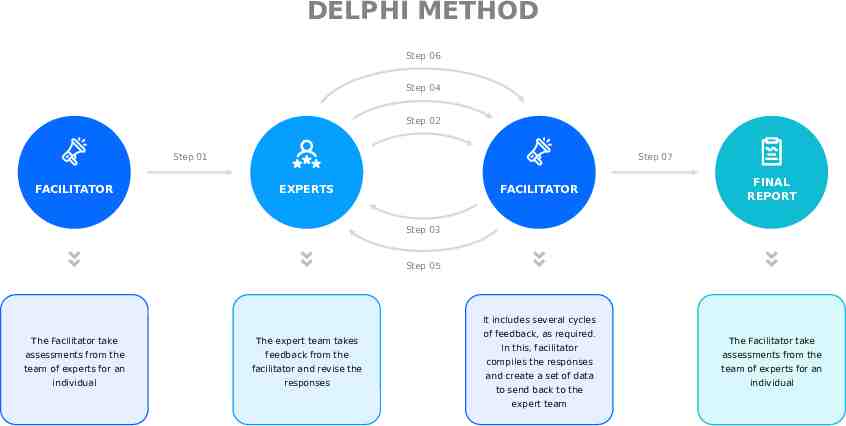
DELPHI METHOD Step 06 Step 04 Step 02 Step 01 FACILITATOR Step 07 EXPERTS FACILITATOR FINAL REPORT Step 03 Step 05 It includes several cycles The Facilitator take The expert team takes assessments from the feedback from the team of experts for an facilitator and revise the individual responses of feedback, as required. In this, facilitator compiles the responses and create a set of data to send back to the expert team The Facilitator take assessments from the team of experts for an individual
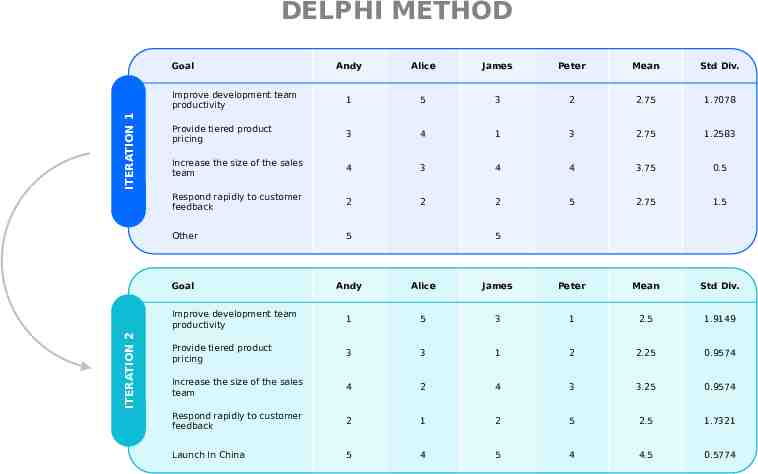
DELPHI METHOD ITERATION 2 ITERATION 1 Goal Andy Alice James Peter Mean Std Div. Improve development team productivity 1 5 3 2 2.75 1.7078 Provide tiered product pricing 3 4 1 3 2.75 1.2583 Increase the size of the sales team 4 3 4 4 3.75 0.5 Respond rapidly to customer feedback 2 2 2 5 2.75 1.5 Other 5 Goal Andy Alice James Peter Mean Std Div. Improve development team productivity 1 5 3 1 2.5 1.9149 Provide tiered product pricing 3 3 1 2 2.25 0.9574 Increase the size of the sales team 4 2 4 3 3.25 0.9574 Respond rapidly to customer feedback 2 1 2 5 2.5 1.7321 Launch In China 5 4 5 4 4.5 0.5774 5
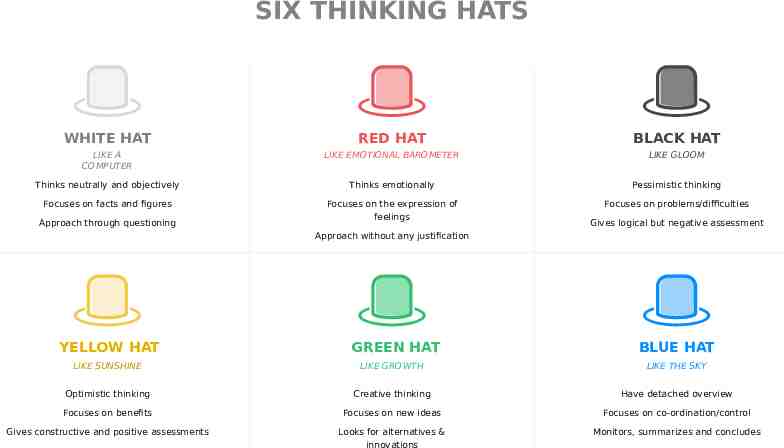
SIX THINKING HATS WHITE HAT RED HAT BLACK HAT LIKE A COMPUTER LIKE EMOTIONAL BAROMETER LIKE GLOOM Thinks neutrally and objectively Thinks emotionally Pessimistic thinking Focuses on facts and figures Focuses on the expression of feelings Focuses on problems/difficulties Approach through questioning Gives logical but negative assessment Approach without any justification YELLOW HAT GREEN HAT BLUE HAT LIKE SUNSHINE LIKE GROWTH LIKE THE SKY Optimistic thinking Creative thinking Have detached overview Focuses on benefits Focuses on new ideas Focuses on co-ordination/control Gives constructive and positive assessments Looks for alternatives & innovations Monitors, summarizes and concludes
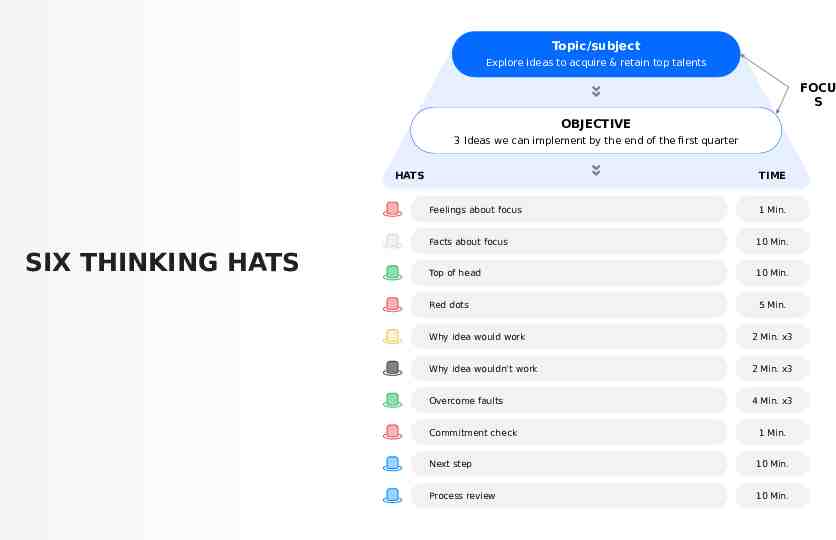
Topic/subject Explore ideas to acquire & retain top talents FOCU S OBJECTIVE 3 Ideas we can implement by the end of the first quarter HATS TIME Feelings about focus SIX THINKING HATS 1 Min. Facts about focus 10 Min. Top of head 10 Min. Red dots 5 Min. Why idea would work 2 Min. x3 Why idea wouldn’t work 2 Min. x3 Overcome faults 4 Min. x3 Commitment check 1 Min. Next step 10 Min. Process review 10 Min.
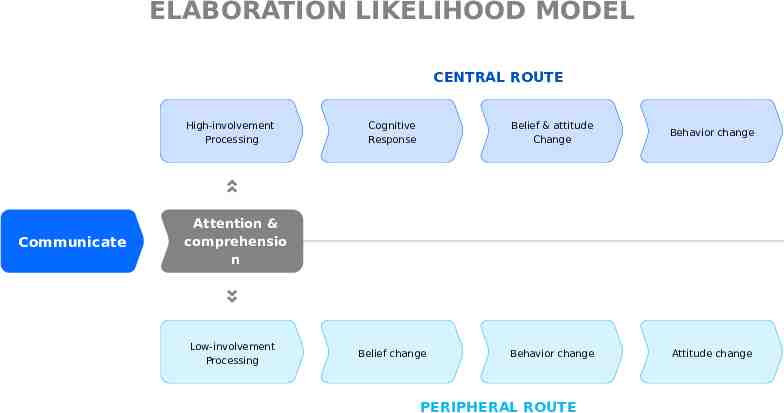
ELABORATION LIKELIHOOD MODEL CENTRAL ROUTE High-involvement Processing Communicate Cognitive Response Belief & attitude Change Behavior change Belief change Behavior change Attitude change Attention & comprehensio n Low-involvement Processing PERIPHERAL ROUTE
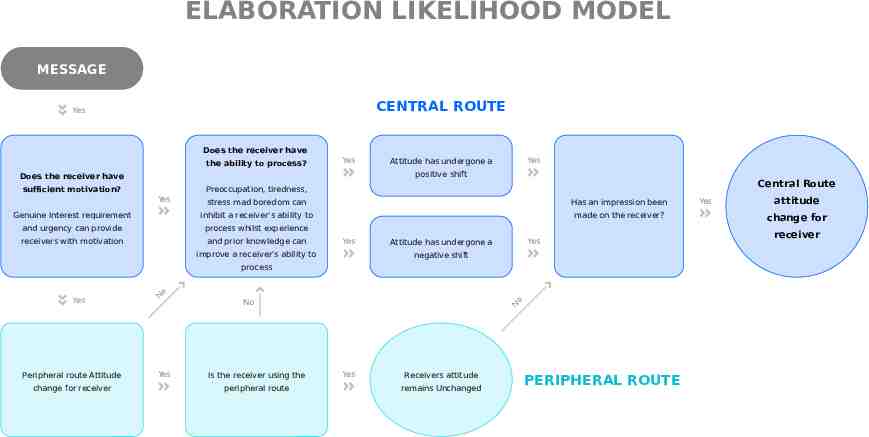
ELABORATION LIKELIHOOD MODEL MESSAGE CENTRAL ROUTE Yes Does the receiver have the ability to process? Yes Yes Attitude has undergone a positive shift Does the receiver have sufficient motivation? Central Route Preoccupation, tiredness, Yes stress mad boredom can Has an impression been Genuine Interest requirement inhibit a receiver’s ability to made on the receiver? and urgency can provide process whilst experience receivers with motivation and prior knowledge can Yes improve a receiver’s ability to Yes Attitude has undergone a negative shift Peripheral route Attitude change for receiver Yes No Is the receiver using the peripheral route N o Yes N o process Yes Receivers attitude remains Unchanged PERIPHERAL ROUTE Yes attitude change for receiver
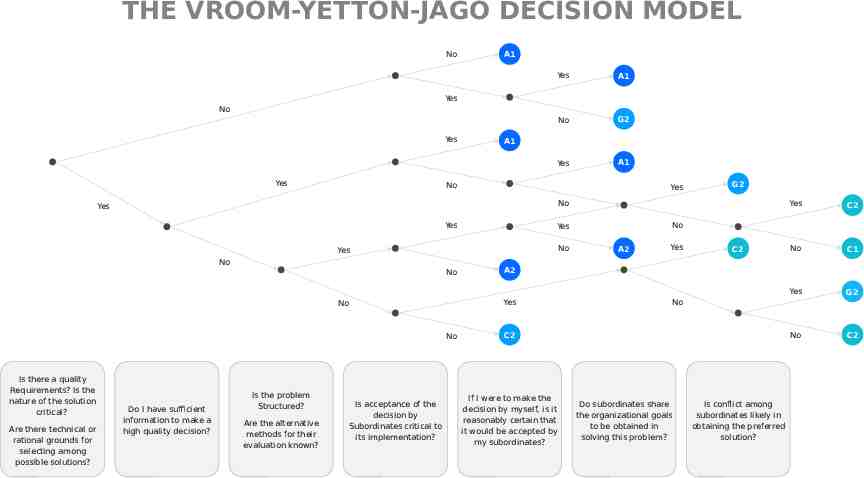
THE VROOM-YETTON-JAGO DECISION MODEL No A1 Yes A1 No G2 Yes A1 Yes No Yes Yes A1 No Yes No Yes Yes No No No No Are there technical or rational grounds for selecting among possible solutions? Do I have sufficient information to make a high quality decision? Is the problem Structured? Are the alternative methods for their evaluation known? Is acceptance of the decision by Subordinates critical to its implementation? C2 A2 Yes C2 No C1 Yes G2 No C2 A2 Yes No Yes No Yes Yes Is there a quality Requirements? Is the nature of the solution critical? G2 No C2 If I were to make the decision by myself, is it reasonably certain that it would be accepted by my subordinates? Do subordinates share the organizational goals to be obtained in solving this problem? Is conflict among subordinates likely in obtaining the preferred solution?
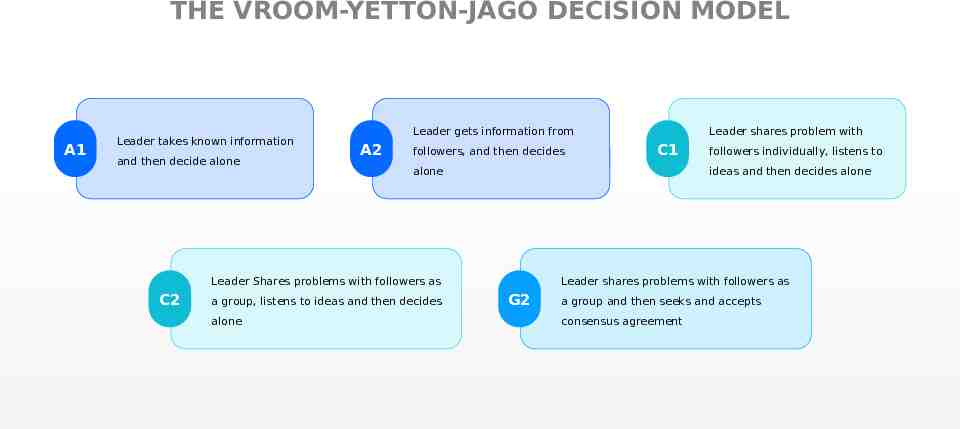
THE VROOM-YETTON-JAGO DECISION MODEL A1 Leader takes known information and then decide alone Leader gets information from A2 followers, and then decides a group, listens to ideas and then decides alone C1 alone followers individually, listens to ideas and then decides alone Leader Shares problems with followers as C2 Leader shares problem with Leader shares problems with followers as G2 a group and then seeks and accepts consensus agreement
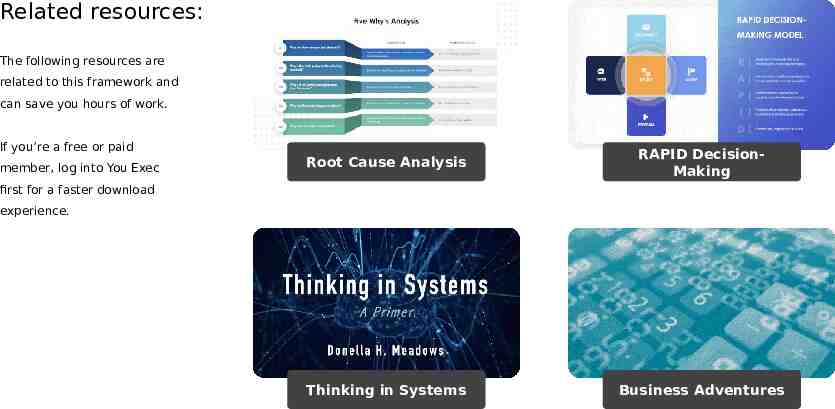
Related resources: The following resources are related to this framework and can save you hours of work. If you’re a free or paid member, log into You Exec Root Cause Analysis RAPID DecisionMaking Thinking in Systems Business Adventures first for a faster download experience.