Workshop on the Post Adjustment System Montreal, 26 June


92 Slides5.69 MB
Workshop on the Post Adjustment System Montreal, 26 June 2009 Montreal, 26 June 2009 Workshop on the Post Adjustment System 1
Outline Introduction Operation of the Post Adjustment System Components of the Post Adjustment Index Updating Post Adjustment Classifications (PACs) over time – Group I Factors influencing evolution of Net Take-home Pay Issue #1: Salaries not keeping up with local inflation Issue #2: Comparison of NTPs based on PAI and other indices Latest developments for the 2010 round Proposed modifications to the Operational Rules Montreal, 26 June 2009 Workshop on the Post Adjustment System 2
UN Salary structure Net salary Staff assessment Gross base salary Post adjustment Net base salary Montreal, 26 June 2009 Workshop on the Post Adjustment System 3
Post Adjustment Circular (as of 1 June 2009) Duty Station Exchange Rate Index Geneva 1.089 179.6 London 0.628 Madrid Multiplier Thresholds dependant single 78.0 21 23 Apr. 2006 161.8 66.3 27 30 Apr. 2006 0.717 157.2 62.5 19 21 Nov. 2008 Montreal 1.114 149.1 49.1 17 19 Jul. 2001 New York 1.000 168.8 68.5 29 32 Aug. 2008 Rome 0.717 164.4 67.7 20 22 Jul. 2001 Paris 0.717 165.8 66.4 21 23 Jan. 2004 Vienna 0.717 164.2 65.0 19 21 Apr. 2006 Washington 1.000 145.6 45.6 25 28 Apr. 2006 Montreal, 26 June 2009 Workshop on the Post Adjustment System As of 4
Operation of the PA System Commission National/International Statistical Agencies Montreal, 26 June 2009 ACPAQ Staff at large Secretariat Workshop on the Post Adjustment System Local Post Adjustment Committee 5
Operation of the PA System (at base of the system - New York) New York Post Adjustment moves along with disaggregated CPIs plus special indices movements if margin is within 110 and 120. Increases in New York could be triggered if a full 5% increase in cost of living has accumulated since the preceding review or after 12 months, whichever comes first. Montreal, 26 June 2009 Workshop on the Post Adjustment System 6
Operation of the PA System (duty stations other than New York) Goal - Equalization of purchasing power of UN remuneration at duty stations relative to that in New York Method - Periodic cost-of-living surveys (compare prices/cost of a given volume of goods and services) Result – Post Adjustment Index (PAI) indicates how much to pay staff at a duty station in order to maintain Purchasing Power Parity (PPP) with New York. Montreal, 26 June 2009 Workshop on the Post Adjustment System 7
Operation of the PA System (duty stations other than New York) Question – How is PPP with New York maintained over time? PAI calculated on the basis of Cost-of-Living Survey guarantees that PPP is exactly correct PAI adjusted at least once every month to reflect: Exchange-rate fluctuations Movements in all PAI components PPP approximately maintained Revised PAI determines PAC Montreal, 26 June 2009 Workshop on the Post Adjustment System 8
Components of the PA Index Major Components (System-wide): 33% Out-of-Area 31% In-Area (excluding Housing) 22% Housing 10% Pension Contribution 4% Medical Insurance Montreal, 26 June 2009 Workshop on the Post Adjustment System 9
Out-of-Area Index Average of US dollar-based inflation in 21 selected countries Eurozone Euro-like US Dollar US Dollar-like Mixed behaviour Montreal, 26 June 2009 USA Italy France Belgium Netherlands Luxembourg Denmark Sweden Norway Finland UK Ireland Germany Austria Switzerland Japan Hong Kong Singapore Portugal Spain Greece Workshop on the Post Adjustment System Weight of: Eurozone Euro-like 68.2% US Dollar US Dollar-like 13.6% Mixed behaviour 18.2% 10
OA Index Montreal, 26 June 2009 Workshop on the Post Adjustment System 11
Inflation experienced by international staff In-area excluding Housing (local) inflation Inflation experienced by international staff Housing inflation Medical insurance “inflation” Montreal, 26 June 2009 Out-of-area “inflation” Pension contribution “inflation” Workshop on the Post Adjustment System 12
Updating of PACs GENERAL PRINCIPLES: – Maintain approximate PPP with New York by adjusting PACs – Adjustment according to specific economic circumstances: Inflation experienced by international staff (not just local inflation) Exchange-rate fluctuations Montreal, 26 June 2009 Workshop on the Post Adjustment System 13
Updating of PACs 0.5% rule Multipliers for Group I duty stations are adjusted on a monthly basis for exchange rate movement. Net Take-home Pay (NTP) in local currency is maintained within a range of /- 0.5% of established pay level. Aim: To stabilize NTP in local currency Montreal, 26 June 2009 Workshop on the Post Adjustment System 14
Updating of PACs (5%, 12-month rule, Group I) Review for inflation, or PAC review, is made after: A full 5% movement in the cost of living OR 12 months have elapsed from the reference date whichever comes first! The PAC review date becomes the new reference date for future PAC reviews. Montreal, 26 June 2009 Workshop on the Post Adjustment System 15
Updating of PACs (0.5% rule - Vienna) Implementation Date 5% rule Pension contribution 62.13 US Consolidation 2.33% 12-month rule Montreal, 26 June 2009 Exch. Rate Salary (local) Multiplier NTP (local) 2008 Apr 0.634 7,031.49 77.3 6,431.25 May 0.642 7,121.18 77.3 6,512.40 Jun 0.643 7,122.13 77.0 6,510.47 Jul 0.636 7,115.49 78.8 6,511.22 Aug 0.672 7,151.49 70.1 6,472.27 Sept 0.718 7,197.97 60.2 6,470.61 Oct 0.742 7,222.22 55.6 6,473.36 Nov 0.773 7,253.54 50.0 6,472.99 Dec 0.772 7,252.53 50.2 6,474.28 2009 Jan 0.756 7,235.57 49.5 6,471.72 Feb 0.762 7,242.41 48.5 6,474.30 Mar 0.782 7,262.62 45.1 6,474.01 Apr 0.759 7,239.38 49.0 6,473.11 May 0.735 7,589.83 61.3 6,847.19 Jun 0.717 7,571.64 65.0 6,849.34 Workshop on the Post Adjustment System 16
Updating of PACs Montreal, 26 June 2009 Workshop on the Post Adjustment System 17
Updating of PACs Montreal, 26 June 2009 Workshop on the Post Adjustment System 18
Updating of PACs Montreal, 26 June 2009 Workshop on the Post Adjustment System 19
Updating of PACs Montreal, 26 June 2009 Workshop on the Post Adjustment System 20
Updating of PACs Montreal, 26 June 2009 Workshop on the Post Adjustment System 21
Updating of PACs Montreal, 26 June 2009 Workshop on the Post Adjustment System 22
Updating of PACs Montreal, 26 June 2009 Workshop on the Post Adjustment System 23
Updating of PACs Montreal, 26 June 2009 Workshop on the Post Adjustment System 24
Updating of PACs Montreal, 26 June 2009 Workshop on the Post Adjustment System 25
Updating of PACs Latest PAC Reviews for Headquarters duty stations PAC Duty station Date Reason Vienna (EUR) May-09 Montreal (CAD) NTP (local currency) 0.5% updating Regular updating Implemented New Prior month Increase (%) TMR 153.3 161.3 161.3 6,847 6,473 5.78 Jun-09 TMR 143.8 149.1 149.1 9,508 9,130 4.14 Paris (EUR) May-09 TMR 156.8 162.7 162.7 6,913 6,638 4.14 Rome (EUR) Apr-09 TMR 149.5 159.3 159.3 6,974 6,499 7.30 Madrid (EUR) Mar-09 TMR 139.8 150.3 150.3 6,734 6,211 8.43 Geneva (CHF) Jul-08 FPR 190.5 192.0 192.0 11,373 11,274 0.88 London (GBP) Mar-09 TMR 134.0 151.6 151.6 6,052 5,268 14.88 New York (USD) Aug-08 FPR 172.4 172.4 9,775 9,174 6.55 Note: TMR – Twelve-month review FPR – Five-percent rule Montreal, 26 June 2009 Workshop on the Post Adjustment System 26
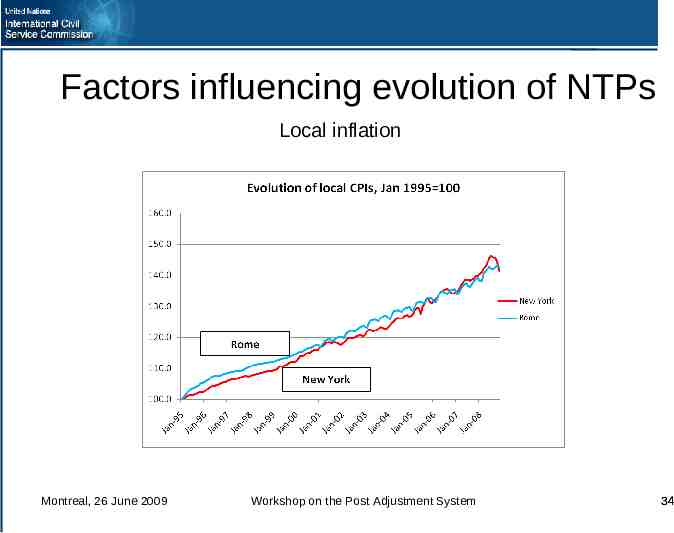
Factors influencing evolution of NTPs Local inflation – Affects only the In-area excluding housing component – Measured by local CPIs – Charts show local CPIs Montreal, 26 June 2009 Workshop on the Post Adjustment System 27
Factors influencing evolution of NTPs Local inflation Montreal, 26 June 2009 Workshop on the Post Adjustment System 28
Factors influencing evolution of NTPs Local inflation Montreal, 26 June 2009 Workshop on the Post Adjustment System 29
Factors influencing evolution of NTPs Local inflation Montreal, 26 June 2009 Workshop on the Post Adjustment System 30
Factors influencing evolution of NTPs Local inflation Montreal, 26 June 2009 Workshop on the Post Adjustment System 31
Factors influencing evolution of NTPs Local inflation Montreal, 26 June 2009 Workshop on the Post Adjustment System 32
Factors influencing evolution of NTPs Local inflation Montreal, 26 June 2009 Workshop on the Post Adjustment System 33
Factors influencing evolution of NTPs Local inflation Montreal, 26 June 2009 Workshop on the Post Adjustment System 34
Factors influencing evolution of NTPs Housing component Rents: – – – – – Based on IOS/OECD data Direct comparison by dwelling size/type Protections for housing-cost fluctuations Protections for payments in non-local hard currency Charts show evolution of rents Others: – – – – – – Maintenance and repair Water Refuse collection Electricity, gas and fuel Other housing costs All these elements are based on price comparisons with New York, with the exception of “Other housing costs” and “Refuse collection”, which are based on information provided by staff Montreal, 26 June 2009 Workshop on the Post Adjustment System 35
Factors influencing evolution of NTPs Housing component (rent) Montreal, 26 June 2009 Workshop on the Post Adjustment System 36
Factors influencing evolution of NTPs Housing component (rent) Montreal, 26 June 2009 Workshop on the Post Adjustment System 37
Factors influencing evolution of NTPs Housing component (rent) Montreal, 26 June 2009 Workshop on the Post Adjustment System 38
Factors influencing evolution of NTPs Housing component (rent) Montreal, 26 June 2009 Workshop on the Post Adjustment System 39
Factors influencing evolution of NTPs Housing component (rent) Montreal, 26 June 2009 Workshop on the Post Adjustment System 40
Factors influencing evolution of NTPs Housing component (rent) Montreal, 26 June 2009 Workshop on the Post Adjustment System 41
Factors influencing evolution of NTPs Housing component (rent) Montreal, 26 June 2009 Workshop on the Post Adjustment System 42
Factors influencing evolution of NTPs Housing component (rent) Montreal, 26 June 2009 Workshop on the Post Adjustment System 43
Factors influencing evolution of NTPs Medical insurance contribution – Average medical insurance contribution at a duty station – Component with the lowest weight in the PAI – Charts show the evolution of the medical insurance contribution over time Montreal, 26 June 2009 Workshop on the Post Adjustment System 44
Factors influencing evolution of NTPs Medical insurance contribution Montreal, 26 June 2009 Workshop on the Post Adjustment System 45
Factors influencing evolution of NTPs Medical insurance contribution Montreal, 26 June 2009 Workshop on the Post Adjustment System 46
Factors influencing evolution of NTPs Medical insurance contribution Montreal, 26 June 2009 Workshop on the Post Adjustment System 47
Factors influencing evolution of NTPs Medical insurance contribution Montreal, 26 June 2009 Workshop on the Post Adjustment System 48
Factors influencing evolution of NTPs Medical insurance contribution Montreal, 26 June 2009 Workshop on the Post Adjustment System 49
Factors influencing evolution of NTPs Medical insurance contribution Montreal, 26 June 2009 Workshop on the Post Adjustment System 50
Factors influencing evolution of NTPs Medical insurance contribution Montreal, 26 June 2009 Workshop on the Post Adjustment System 51
Factors influencing evolution of NTPs Pension contribution – Pension contribution paid by staff – Same proportion of the pensionable remuneration scale for each grade/step – Calculated in US dollars, so different impact on NTP in local currency – Chart shows the evolution, in absolute US dollar values, of the pension contribution Montreal, 26 June 2009 Workshop on the Post Adjustment System 52
Factors influencing evolution of NTPs Pension contribution Montreal, 26 June 2009 Workshop on the Post Adjustment System 53
Factors influencing evolution of NTPs Out-of-Area Index Montreal, 26 June 2009 Workshop on the Post Adjustment System 54
Evolution of the Cost-of-Living (Walsh) Index Weight In-area excl. housing Housing Medical insurance Pension contribution Out-of-area Total 28.68 31.88 6.90 9.37 23.17 100.00 New York Apr-06 Sept-06 Sept-07 Aug-08 a/ 12-M-R 12-M-R 5% Rule 101.75 103.44 105.27 108.39 102.06 102.95 104.29 109.15 111.83 109.95 114.60 126.67 103.80 103.80 106.02 109.41 95.69 99.19 106.80 121.14 101.33 102.78 106.03 112.94 a/ Index calculation for NY as of April 2006, implementation of HQ surveys. Reflects weights established from 2005 HH and Housing survey data and index movements from June 2005 (price collection in NY). Montreal, 26 June 2009 Workshop on the Post Adjustment System 55
Evolution of the Cost-of-Living (Walsh) Index Weight In-area excl. housing Housing Medical insurance Pension contribution Out-of-area Total ER 36.61 22.57 6.54 10.77 23.51 100.00 Vienna Apr-06 Apr-07 May-08 May-09 a/ P/P 12-M-R 5% Rule 12-M-R 105.64 118.10 141.74 125.37 57.98 65.30 79.46 74.37 81.76 90.17 106.70 103.34 103.80 106.02 109.41 116.57 95.69 103.91 117.41 111.32 90.78 99.72 116.19 108.16 0.827 0.750 0.642 0.735 a/ Implementation of Oct 2005 P/P survey Montreal, 26 June 2009 Workshop on the Post Adjustment System 56
Evolution of the Cost-of-Living (Walsh) Index Montreal In-area excl. housing Housing Medical insurance Pension contribution Out-of-area Total ER Jan-06 c/ Weight 12-M-R a/ 114.94 46.55 82.55 17.37 31.32 1.89 128.73 10.70 126.97 23.49 111.59 100.00 1.17 Apr-06 Jan-07 Jun-08 Jun-09 P/P b/ 12-M-R 5%-Rule 12-M-R 97.04 97.87 117.66 106.28 62.71 62.68 73.70 65.14 26.90 27.34 32.21 31.61 103.80 106.02 109.41 116.57 95.69 102.52 118.99 111.22 90.16 92.39 107.83 99.98 1.160 1.160 0.983 1.114 Note: a/ Updating of prior 2000 P/P survey b/ Implementation of Sep 2005 P/P survey The multiplier resulting from the 2005 survey was 46.7. This was lower than the multiplier from the 0.5% rule updating which was 47.9. Therefore, the multiplier implemented was 47.9. c/ Prior review date of Jan06 was kept. Montreal, 26 June 2009 Workshop on the Post Adjustment System 57
Evolution of the Cost-of-Living (Walsh) Index Weight In-area excl. housing Housing Medical insurance Pension contribution Out-of-area Total ER 35.09 25.55 5.44 10.50 23.42 100.00 Paris Apr-06 Apr-07 May-08 May-09 a/ P/P 12-M-R 5% Rule 12-M-R 104.19 116.24 138.82 122.87 78.91 86.81 101.80 90.07 75.06 83.03 95.11 85.98 103.80 106.02 109.41 116.57 95.69 103.91 117.41 111.32 94.12 102.96 118.88 109.12 0.827 0.750 0.642 0.735 a/ Implementation of Sep 2005 P/P survey Montreal, 26 June 2009 Workshop on the Post Adjustment System 58
Evolution of the Cost-of-Living (Walsh) Index Weight In-area excl. housing Housing Medical insurance Pension contribution Out-of-area Total ER 34.03 26.47 5.58 10.50 23.42 100.00 Rome Apr-06 Apr-07 Apr-08 Apr-09 a/ P/P 12-M-R 12-M-R 12-M-R 101.19 113.16 137.11 117.30 74.37 87.10 104.03 90.44 76.43 74.45 91.71 79.52 103.80 106.02 109.41 116.57 95.69 103.91 115.87 112.29 91.69 101.19 117.94 106.83 0.827 0.750 0.634 0.759 a/ Implementation of Oct 2005 P/P survey Montreal, 26 June 2009 Workshop on the Post Adjustment System 59
Evolution of the Cost-of-Living (Walsh) Index Weight In-area excl. housing Housing Medical insurance Pension contribution Out-of-area Total ER 41.49 20.43 3.52 10.98 23.58 100.00 Madrid Apr-06 Apr-07 Mar-08 Mar-09 a/ P/P 12-M-R 5% Rule 12-M-R 95.35 107.54 125.67 108.29 55.70 65.71 77.29 69.83 45.00 49.76 62.30 54.05 103.80 106.02 109.41 116.57 95.69 103.91 113.89 114.05 86.49 95.94 108.99 100.79 0.827 0.750 0.661 0.782 a/ Implementation of Sep 2005 P/P survey Montreal, 26 June 2009 Workshop on the Post Adjustment System 60
Evolution of the Cost-of-Living (Walsh) Index Geneva Weight Apr-06 Apr-07 Jul-08 a/ P/P 12-M-R 5% Rule In-area excl. housing 39.51 114.64 122.26 146.67 Housing 24.02 83.81 91.65 111.31 Medical insurance 4.03 60.81 62.12 77.63 Pension contribution 9.38 103.80 106.02 109.41 Out-of-area 23.06 95.69 103.91 120.40 Total 100.00 99.68 106.73 125.84 ER 1.300 1.220 1.028 a/ Implementation of Sep 2005 P/P survey Montreal, 26 June 2009 Workshop on the Post Adjustment System 61
Evolution of the Cost-of-Living (Walsh) Index Weight In-area excl. housing Housing Medical insurance Pension contribution Out-of-area Total ER 32.31 31.21 3.12 10.07 23.28 100.00 London Apr-06 Apr-07 Mar-08 Mar-09 a/ P/P 12-M-R 5% Rule 12-M-R 107.47 124.49 128.50 96.40 98.68 115.99 125.73 99.06 49.22 55.60 61.89 40.88 103.80 106.02 109.41 116.57 95.69 103.91 113.89 114.05 99.80 113.03 120.23 101.64 0.575 0.509 0.503 0.696 a/ Implementation of Sep 2005 P/P survey Montreal, 26 June 2009 Workshop on the Post Adjustment System 62
Evolution of the Cost-of-Living (Walsh) Index Washington, DC Weight Apr-06 Apr-07 Apr-08 Aug-09 a/ P/P 12-M-R 12-M-R 12-M-R In-area excl. housing 28.99 97.42 98.78 101.89 103.62 Housing 31.94 77.34 76.36 77.21 79.49 Medical insurance 4.37 57.09 59.07 60.45 63.41 Pension contribution 11.09 103.80 106.02 109.41 116.57 Out-of-area 23.62 95.69 103.91 115.87 112.29 Total 100.00 89.55 91.90 96.33 97.64 a/ Implementation of Oct 2005 P/P survey Montreal, 26 June 2009 Workshop on the Post Adjustment System 63
Existing Pay Index vs. Survey PAI 1995 round Existing Survey Pay Index PAI Diff. Survey (%) Date 2000 round Existing Survey Pay Index PAI Diff. Survey (%) Date 2005 round Existing Survey Pay Index PAI Duty Station Survey Date Diff. (%) Geneva Nov 1995 212.6 198.1 -6.8% Sep 2000 124.2 129.0 3.9% Sep 2005 163.5 165.4 1.1% London 142.0 - 156.3 10.1% Sep 2000 - 127.6 - 136.4 - 6.9% Sep 2005 - Sep 2005 152.3 165.7 8.8% Madrid /a Nov 1995 - 139.7 141.9 1.6% Montreal Oct 1995 108.9 124.2 14.1% Sep 2000 107.6 119.2 10.8% Sep 2005 143.3 145.1 1.2% Paris Nov 1995 163.0 172.3 5.7% Sep 2000 109.0 117.9 8.1% Sep 2005 146.1 154.8 5.9% Rome Nov 1995 132.2 137.3 3.9% Oct 2000 100.0 112.2 12.2% Oct 2005 146.1 149.2 2.1% Vienna Nov 1995 179.2 176.4 -1.6% Oct 2000 107.4 117.9 9.7% Oct 2005 142.4 148.5 4.3% Washington, D.C. Sep 1995 123.2 127.5 3.5% Oct 2000 116.8 126.6 8.4% Oct 2005 138.3 146.8 6.1% /a Madrid became an HQ duty station only in the 2005 round Montreal, 26 June 2009 Workshop on the Post Adjustment System 64
Issue #1 Salaries not keeping up with local inflation Salary setting methodology: Keep NTP levels stable in local currency from month to month by adjusting for exchange-rate fluctuations Review PAC once a year for possible increases in salary levels by adjusting for Exchange-rate fluctuations Inflation “experienced by international staff” Apply new PR scale whenever PA for New York changes Montreal, 26 June 2009 Workshop on the Post Adjustment System 65
Issue #1 Salaries not keeping up with local inflation Salary setting methodology not designed to align salaries with local inflation Only the in-area (excluding housing) component of the PAI is affected by local inflation, measured by local CPIs Other components adjusted by other mechanisms approved by the Commission (Housing, MI, PC, OA) CPIs are adjusted to reflect expenditure patterns of UN common system professional staff before being used in PAI calculations See charts Montreal, 26 June 2009 Workshop on the Post Adjustment System 66
Issue #1 Salaries not keeping up with local inflation Montreal, 26 June 2009 Workshop on the Post Adjustment System 67
Issue #1 Salaries not keeping up with local inflation Montreal, 26 June 2009 Workshop on the Post Adjustment System 68
Issue #1 Salaries not keeping up with local inflation Montreal, 26 June 2009 Workshop on the Post Adjustment System 69
Issue #1 Salaries not keeping up with local inflation Montreal, 26 June 2009 Workshop on the Post Adjustment System 70
Issue #1 Salaries not keeping up with local inflation Montreal, 26 June 2009 Workshop on the Post Adjustment System 71
Issue #1 Salaries not keeping up with local inflation Montreal, 26 June 2009 Workshop on the Post Adjustment System 72
Issue #1 Salaries not keeping up with local inflation Montreal, 26 June 2009 Workshop on the Post Adjustment System 73
Issue #1 Salaries not keeping up with local inflation Montreal, 26 June 2009 Workshop on the Post Adjustment System 74
Issue #1 Salaries not keeping up with local inflation Montreal, 26 June 2009 Workshop on the Post Adjustment System 75
Issue #2 Comparison of NTPs based on PAI and those based on other indices Two indices based on different Methodologies Target populations Basket of goods/services Data processing procedures will produce different results Examples 1.Big Mac Index 2.PPP Indices (OECD) Montreal, 26 June 2009 Workshop on the Post Adjustment System 76
Issue #2 PAI versus PPP Index (OECD) Even though the principle of post adjustment is similar to that of PPP, there are important differences: PPP indices based on comparison of prices of goods while PAI also includes expenditures/costs PPP index calculations based on In-area prices only, while PAI based on both in-area and out-of-area expenditures Montreal, 26 June 2009 Workshop on the Post Adjustment System 77
Issue #2 PAI versus PPP Index (OECD) OECD PPPs used: To obtain volume measures of GDP in a common currency To allocate EU Commission’s Structural Funds, aimed to gradually reduce economic disparities, according to PPP-converted GDP per capita Series proposed by IAEA based on “Actual Individual Consumption”, not expenditures Linked with expenditures not just of households but also: Non-Profit Institutions Serving Households (NPISHs) Government Not appropriate for salary setting for international staff (ACPAQ, see ICSC/68/R.9 para. 43) Montreal, 26 June 2009 Workshop on the Post Adjustment System 78
Latest developments for 2010 round Review of items and specifications New PAI structure with a reduced number of basic headings New basket of 26 countries for Out-of-Area Index (including some Group II duty stations) Review of the basket on agenda for ACPAQ 32nd session Re-design of the survey questionnaire Real-time comparisons with New York Increasing use of the Internet as a source of price data Possible modifications of the operational rules Montreal, 26 June 2009 Workshop on the Post Adjustment System 79
Latest developments for 2010 round The new basket of countries of the OA Index 1 United States 14 South Africa * 2 France 15 Japan 3 United Kingdom 16 Philippines * 4 Canada 17 Denmark 5 Germany 18 Brazil * 6 Italy 19 Austria 7 Australia 20 Sweden 8 Belgium 21 Russian Federation * 9 Switzerland 22 Thailand * 10 Spain 23 Senegal * 11 Kenya * 24 Hong Kong, China 12 India * 25 Nigeria * 13 Netherlands 26 Ghana * Countries sorted by weight in the basket; * Group II duty station Montreal, 26 June 2009 Workshop on the Post Adjustment System 80
PAC Review Cycle Date of review for NY: current practice Cost-of-living low 12-month rule 5% 4% 3% 2% 1% Jul 08 Aug 08 Sept 08 Oct 08 Nov 08 Dec 08 Jan 09 Feb 09 Mar 09 Apr 09 Jun 09 Jul 09 Cost-of-living high Aug 09 Sept 09 Oct 09 5% rule 5% 4% 3% 2% 1% Jul 08 Aug 08 Sept 08 Oct 08 Montreal, 26 June 2009 Nov 08 Dec 08 Jan 09 Feb 09 Mar 09 Apr 09 Jun 09 Workshop on the Post Adjustment System Jul 09 Aug 09 Sept 09 Oct 09 81
PAC Review Cycle Elements of the PAC review process for NY US Dollar or US Dollarized Local CPI (BLS) External Rent Data (IOS) Change s medical premiu m (admin data) Change s pension contrib. (admin data) OA Index (CPIs and Exch. Rates) In-Area, excluding Housing Housing Medical component Pension component Out-of-Area component monitoring monthly annual annual annual monthly implementation 5% / 12-month rule Montreal, 26 June 2009 Workshop on the Post Adjustment System 82
PAC Review Cycle Elements of the PAC review process for NY NTP Net Salary – Pension Contribution Net Salary Base salary Pension contribution PA PC NTP Net Take-home Pay Review Pensionable Remuneration scale triggers implementation 5% / 12-month rule Montreal, 26 June 2009 Workshop on the Post Adjustment System 83
PAC reviews cycles for Group I: Current Status 5% / 12-month rule, different dates Jan Feb Mar Apr May Jun 07 07 07 07 07 07 Geneva London Madrid Paris Rome Vienna Jul Aug Sep Oct Nov Dec 08 08 08 08 08 08 New York Montreal Jul Aug Sep Oct Nov Dec Jan Feb Mar Apr May Jun 07 07 07 07 07 07 08 08 08 08 08 08 Montreal, 26 June 2009 Workshop on the Post Adjustment System 84
Proposal 1: Align timing of PAC reviews of all Group I DSs with NY Option 1: Review at least once a year when NY gets reviewed, with possibility of independent reviews (5% rule) Jan Feb Mar Apr May Jun 07 07 07 07 07 07 New York Geneva London Madrid Montreal Paris Rome Vienna Montreal, 26 June 2009 Jul Aug Sep Oct Nov Dec Jan Feb Mar Apr May Jun 07 07 07 07 07 07 08 08 08 08 08 08 Jul Aug Sep Oct Nov Dec 08 08 08 08 08 08 Workshop on the Post Adjustment System 85
Proposal 1: Align timing of PAC reviews of all Group I DSs with NY Option 2: Review only once a year on the same date for all, with no independent reviews Jan Feb Mar Apr May Jun 07 07 07 07 07 07 New York Geneva London Madrid Montreal Paris Rome Vienna Montreal, 26 June 2009 Jul Aug Sep Oct Nov Dec Jan Feb Mar Apr May Jun 07 07 07 07 07 07 08 08 08 08 08 08 Jul Aug Sep Oct Nov Dec 08 08 08 08 08 08 Workshop on the Post Adjustment System 86
Proposal 1: Align timing of PAC reviews of all Group I DSs with NY Implications for duty stations Effect Option 1 Option 2 End of duty station-specific PAC reviews No Yes Simultaneous reductions in NTP owing to increased Pension Contribution Yes Yes Montreal, 26 June 2009 Workshop on the Post Adjustment System 87
Proposal 1: Align timing of PAC reviews of all Group I DSs with NY Financial implications On-going secretariat work load: the same Redesign the system: yes, minimal efforts Budget for secretariat operations: the same Budget for organizations: the same (time shifts) Potential for more frequent salary increases (under Option 1): 1. Any time New York is reviewed 2. When the 5% rule is applicable to the duty station Montreal, 26 June 2009 Workshop on the Post Adjustment System 88
Proposal 2: Shorten Survey Rounds Current settings Type of survey Headquarters Duty Station Washington D.C. Group I Group II Every 5 years Every 4-5 years Every 1-3 years Once in between (mid-round) consecutive PP surveys (for rental thresholds only) Once in between (mid-round) consecutive PP surveys (for rental thresholds only) Once a year (for rental index and thresholds) Place-to-place Housing Montreal, 26 June 2009 Workshop on the Post Adjustment System 89
Proposal 2: Shorten Survey Rounds Implications estimated under current settings with the only exception of duration of Survey Round Implications are primarily of two types: Financial: – Direct costs – Staff time (and cost) Note: some minor costs (printing, shipping/handling, additional IT, etc.) could not be estimated due to accounting structure) Logistical and organizational considerations Montreal, 26 June 2009 Workshop on the Post Adjustment System 90
Proposal 2: Shorten Survey Rounds Summary of financial implications (underestimates) Average per year Cost of 5 years of operations Difference (3-year vs. 5-year) 5-year Round 3-year Round 5-year Round 3-year Round Direct costs 124,807 162,300 624,033 811,500 187,467 Staff time 216,285 360,476 1,081,427 1,802,379 720,951 Total 341,092 522,776 1,705,460 2,613,879 908,418 Montreal, 26 June 2009 Workshop on the Post Adjustment System 91
Proposal 2: Shorten Survey Rounds Summary of implications On-going secretariat work load: – slightly higher – Additional staff requirements: 1 P and 0.5 GS staff over 5 years Redesign the system: yes, nearly twice as much as now Budget for secretariat operations: – higher ( 1M US over 5 years), including estimated cost of staff time Burden of keeping several IT systems running simultaneously Montreal, 26 June 2009 Workshop on the Post Adjustment System 92