WORKSHOP 15 to Finish Enrollment Intensity and Student

31 Slides1.86 MB
WORKSHOP 15 to Finish Enrollment Intensity and Student Achievement Campaign Advisor/Recruiter Workshop CSN, NSC, UNLV March 28, 2013
Creating a Culture of Completion Today’s Presentation What: 15 to Finish Campaign Why: Data, data, data How: Campaign Toolkit; Advising Strategies Campaign Endorsed in 2013 by Board of Regents and your Presidents 2
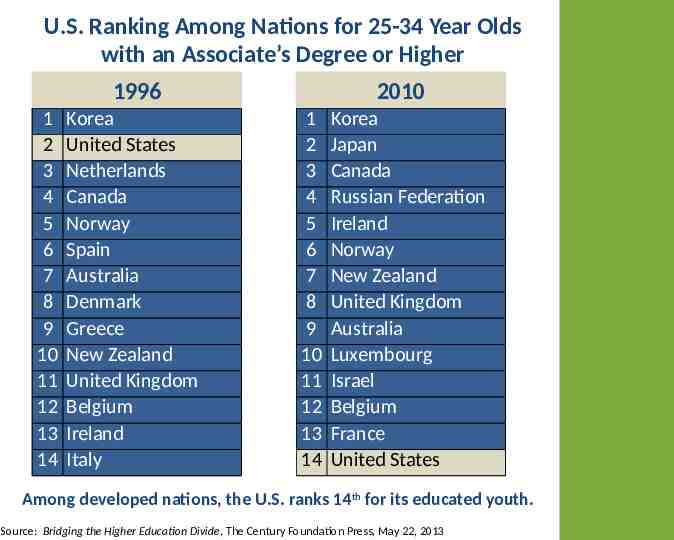
U.S. Ranking Among Nations for 25-34 Year Olds with an Associate’s Degree or Higher 1996 1 2 3 4 5 6 7 8 9 10 11 12 13 14 Korea United States Netherlands Canada Norway Spain Australia Denmark Greece New Zealand United Kingdom Belgium Ireland Italy 2010 1 2 3 4 5 6 7 8 9 10 11 12 13 14 Korea Japan Canada Russian Federation Ireland Norway New Zealand United Kingdom Australia Luxembourg Israel Belgium France United States Among developed nations, the U.S. ranks 14th for its educated youth. Source: Bridging the Higher Education Divide, The Century Foundation Press, May 22, 2013 3
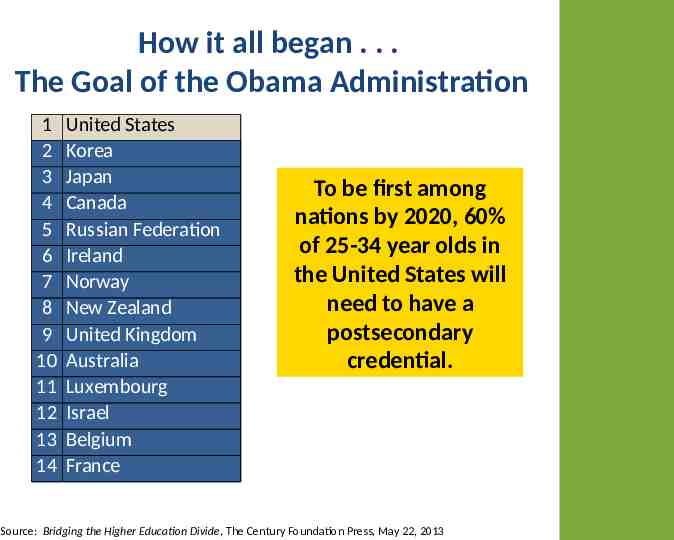
How it all began . . . The Goal of the Obama Administration 1 2 3 4 5 6 7 8 9 10 11 12 13 14 United States Korea Japan Canada Russian Federation Ireland Norway New Zealand United Kingdom Australia Luxembourg Israel Belgium France To be first among nations by 2020, 60% of 25-34 year olds in the United States will need to have a postsecondary credential. Source: Bridging the Higher Education Divide, The Century Foundation Press, May 22, 2013 4
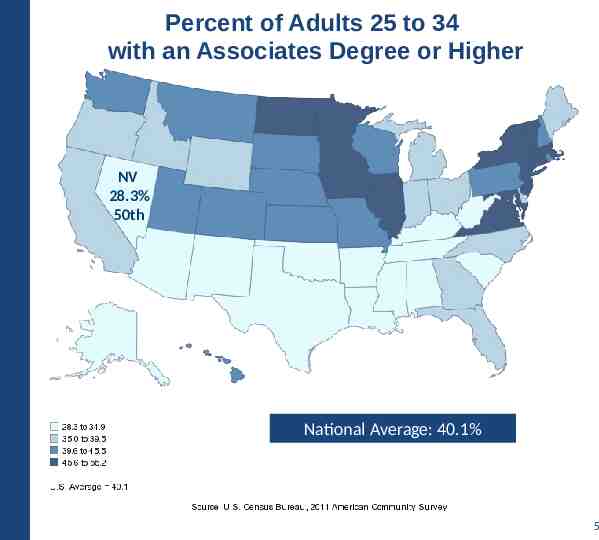
Percent of Adults 25 to 34 with an Associates Degree or Higher NV 28.3% 50th National Average: 40.1% 5
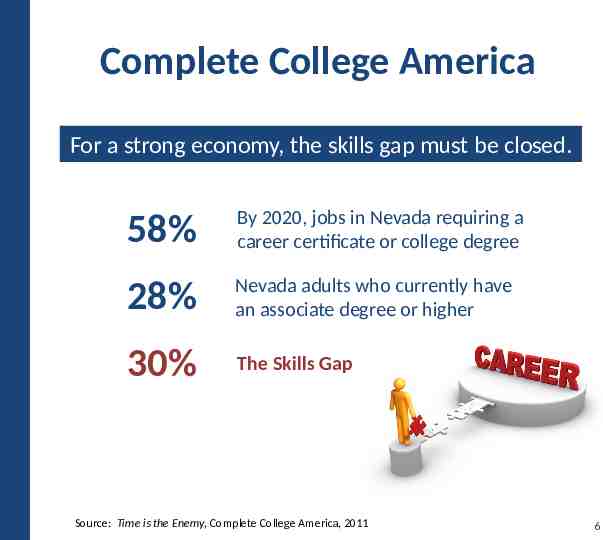
Complete College America For a strong economy, the skills gap must be closed. 58% By 2020, jobs in Nevada requiring a career certificate or college degree 28% Nevada adults who currently have an associate degree or higher 30% The Skills Gap Source: Time is the Enemy, Complete College America, 2011 6
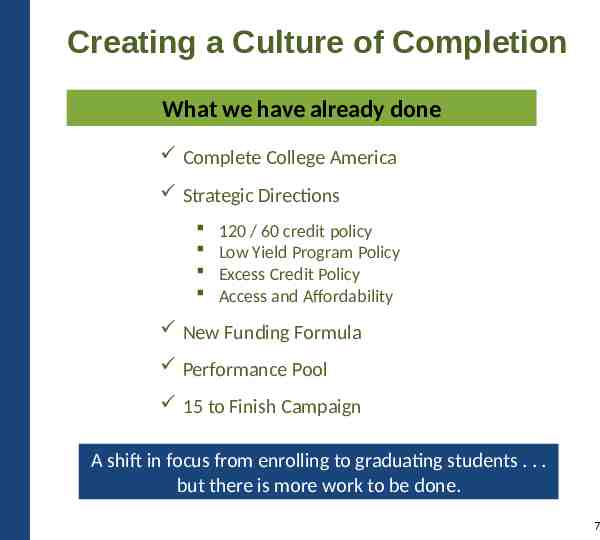
Creating a Culture of Completion What we have already done Complete College America Strategic Directions 120 / 60 credit policy Low Yield Program Policy Excess Credit Policy Access and Affordability New Funding Formula Performance Pool 15 to Finish Campaign A shift in focus from enrolling to graduating students . . . but there is more work to be done. 7
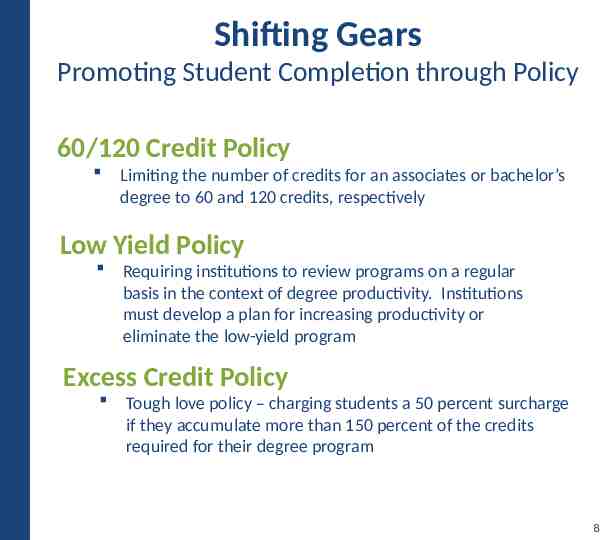
Shifting Gears Promoting Student Completion through Policy 60/120 Credit Policy Limiting the number of credits for an associates or bachelor’s degree to 60 and 120 credits, respectively Low Yield Policy Requiring institutions to review programs on a regular basis in the context of degree productivity. Institutions must develop a plan for increasing productivity or eliminate the low-yield program Excess Credit Policy Tough love policy – charging students a 50 percent surcharge if they accumulate more than 150 percent of the credits required for their degree program 8
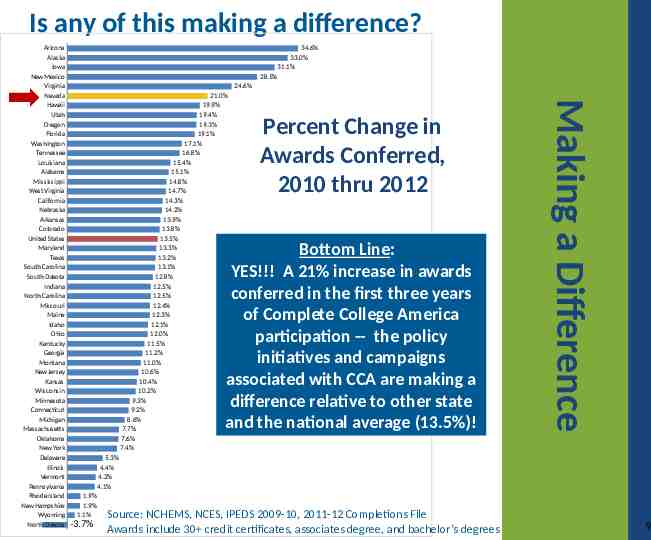
Is any of this making a difference? 34.6% 33.0% 31.1% 28.5% 24.6% 21.0% 19.9% 19.4% 19.3% 19.1% 17.1% 16.8% 15.4% 15.1% 14.8% 14.7% 14.3% 14.2% 13.9% 13.8% 13.5% 13.3% 13.2% 13.1% 12.8% 12.5% 12.5% 12.4% 12.3% 12.1% 12.0% 11.5% 11.2% 11.0% 10.6% 10.4% 10.2% 9.3% 9.2% 8.6% 7.7% 7.6% 7.4% Percent Change in Awards Conferred, 2010 thru 2012 Bottom Line: YES!!! A 21% increase in awards conferred in the first three years of Complete College America participation -- the policy initiatives and campaigns associated with CCA are making a difference relative to other state and the national average (13.5%)! Making a Difference Arizona Alaska Iowa New Mexico Virginia Nevada Hawaii Utah Oregon Florida Washington Tennessee Louisiana Alabama Mississippi West Virginia California Nebraska Arkansas Colorado United States Maryland Texas South Carolina South Dakota Indiana North Carolina Missouri Maine Idaho Ohio Kentucky Georgia Montana New Jersey Kansas Wisconsin Minnesota Connecticut Michigan Massachusetts Oklahoma New York Delaware Illinois Vermont Pennsylvania Rhode Island New Hampshire Wyoming North Dakota 5.3% 4.4% 4.2% 4.1% 1.9% 1.9% 1.1% -3.7% Source: NCHEMS, NCES, IPEDS 2009-10, 2011-12 Completions File Awards include 30 credit certificates, associates degree, and bachelor’s degrees 9
What: 15 to Finish Campaign Encourage full-time enrollment – 15 credits per semester or 30 credits per year o Complete a 4-year degree in 4 years o Complete a 2-year degree in 2 years Finish college faster and start a career that provides financial independence o Meet Complete College America goals Use a mix of media to target 18-24 year olds and their parents o o o o Facebook Public Service Announcements Student Newspapers Videos at college tours/fairs, high school senior parent nights & senior events, in public places like dining commons, student unions, etc Student advising / Student orientation 10
FOCUS OF CAMPAIGN 15 to Finish Encouraging students to enroll in 15 credits per term OR 30 credits per year Targeted Student Population: Ages 18 to 24 Taking 12 to 14 credits 11
Shift Focus to Benefits of 15 Hours/Semester Full Time Benefits include: Progress from freshman to sophomore status after first year; More likely to graduate; Pay less in tuition and living expenses; Gain additional years of earnings; Free up limited classroom space for other students Source: The Power of 15 Hours, Enrollment Intensity and Postsecondary Student Achievement by Dr. Nate Johnson. Fall 2012 12
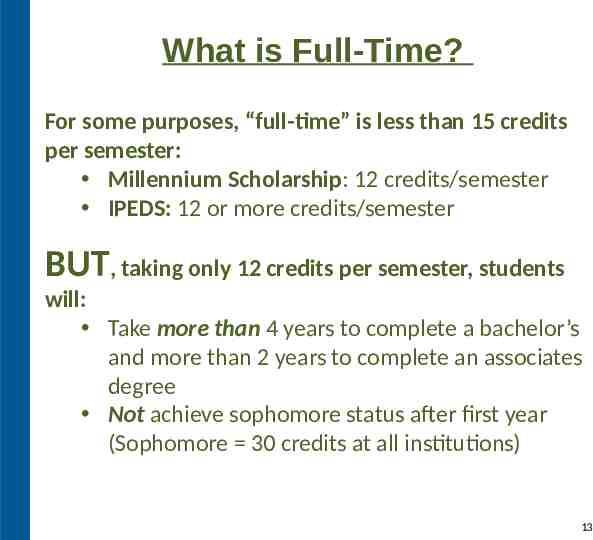
What is Full-Time? For some purposes, “full-time” is less than 15 credits per semester: Millennium Scholarship: 12 credits/semester IPEDS: 12 or more credits/semester BUT, taking only 12 credits per semester, students will: Take more than 4 years to complete a bachelor’s and more than 2 years to complete an associates degree Not achieve sophomore status after first year (Sophomore 30 credits at all institutions) 13
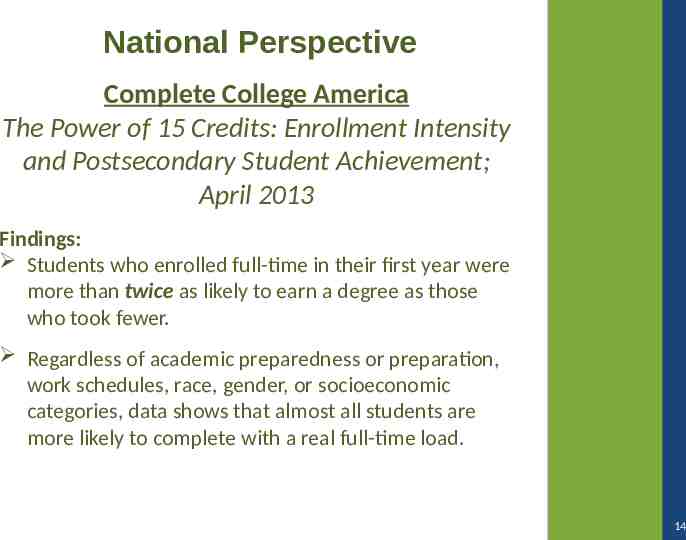
National Perspective Complete College America The Power of 15 Credits: Enrollment Intensity and Postsecondary Student Achievement; April 2013 Findings: Students who enrolled full-time in their first year were more than twice as likely to earn a degree as those who took fewer. Regardless of academic preparedness or preparation, work schedules, race, gender, or socioeconomic categories, data shows that almost all students are more likely to complete with a real full-time load. 14
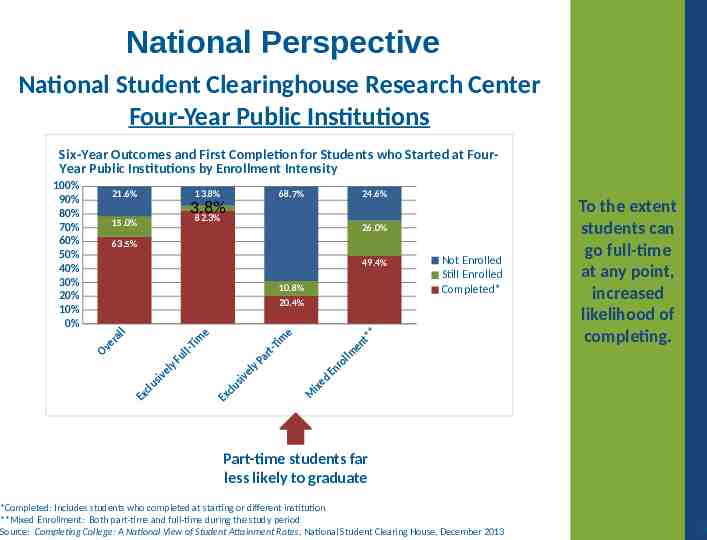
National Perspective National Student Clearinghouse Research Center Four-Year Public Institutions Six-Year Outcomes and First Completion for Students who Started at FourYear Public Institutions by Enrollment Intensity 100% 90% 80% 70% 60% 50% 40% 30% 20% 10% 0% 21.6% 13.8% 68.7% 3.8% 82.3% 15.0% 24.6% 26.0% 63.5% 49.4% 10.8% 20.4% ll ra e Ov clu Ex siv y el Fu m Ti l l- e clu Ex e siv ly im tr -T Pa e ix M ed l ro n E lm en Not Enrolled Still Enrolled Completed* * t* To the extent students can go full-time at any point, increased likelihood of completing. Part-time students far less likely to graduate *Completed: Includes students who completed at starting or different institution **Mixed Enrollment: Both part-time and full-time during the study period Source: Completing College: A National View of Student Attainment Rates, National Student Clearing House, December 2013 15
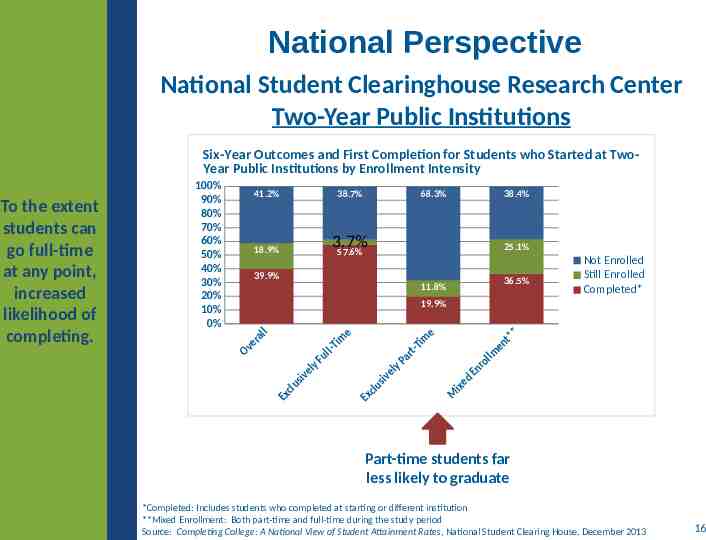
National Perspective National Student Clearinghouse Research Center Two-Year Public Institutions Six-Year Outcomes and First Completion for Students who Started at TwoYear Public Institutions by Enrollment Intensity To the extent students can go full-time at any point, increased likelihood of completing. 100% 90% 80% 70% 60% 50% 40% 30% 20% 10% 0% 41.2% 38.7% 68.3% 18.9% 3.7% 57.6% 38.4% 25.1% 39.9% 36.5% 11.8% Not Enrolled Still Enrolled Completed* 19.9% ll ra e Ov clu Ex siv y el Fu m Ti l l- e clu Ex e siv ly im tr -T Pa e ix M ed l ro n E lm en * t* Part-time students far less likely to graduate *Completed: Includes students who completed at starting or different institution **Mixed Enrollment: Both part-time and full-time during the study period Source: Completing College: A National View of Student Attainment Rates, National Student Clearing House, December 2013 16
National Perspective (continued) National Center for Education Statistics o Undergraduates enrolled full-time – 30 or more credits completed in first year – are more likely to graduate on time than students who completed fewer credits per year. Source: National Beginning Postsecondary Student Survey, 2004-09 o Withdrawal rates are lower for full-time students. One-third of part-time students withdrew in their first year. Source: NCES Report 2011-12 17
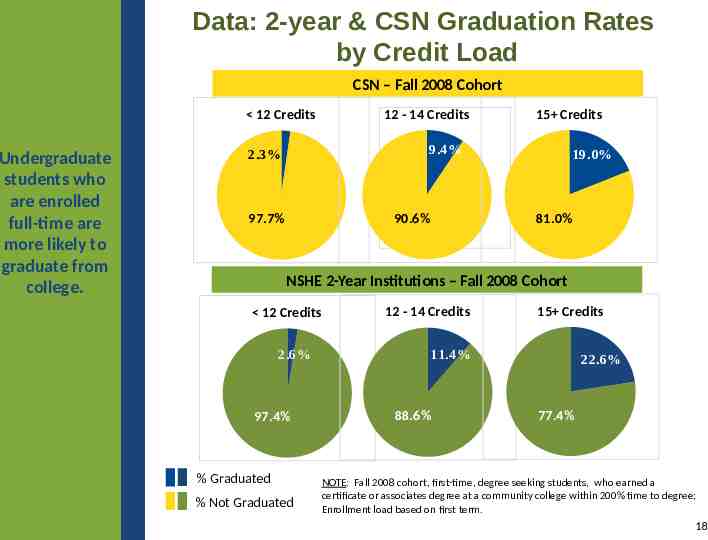
Data: 2-year & CSN Graduation Rates by Credit Load CSN – Fall 2008 Cohort 12 - 14 Credits 12 Credits Undergraduate students who are enrolled full-time are more likely to graduate from college. 15 Credits 9.4% 2.3% 19.0% 88.6% 90.6% 97.7% 77.4% 81.0% NSHE 2-Year Institutions – Fall 2008 Cohort 12 Credits 2.6% 97.4% % Graduated % Not Graduated 12 - 14 Credits 15 Credits 11.4% 88.6% 22.6% 77.4% NOTE: Fall 2008 cohort, first-time, degree seeking students, who earned a certificate or associates degree at a community college within 200% time to degree; Enrollment load based on first term. 18
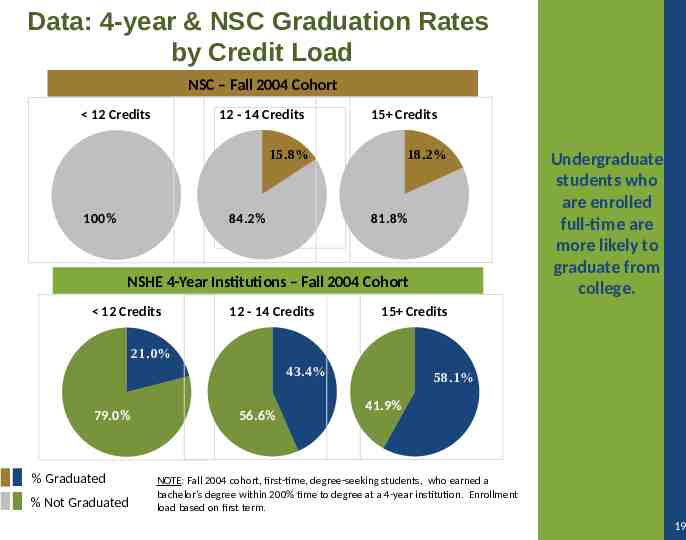
Data: 4-year & NSC Graduation Rates by Credit Load NSC – Fall 2004 Cohort 12 - 14 Credits 12 Credits 15 Credits 15.8% 18.2% 88.6% 84.2% 100% 77.4% 81.8% NSHE 4-Year Institutions – Fall 2004 Cohort 12 Credits 12 - 14 Credits Undergraduate students who are enrolled full-time are more likely to graduate from college. 15 Credits 21.0% 43.4% 79.0% % Graduated % Not Graduated 56.6% 58.1% 41.9% NOTE: Fall 2004 cohort, first-time, degree-seeking students, who earned a bachelor’s degree within 200% time to degree at a 4-year institution. Enrollment load based on first term. 19
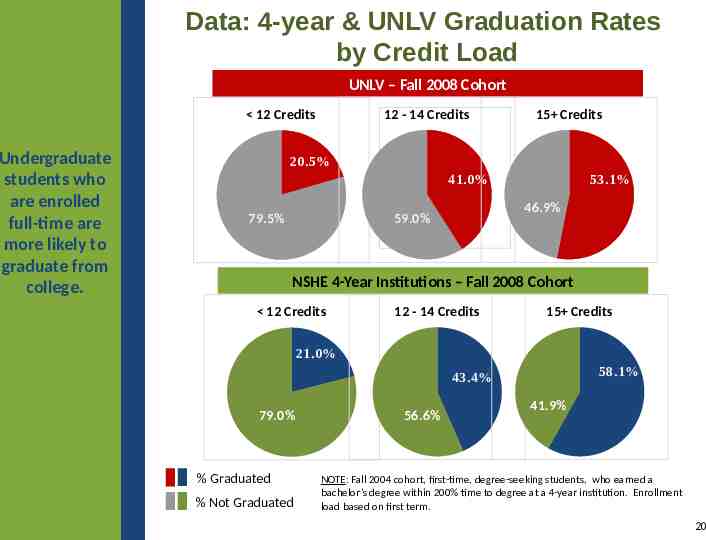
Data: 4-year & UNLV Graduation Rates by Credit Load UNLV – Fall 2008 Cohort 12 - 14 Credits 12 Credits Undergraduate students who are enrolled full-time are more likely to graduate from college. 15 Credits 20.5% 41.0% 88.6% 59.0% 79.5% 53.1% 46.9% 77.4% NSHE 4-Year Institutions – Fall 2008 Cohort 12 Credits 12 - 14 Credits 15 Credits 21.0% 58.1% 43.4% 79.0% % Graduated % Not Graduated 56.6% 41.9% NOTE: Fall 2004 cohort, first-time, degree-seeking students, who earned a bachelor’s degree within 200% time to degree at a 4-year institution. Enrollment load based on first term. 20
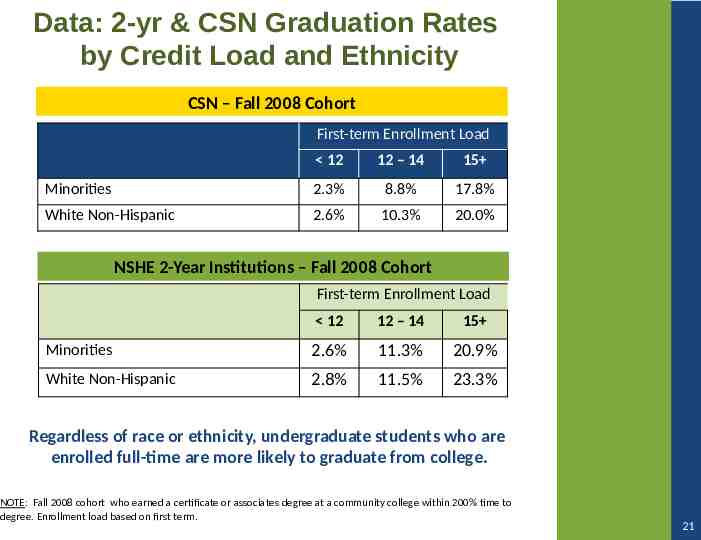
Data: 2-yr & CSN Graduation Rates by Credit Load and Ethnicity CSN – Fall 2008 Cohort First-term Enrollment Load 12 12 – 14 15 Minorities 2.3% 8.8% 17.8% White Non-Hispanic 2.6% 10.3% 20.0% NSHE 2-Year Institutions – Fall 2008 Cohort First-term Enrollment Load 12 12 – 14 15 Minorities 2.6% 11.3% 20.9% White Non-Hispanic 2.8% 11.5% 23.3% Regardless of race or ethnicity, undergraduate students who are enrolled full-time are more likely to graduate from college. NOTE: Fall 2008 cohort who earned a certificate or associates degree at a community college within 200% time to degree. Enrollment load based on first term. 21
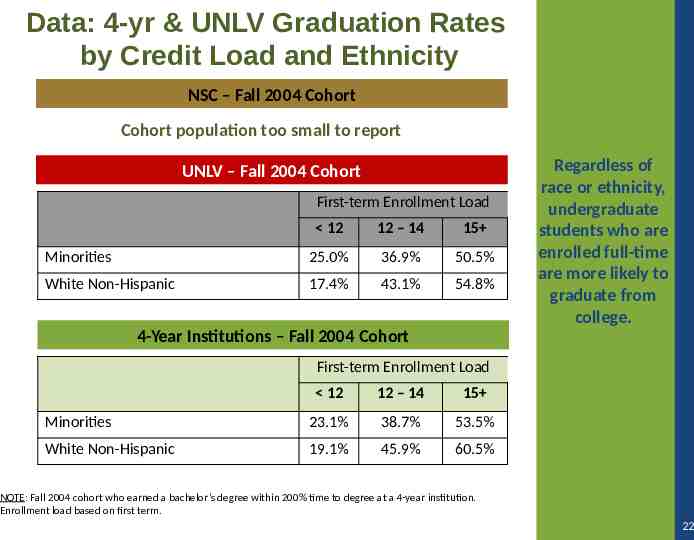
Data: 4-yr & UNLV Graduation Rates by Credit Load and Ethnicity NSC – Fall 2004 Cohort Cohort population too small to report UNLV – Fall 2004 Cohort First-term Enrollment Load 12 12 – 14 15 Minorities 25.0% 36.9% 50.5% White Non-Hispanic 17.4% 43.1% 54.8% Regardless of race or ethnicity, undergraduate students who are enrolled full-time are more likely to graduate from college. 4-Year Institutions – Fall 2004 Cohort First-term Enrollment Load 12 12 – 14 15 Minorities 23.1% 38.7% 53.5% White Non-Hispanic 19.1% 45.9% 60.5% NOTE: Fall 2004 cohort who earned a bachelor’s degree within 200% time to degree at a 4-year institution. Enrollment load based on first term. 22
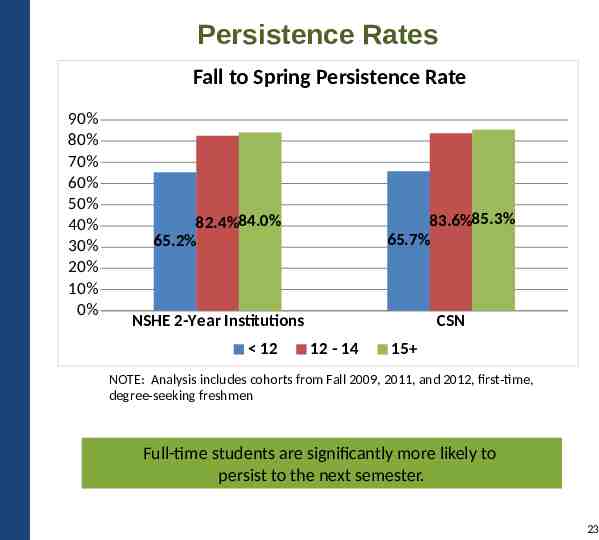
Persistence Rates Fall to Spring Persistence Rate 90% 80% 70% 60% 50% 40% 30% 20% 10% 0% 82.4%84.0% 65.2% 83.6%85.3% 65.7% NSHE 2-Year Institutions CSN 12 12 - 14 15 NOTE: Analysis includes cohorts from Fall 2009, 2011, and 2012, first-time, degree-seeking freshmen Full-time students are significantly more likely to persist to the next semester. 23
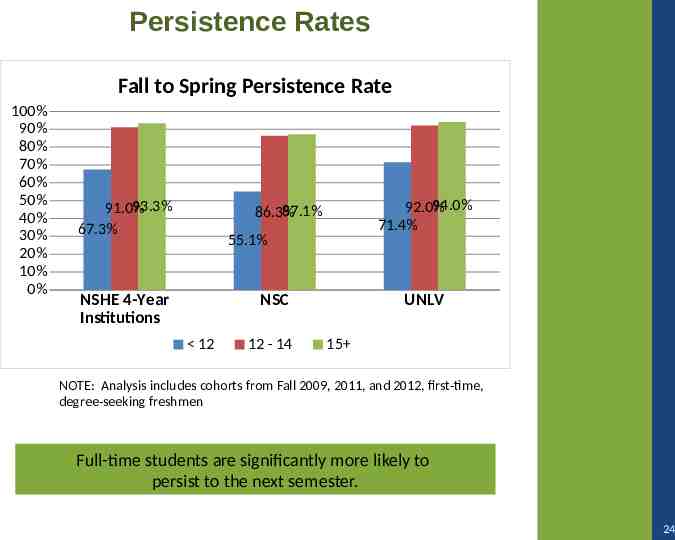
Persistence Rates Fall to Spring Persistence Rate 100% 90% 80% 70% 60% 50% 40% 30% 20% 10% 0% 93.3% 91.0% 67.3% 94.0% 92.0% 71.4% 87.1% 86.3% 55.1% NSHE 4-Year Institutions NSC 12 12 - 14 UNLV 15 NOTE: Analysis includes cohorts from Fall 2009, 2011, and 2012, first-time, degree-seeking freshmen Full-time students are significantly more likely to persist to the next semester. 24
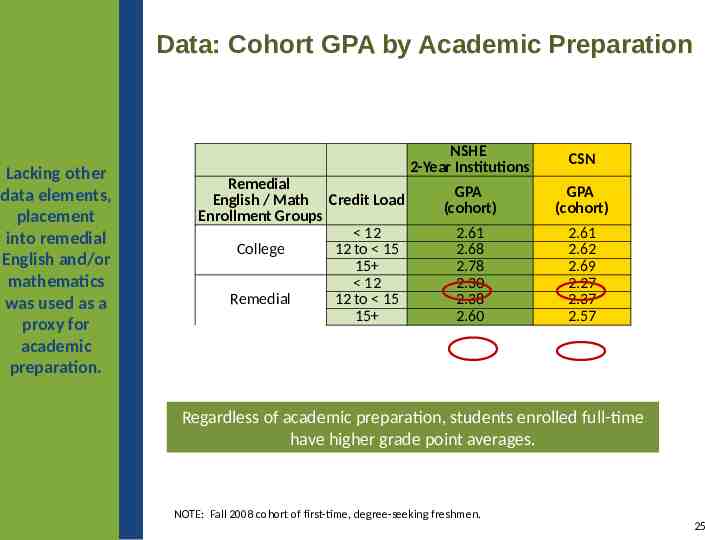
Data: Cohort GPA by Academic Preparation Lacking other data elements, placement into remedial English and/or mathematics was used as a proxy for academic preparation. Remedial English / Math Credit Load Enrollment Groups 12 College 12 to 15 15 12 Remedial 12 to 15 15 NSHE 2-Year Institutions CSN GPA (cohort) GPA (cohort) 2.61 2.68 2.78 2.30 2.38 2.60 2.61 2.62 2.69 2.27 2.37 2.57 Regardless of academic preparation, students enrolled full-time have higher grade point averages. NOTE: Fall 2008 cohort of first-time, degree-seeking freshmen. 25
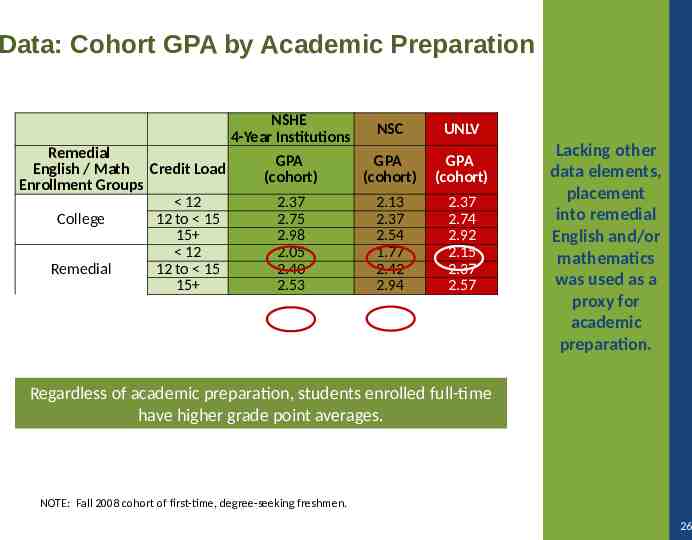
Data: Cohort GPA by Academic Preparation Remedial English / Math Credit Load Enrollment Groups 12 College 12 to 15 15 12 Remedial 12 to 15 15 NSHE 4-Year Institutions NSC UNLV GPA (cohort) GPA (cohort) GPA (cohort) 2.37 2.75 2.98 2.05 2.40 2.53 2.13 2.37 2.54 1.77 2.42 2.94 2.37 2.74 2.92 2.15 2.37 2.57 Lacking other data elements, placement into remedial English and/or mathematics was used as a proxy for academic preparation. Regardless of academic preparation, students enrolled full-time have higher grade point averages. NOTE: Fall 2008 cohort of first-time, degree-seeking freshmen. 26
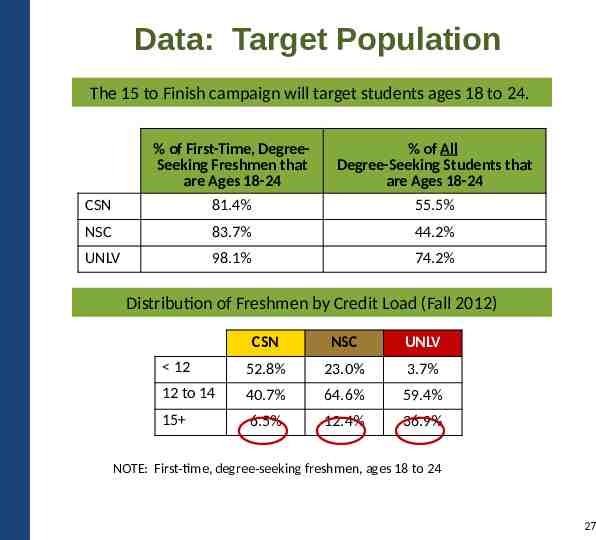
Data: Target Population The 15 to Finish campaign will target students ages 18 to 24. % of First-Time, DegreeSeeking Freshmen that are Ages 18-24 % of All Degree-Seeking Students that are Ages 18-24 CSN 81.4% 55.5% NSC 83.7% 44.2% UNLV 98.1% 74.2% Distribution of Freshmen by Credit Load (Fall 2012) CSN NSC UNLV 12 52.8% 23.0% 3.7% 12 to 14 40.7% 64.6% 59.4% 15 6.5% 12.4% 36.9% NOTE: First-time, degree-seeking freshmen, ages 18 to 24 27
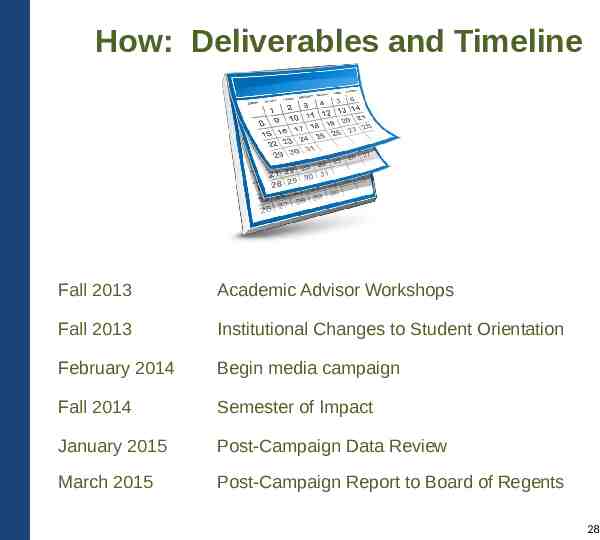
How: Deliverables and Timeline Fall 2013 Academic Advisor Workshops Fall 2013 Institutional Changes to Student Orientation February 2014 Begin media campaign Fall 2014 Semester of Impact January 2015 Post-Campaign Data Review March 2015 Post-Campaign Report to Board of Regents 28
Campaign Toolkit Web Site: http://www.nevada.edu/15 Logos Postcards Poster Student Handout Video Workshop presentations 29
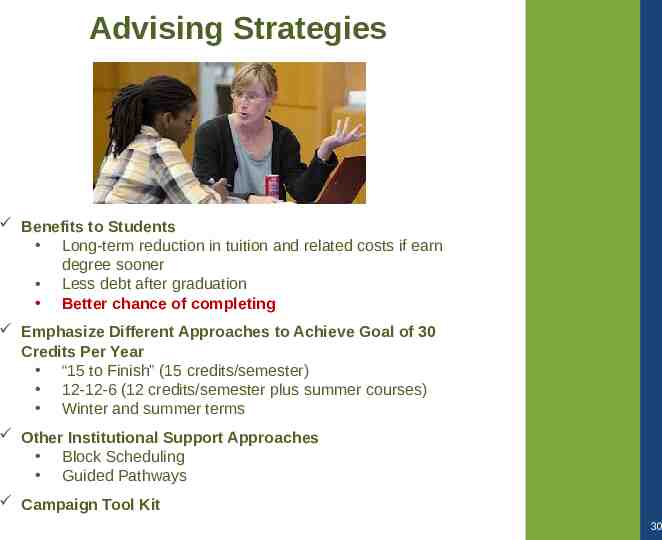
Advising Strategies Benefits to Students Long-term reduction in tuition and related costs if earn degree sooner Less debt after graduation Better chance of completing Emphasize Different Approaches to Achieve Goal of 30 Credits Per Year “15 to Finish” (15 credits/semester) 12-12-6 (12 credits/semester plus summer courses) Winter and summer terms Other Institutional Support Approaches Block Scheduling Guided Pathways Campaign Tool Kit 30
QUESTIONS? 31