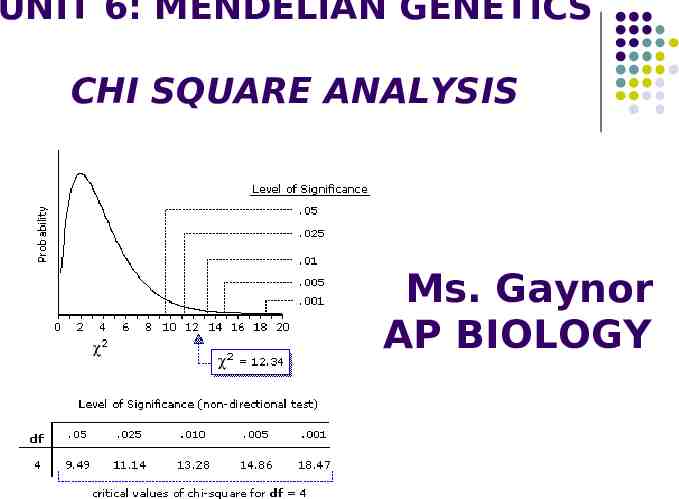
UNIT 6: MENDELIAN GENETICS CHI SQUARE ANALYSIS Ms. Gaynor AP BIOLOGY
18 Slides996.50 KB
UNIT 6: MENDELIAN GENETICS CHI SQUARE ANALYSIS Ms. Gaynor AP BIOLOGY
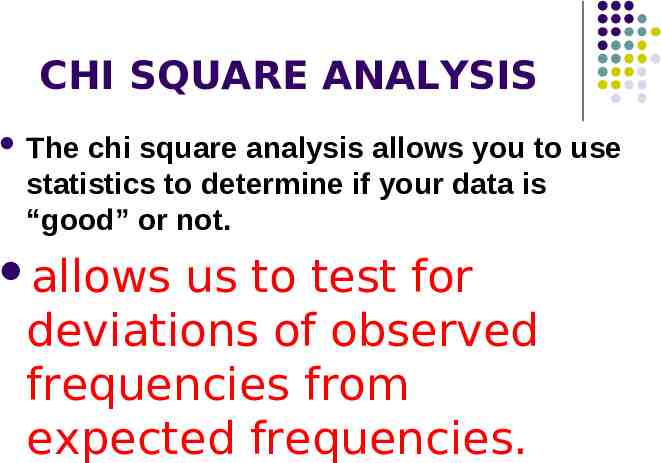
CHI SQUARE ANALYSIS The chi square analysis allows you to use statistics to determine if your data is “good” or not. allows us to test for deviations of observed frequencies from expected frequencies.
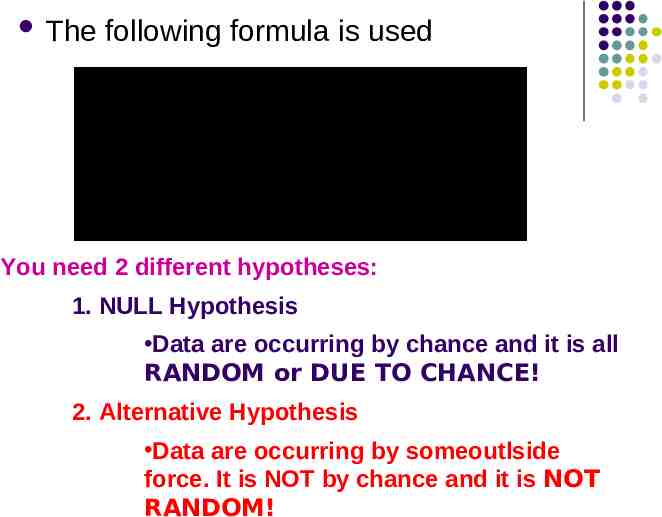
The following formula is used You need 2 different hypotheses: 1. NULL Hypothesis Data are occurring by chance and it is all RANDOM or DUE TO CHANCE! 2. Alternative Hypothesis Data are occurring by someoutlside force. It is NOT by chance and it is NOT RANDOM!
Two Types of Hypotheses: 1. NULL HYPOTHESIS that there is no substantial statistical deviation between observed and expected data. a hypothesis of no difference (or no effect) is called a null hypothesis symbolized H0 states In other words, the results are totally random and occurred by chance alone. The null hypothesis states that the two variables are independent, or that there is NO relationship to one another.
Two Types of Hypotheses: 2. ALTERNATIVE HYPOTHESIS that there IS a substantial statistical deviation between observed and expected data. a hypothesis of difference (or effect) is called a alternative hypothesis symbolized H1 states In other words, the results are affected by an outside force and are NOT random and di NOT occur by chance alone.
Null Hypothesis Example A scientist studying bees and butterflies. Her hypothesis was that a single bee visiting a flower will pollinate with a higher efficiency than a single butterfly, which will help produce a greater number of seeds in the flower bean pod. We will call this hypothesis H1 or an alternate hypothesis because it is an alternative to the null hypothesis. What is the null hypothesis? H0: There is no difference between bees and butterflies in the number of seeds produced by the flowers they pollinate.
2 Types of Chi Square Problems 1. Non-genetic Chi Square: Null Hypothesis: Data is due to chance and is completely random. There is no preference between the groups/categories. Alternative Hypothesis Data is NOT due to chance and there IS a preference between group/categories. Data is not random.
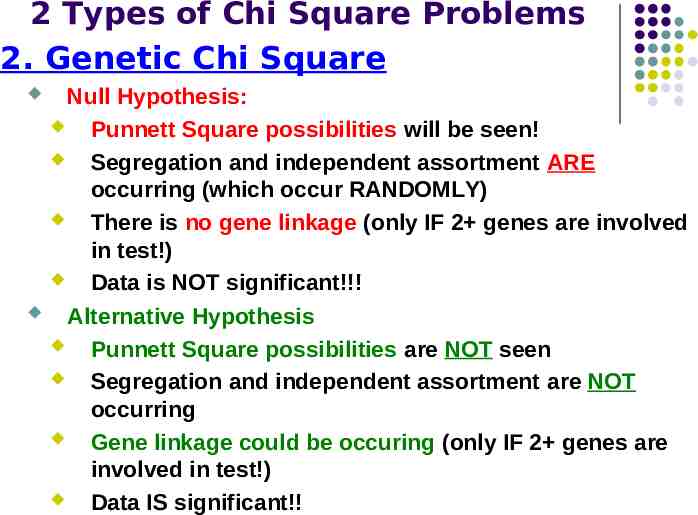
2 Types of Chi Square Problems 2. Genetic Chi Square Null Hypothesis: Punnett Square possibilities will be seen! Segregation and independent assortment ARE occurring (which occur RANDOMLY) There is no gene linkage (only IF 2 genes are involved in test!) Data is NOT significant!!! Alternative Hypothesis Punnett Square possibilities are NOT seen Segregation and independent assortment are NOT occurring Gene linkage could be occuring (only IF 2 genes are involved in test!) Data IS significant!!
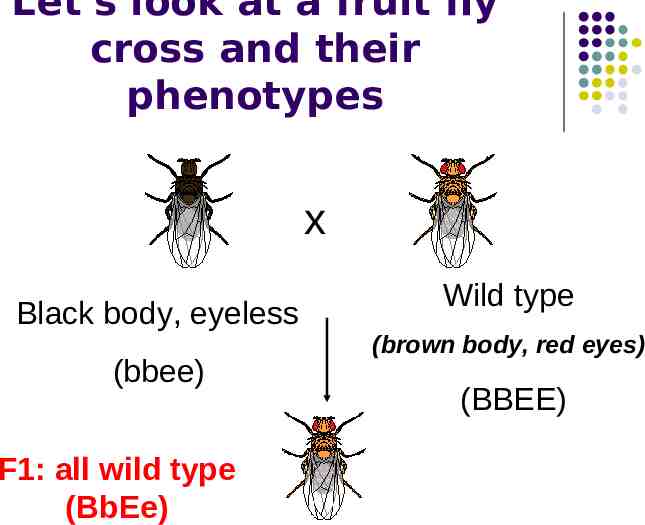
Let’s look at a fruit fly cross and their phenotypes x Black body, eyeless (bbee) F1: all wild type (BbEe) Wild type (brown body, red eyes) (BBEE)
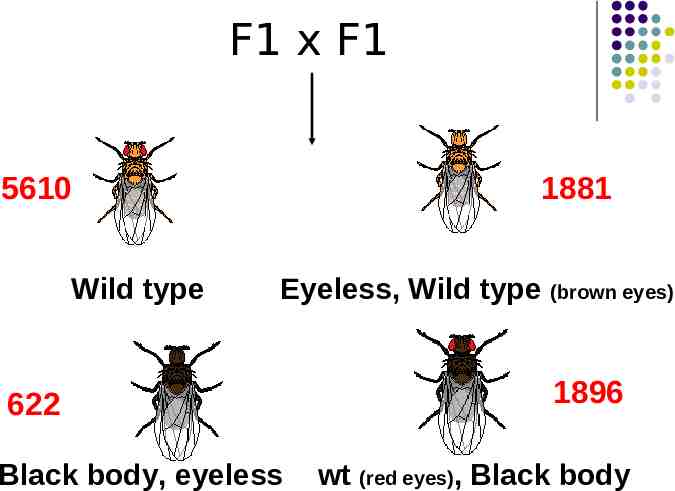
F1 x F1 5610 Wild type 1881 Eyeless, Wild type (brown eyes) 622 Black body, eyeless 1896 wt (red eyes), Black body
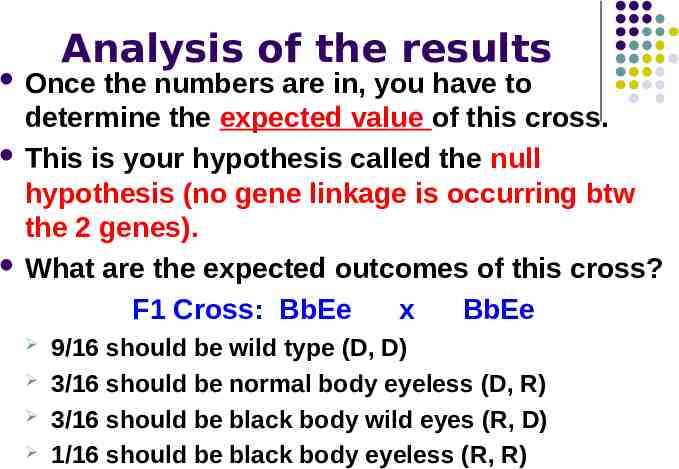
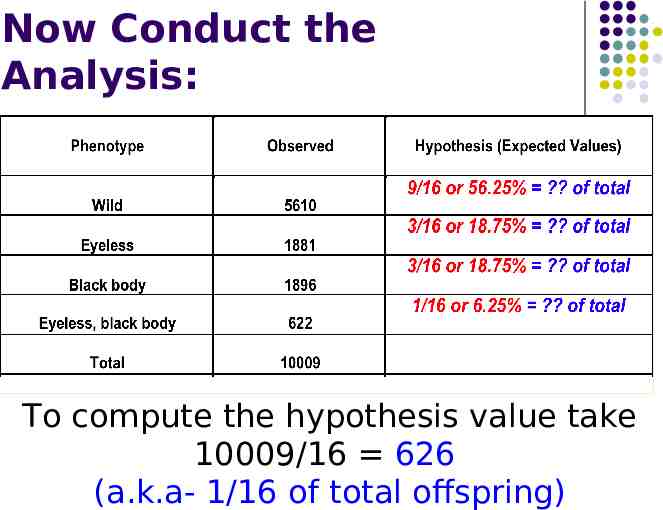
Analysis of the results Once the numbers are in, you have to determine the expected value of this cross. This is your hypothesis called the null hypothesis (no gene linkage is occurring btw the 2 genes). What are the expected outcomes of this cross? F1 Cross: BbEe x BbEe 9/16 should be wild type (D, D) 3/16 should be normal body eyeless (D, R) 3/16 should be black body wild eyes (R, D) 1/16 should be black body eyeless (R, R)
Now Conduct the Analysis: To compute the hypothesis value take 10009/16 626 (a.k.a- 1/16 of total offspring)
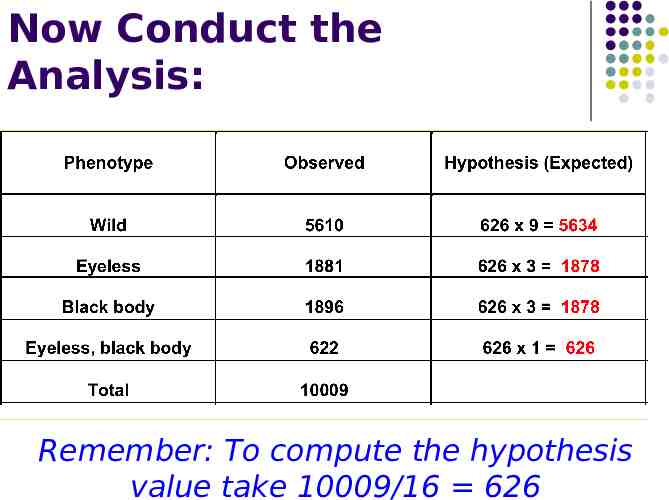
Now Conduct the Analysis: Remember: To compute the hypothesis value take 10009/16 626
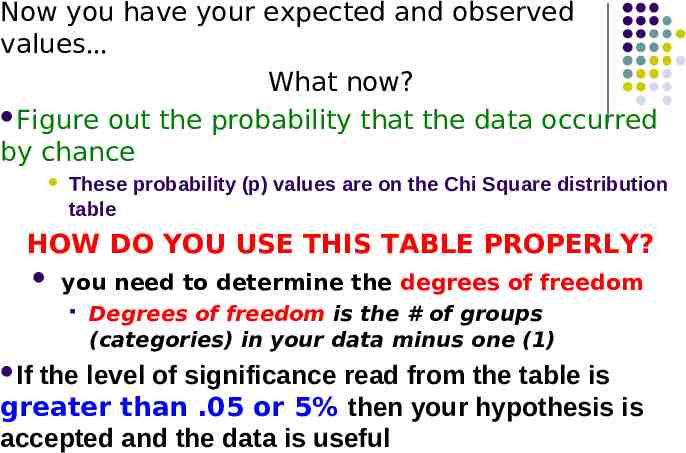
Now you have your expected and observed values What now? Figure out the probability that the data occurred by chance These probability (p) values are on the Chi Square distribution table HOW DO YOU USE THIS TABLE PROPERLY? If you need to determine the degrees of freedom Degrees of freedom is the # of groups (categories) in your data minus one (1) the level of significance read from the table is greater than .05 or 5% then your hypothesis is accepted and the data is useful
I Have my Chi Square Value (X2) .What next? Figure out which hypothesis is accepted: your NULL hypothesis 9:3:3:1 ratio is seen due to independent assortment/ segregation is occuring. Genes are NOT linked. The alternative hypothesis any change from the expected is due to SOME OUTSIDE FORCE! To IT IS NOT RANDOM! THE GENES COULD BELINKED! figure which hypothesis is accepted, you need to use the CHI SQUARE TABLE, which list CRITICAL VALUES!
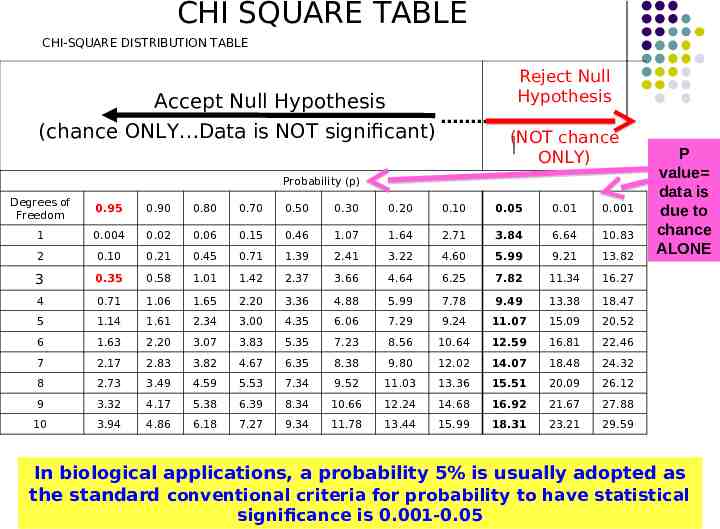
CHI SQUARE TABLE CHI-SQUARE DISTRIBUTION TABLE Reject Null Hypothesis Accept Null Hypothesis (chance ONLY Data is NOT significant) (NOT chance ONLY) Probability (p) Degrees of Freedom 0.95 0.90 0.80 0.70 0.50 0.30 0.20 0.10 0.05 0.01 0.001 1 0.004 0.02 0.06 0.15 0.46 1.07 1.64 2.71 3.84 6.64 10.83 2 0.10 0.21 0.45 0.71 1.39 2.41 3.22 4.60 5.99 9.21 13.82 3 0.35 0.58 1.01 1.42 2.37 3.66 4.64 6.25 7.82 11.34 16.27 4 0.71 1.06 1.65 2.20 3.36 4.88 5.99 7.78 9.49 13.38 18.47 5 1.14 1.61 2.34 3.00 4.35 6.06 7.29 9.24 11.07 15.09 20.52 6 1.63 2.20 3.07 3.83 5.35 7.23 8.56 10.64 12.59 16.81 22.46 7 2.17 2.83 3.82 4.67 6.35 8.38 9.80 12.02 14.07 18.48 24.32 8 2.73 3.49 4.59 5.53 7.34 9.52 11.03 13.36 15.51 20.09 26.12 9 3.32 4.17 5.38 6.39 8.34 10.66 12.24 14.68 16.92 21.67 27.88 10 3.94 4.86 6.18 7.27 9.34 11.78 13.44 15.99 18.31 23.21 29.59 P value data is due to chance ALONE In biological applications, a probability 5% is usually adopted as the standard conventional criteria for probability to have statistical significance is 0.001-0.05
Significant?