TWU 234 Wage Increases Pattern wage increases — $1,250 lump
22 Slides3.78 MB
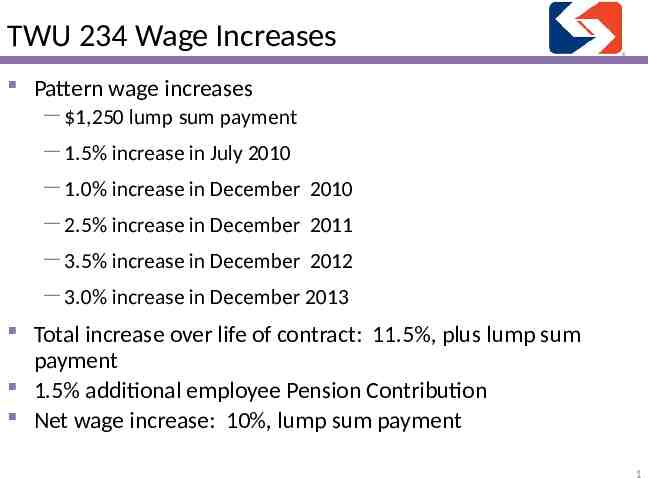
TWU 234 Wage Increases Pattern wage increases — 1,250 lump sum payment — 1.5% increase in July 2010 — 1.0% increase in December 2010 — 2.5% increase in December 2011 — 3.5% increase in December 2012 — 3.0% increase in December 2013 Total increase over life of contract: 11.5%, plus lump sum payment 1.5% additional employee Pension Contribution Net wage increase: 10%, lump sum payment 1
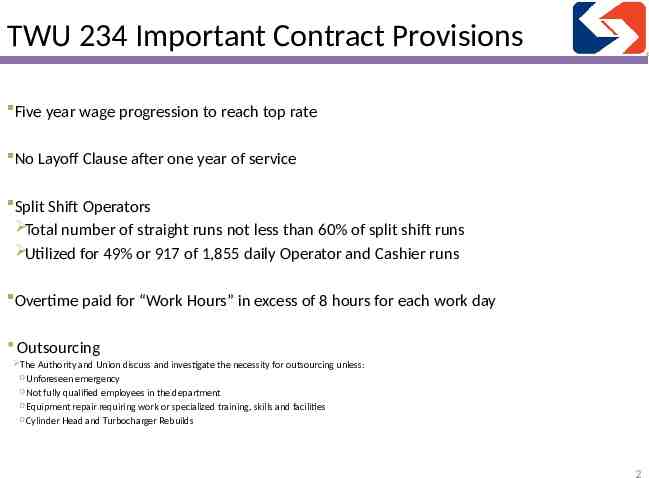
TWU 234 Important Contract Provisions Five year wage progression to reach top rate No Layoff Clause after one year of service Split Shift Operators Total number of straight runs not less than 60% of split shift runs Utilized for 49% or 917 of 1,855 daily Operator and Cashier runs Overtime paid for “Work Hours” in excess of 8 hours for each work day Outsourcing The Authority and Union discuss and investigate the necessity for outsourcing unless: o Unforeseen emergency o Not fully qualified employees in the department o Equipment repair requiring work or specialized training, skills and facilities o Cylinder Head and Turbocharger Rebuilds 2
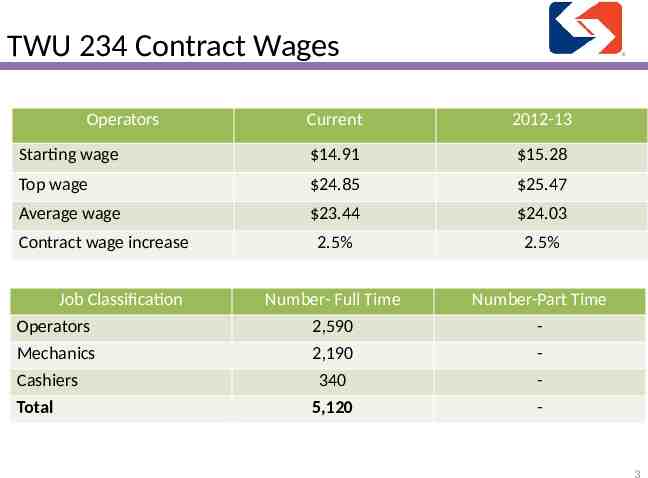
TWU 234 Contract Wages Operators Current 2012-13 Starting wage 14.91 15.28 Top wage 24.85 25.47 Average wage 23.44 24.03 2.5% 2.5% Number- Full Time Number-Part Time Operators Mechanics 2,590 2,190 - Cashiers Total 340 5,120 - Contract wage increase Job Classification 3
9. Healthcare
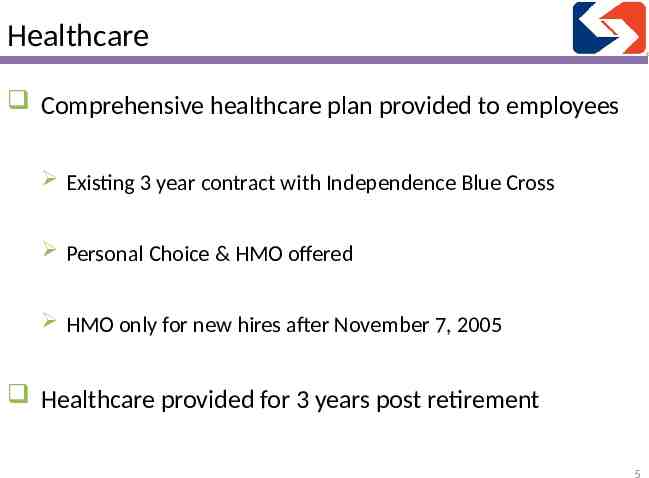
Healthcare Comprehensive healthcare plan provided to employees Existing 3 year contract with Independence Blue Cross Personal Choice & HMO offered HMO only for new hires after November 7, 2005 Healthcare provided for 3 years post retirement 5
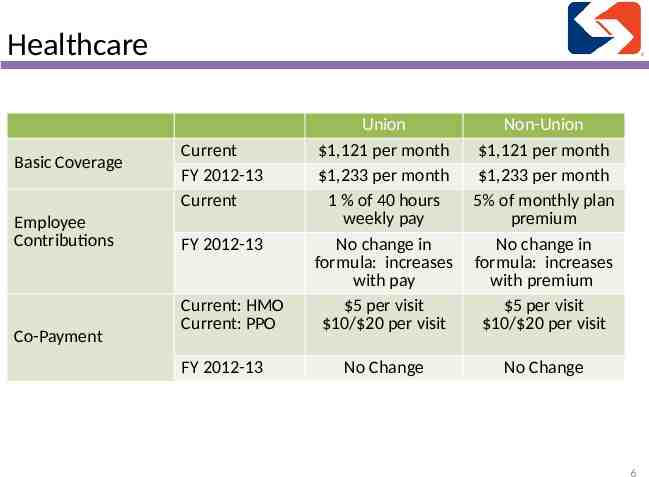
Healthcare Basic Coverage Employee Contributions Co-Payment Current FY 2012-13 Current FY 2012-13 Current: HMO Current: PPO FY 2012-13 Union 1,121 per month 1,233 per month 1 % of 40 hours weekly pay No change in formula: increases with pay 5 per visit 10/ 20 per visit Non-Union 1,121 per month 1,233 per month 5% of monthly plan premium No change in formula: increases with premium 5 per visit 10/ 20 per visit No Change No Change 6
10. Pension Overview
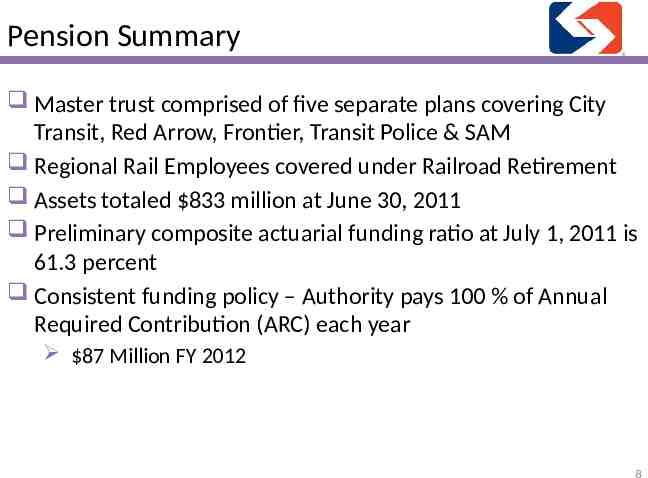
Pension Summary Master trust comprised of five separate plans covering City Transit, Red Arrow, Frontier, Transit Police & SAM Regional Rail Employees covered under Railroad Retirement Assets totaled 833 million at June 30, 2011 Preliminary composite actuarial funding ratio at July 1, 2011 is 61.3 percent Consistent funding policy – Authority pays 100 % of Annual Required Contribution (ARC) each year 87 Million FY 2012 8
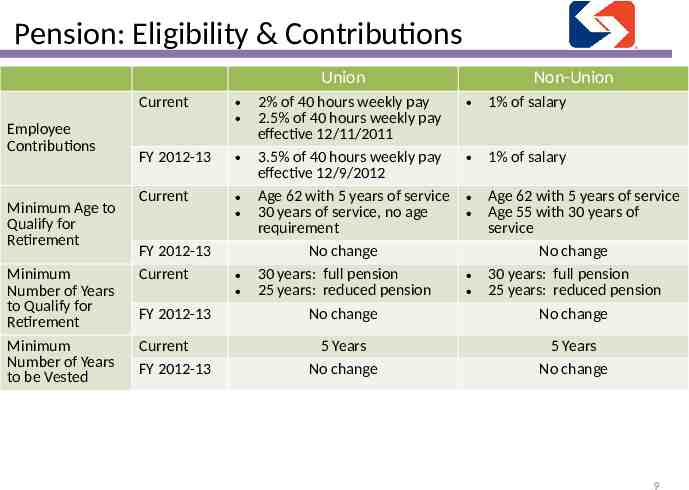
Pension: Eligibility & Contributions Union Employee Contributions Minimum Age to Qualify for Retirement Minimum Number of Years to Qualify for Retirement Minimum Number of Years to be Vested Current FY 2012-13 Current FY 2012-13 Current FY 2012-13 Current FY 2012-13 2% of 40 hours weekly pay 2.5% of 40 hours weekly pay effective 12/11/2011 3.5% of 40 hours weekly pay effective 12/9/2012 Age 62 with 5 years of service 30 years of service, no age requirement No change 30 years: full pension 25 years: reduced pension No change 5 Years No change Non-Union 1% of salary 1% of salary Age 62 with 5 years of service Age 55 with 30 years of service No change 30 years: full pension 25 years: reduced pension No change 5 Years No change 9
Strategy To Improve Pension Funding Levels Minimize unfunded enhancements to existing Plan benefits Revised strategic asset allocation in 2011 to reduce volatility and achieve desired growth rate Change Fund Managers 10
11. Diesel Fuel
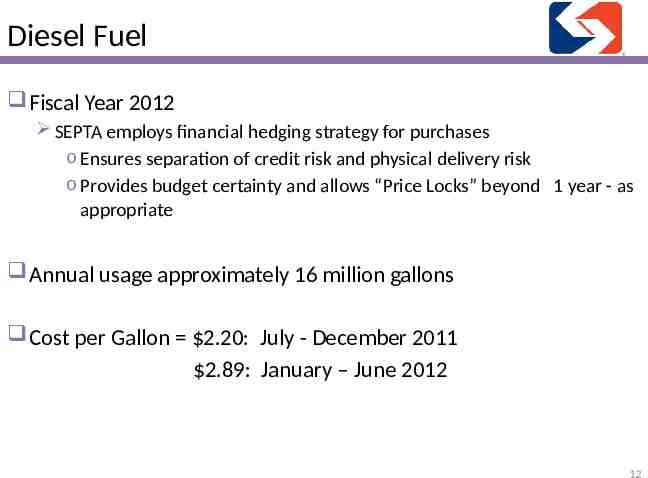
Diesel Fuel Fiscal Year 2012 SEPTA employs financial hedging strategy for purchases o Ensures separation of credit risk and physical delivery risk o Provides budget certainty and allows “Price Locks” beyond 1 year - as appropriate Annual usage approximately 16 million gallons Cost per Gallon 2.20: July - December 2011 2.89: January – June 2012 12
12. SEPTA Passenger Revenue
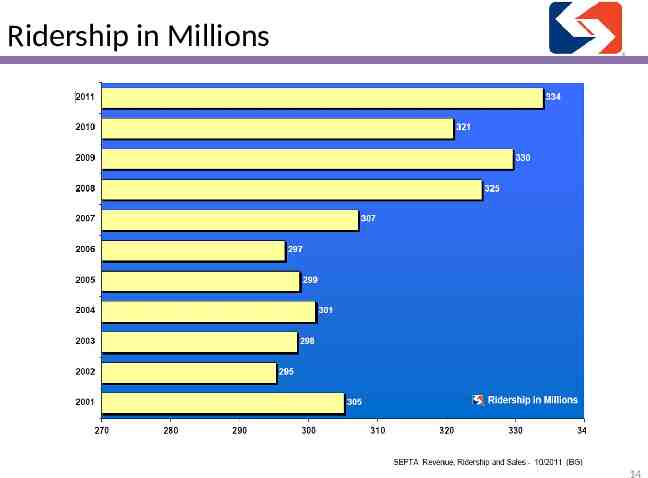
Ridership in Millions 14
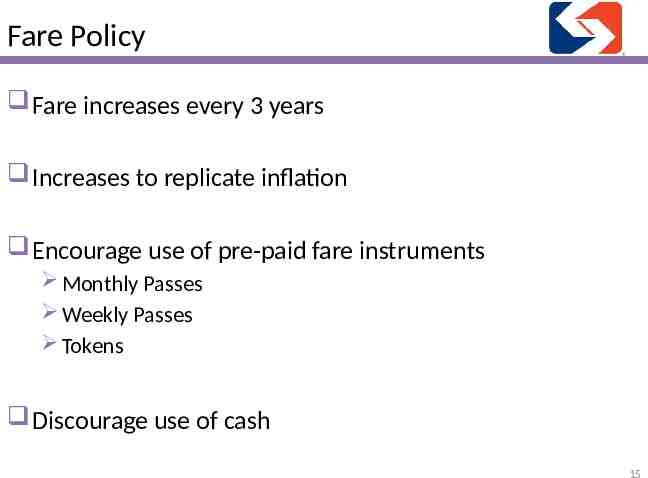
Fare Policy Fare increases every 3 years Increases to replicate inflation Encourage use of pre-paid fare instruments Monthly Passes Weekly Passes Tokens Discourage use of cash 15
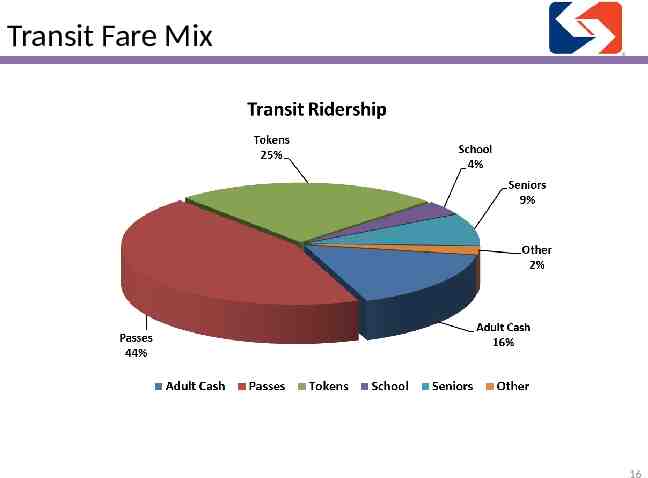
Transit Fare Mix 16
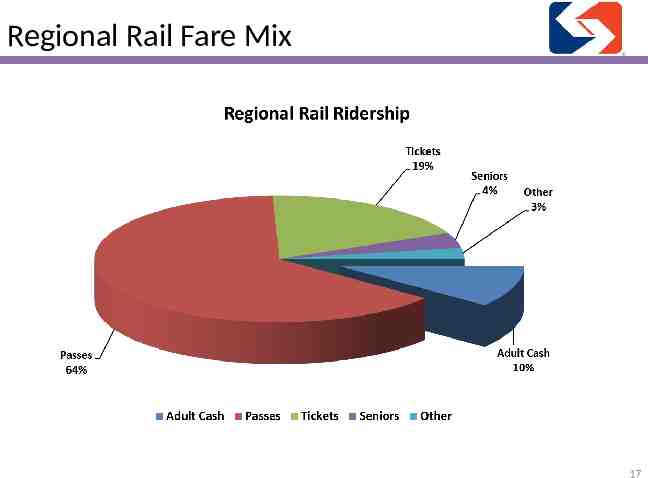
Regional Rail Fare Mix 17
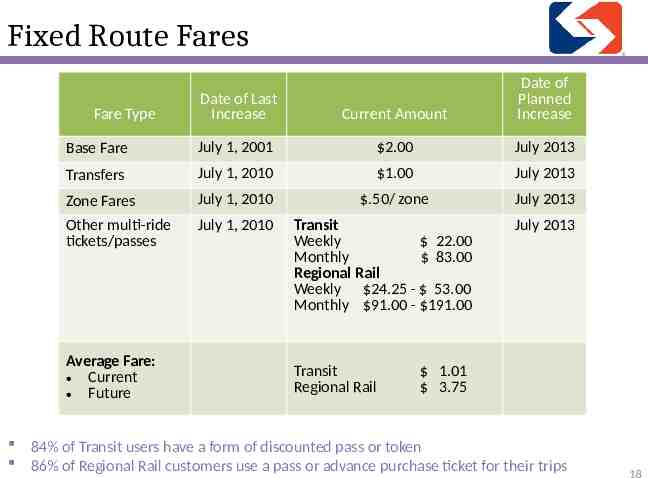
Fixed Route Fares Date of Last Increase Current Amount Date of Planned Increase Base Fare July 1, 2001 2.00 July 2013 Transfers July 1, 2010 1.00 July 2013 Zone Fares July 1, 2010 .50/ zone July 2013 Other multi-ride tickets/passes July 1, 2010 Fare Type Average Fare: Current Future Transit Weekly 22.00 Monthly 83.00 Regional Rail Weekly 24.25 - 53.00 Monthly 91.00 - 191.00 Transit Regional Rail July 2013 1.01 3.75 84% of Transit users have a form of discounted pass or token 86% of Regional Rail customers use a pass or advance purchase ticket for their trips 18
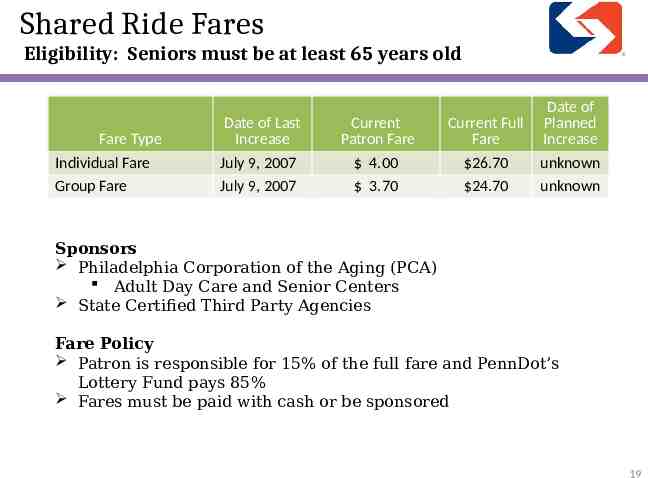
Shared Ride Fares Eligibility: Seniors must be at least 65 years old Fare Type Individual Fare Group Fare Date of Last Increase Current Patron Fare Current Full Fare Date of Planned Increase July 9, 2007 July 9, 2007 4.00 3.70 26.70 24.70 unknown unknown Sponsors Philadelphia Corporation of the Aging (PCA) Adult Day Care and Senior Centers State Certified Third Party Agencies Fare Policy Patron is responsible for 15% of the full fare and PennDot’s Lottery Fund pays 85% Fares must be paid with cash or be sponsored 19
13. Major Factors Producing Cost Increases
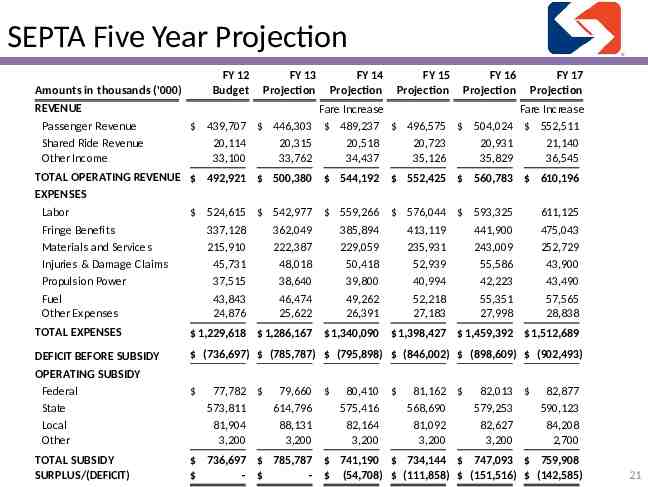
SEPTA Five Year Projection FY 12 Budget Amounts in thousands ('000) REVENUE Passenger Revenue Shared Ride Revenue Other Income FY 13 Projection FY 14 Projection FY 15 Projection FY 16 Projection FY 17 Projection Fare Increase Fare Increase 439,707 446,303 489,237 496,575 504,024 552,511 20,114 20,315 20,518 20,723 20,931 21,140 33,100 33,762 34,437 35,126 35,829 36,545 TOTAL OPERATING REVENUE 492,921 500,380 544,192 552,425 560,783 610,196 EXPENSES Labor Fringe Benefits Materials and Services Injuries & Damage Claims Propulsion Power Fuel Other Expenses 524,615 542,977 559,266 576,044 593,325 337,128 362,049 385,894 413,119 441,900 215,910 222,387 229,059 235,931 243,009 45,731 48,018 50,418 52,939 55,586 37,515 38,640 39,800 40,994 42,223 43,843 46,474 49,262 52,218 55,351 24,876 25,622 26,391 27,183 27,998 611,125 475,043 252,729 43,900 43,490 57,565 28,838 TOTAL EXPENSES 1,229,618 1,286,167 1,340,090 1,398,427 1,459,392 1,512,689 DEFICIT BEFORE SUBSIDY (736,697) (785,787) (795,898) (846,002) (898,609) (902,493) OPERATING SUBSIDY Federal State Local Other TOTAL SUBSIDY SURPLUS/(DEFICIT) 77,782 79,660 80,410 81,162 82,013 82,877 573,811 614,796 575,416 568,690 579,253 590,123 81,904 88,131 82,164 81,092 82,627 84,208 3,200 3,200 3,200 3,200 3,200 2,700 736,697 785,787 741,190 734,144 747,093 759,908 - - (54,708) (111,858) (151,516) (142,585) 21
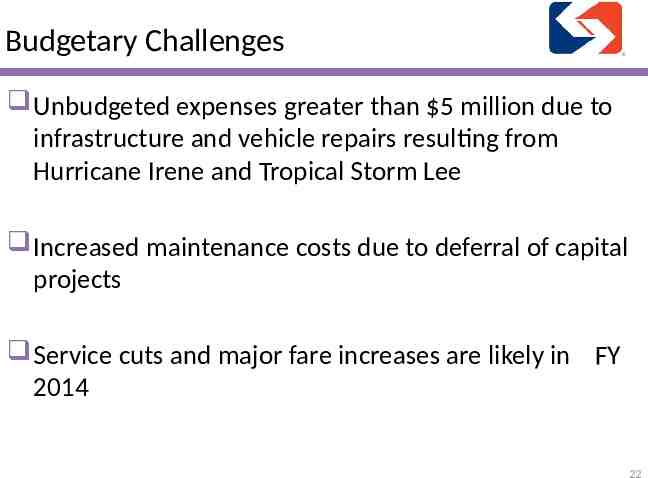
Budgetary Challenges Unbudgeted expenses greater than 5 million due to infrastructure and vehicle repairs resulting from Hurricane Irene and Tropical Storm Lee Increased maintenance costs due to deferral of capital projects Service cuts and major fare increases are likely in FY 2014 22