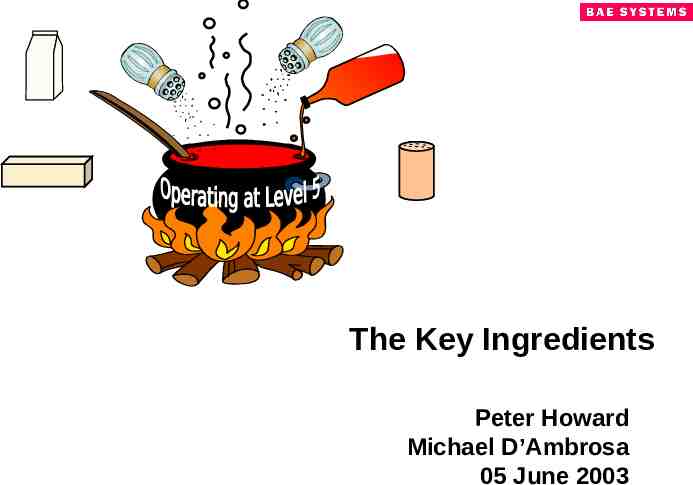
The Key Ingredients Peter Howard Michael D’Ambrosa 05 June 2003


37 Slides4.62 MB
The Key Ingredients Peter Howard Michael D’Ambrosa 05 June 2003
Acknowledgement & Scope This presentation is a shortened version of a keynote presentation Pete Howard – CNIR’s Director of Software Engineering –presented at the European SEPG Conference Although the slides focus on software and the SWCMM model, the principles are easily extendible to other engineering disciplines and the CMMI
A Worthwhile Journey to Improve Software Capability Level 4/5 Health Check 240 Level 4/5 Assessment Level 3 Assessment 220 Level 5 Level 4 Level 3 Health Check 200 Reassess CMM Key Practices 180 Reassess 160 2 Years 140 120 100 80 SPI Plan 3.5 Years SPI (77%of Impl Level 2) 60 40 20 0 J S D M J S D M J S D M J S D M J S D M J S D M J S D M J CY02 CY95 CY96 CY97 CY98 CY99 CY00 CY01 Level 2
Standardized Quantitative Mgmt Defect Prevention Mgmt Learning & Sharing Mgmt Robust Risk Management Organization-wide Continuous Process Improvement Or ga n Im Per izati pro for on vem ma -wi en nce de tG oa ls Improved Customer Satisfaction & Recognition Low-Risk Technology Insertion Improved Employee Satisfaction Improved Results
Standardized Quantitative Mgmt Defect Prevention Mgmt Learning & Sharing Mgmt Robust Risk Management Organization-wide Continuous Process Improvement Or ga Im Per nizat pro fo ion ve rma -w me nc ide nt e Go als Improved Customer Satisfaction & Recognition Low-Risk Technology Insertion Improved Employee Satisfaction Improved Results
CNI Defect Reduction Improvement 9% C3I Inertial Programs Programs Business General DEFECT Development Counsel REDUCTION IMPROVEMENT 9% Human Engineering Operations Contracts Finance Engineering Capture 70% defects, by phase, prior to test Reduce design review action item closure time and number of items Operations Resources Achieve 5.35 Sigma workmanship
Cycle Time Improvement 9% 2003 Engineering Goal 1) For Systems/Hardware CT – propose methods for baseline, measurement, and reduction. Goal is to improve 9% 2) Reduce the number of systems undefined requirements at time of system review. Goal is to achieve 5%. 3) Reduce number of unfunded requirements. Goal is to achieve zero. 2003 Software Engineering Goal 1) Reduce software development cost by 6% in 2003, and another 6% in 2004 through the implementation of continuous process improvement activities. 2) Have no customer unfunded project requirements.
Defect Reduction Improvement 9% 2003 Engineering Goal 1) For requirements and design reviews, reduce the number of action items and reduce AI closure time to within 30 days, while achieving best balance with program schedule and cost. 2) Reduce the number of hardware design changes and improve escaping defect profile (systems requirements, design, build, test phases) to capture defects earlier in the life cycle. Goal is to detect 70% of defects prior to test. 3) Eliminate 80% of the software defects prior to software integration test. 4) Reduce number of software defects via root cause analysis. 5) Reduce number of post-delivery design defects. Goal is zero defects. 2003 Software Engineering Goal 1) Maintain number of post delivery defects to 0.5 defects/1000 SLOC. 2) Detect 80% of defects prior to software integration test.
Customer Satisfaction Improvement 3% 2003 Engineering Goal 1) For Internal Customer Satisfaction: a) Reduce the corrective action closure time to 30 days. b) Reduce the number of corrective actions by 10%. 2) Improve percentage of Customer deliveries accomplished on time. Goal is 100%. 3) Perform within 5% of cost estimates (CPI). 2003 Software Engineering Goal 1) Maintain on-time deliveries at 95% or higher. 2) Achieve Internal Customer Satisfaction Report (ICSR) Rating of 4.2 and close all Corrective Action Requests (CARs) within 30 days. 3) Perform within /-5% of cost estimates. 4) Maintain average of 40 hours of training per software engineer.
Double the 9% Annual Growth Rate Through Strategic Initiatives 2003 Engineering Goal 2003 Software Engineering Goal 1) Leverage IRAD over multi programs for 25% savings through technical synergy and common investment. 1) Develop DO-178B capability to support future Avionics Programs. 2) Increased number of technical pursuit leads to support initiatives. 2) Maintain SEI CMM Level 5 3) Show increased coupling of CRAD to IRAD investment. 3) Leverage Link-16 OOA/OOD IRAD activity into New Business opportunities. 4) Identify at least 3 advantages using other BAE technology. 4) Grow C4ISR business opportunities. 5) Conduct SEI CMMI L3 in 2003. 5) Develop additional supervisory capability and new business project leads in software engineering 6) Maintain SEI CMM Level 5 throughout 2003. 6) Support SEI CMMI L3 in 2003.
Standardized Quantitative Mgmt Defect Prevention Mgmt Learning & Sharing Mgmt Robust Risk Management Organization-wide Continuous Process Improvement Or ga n P Im er izati pro for on vem ma -wid en nce e tG oa ls Improved Customer Satisfaction & Recognition Low-Risk Technology Insertion Improved Employee Satisfaction Improved Results
Organization-Wide Continuous Process Improvement Coordinated by the Executive Staff Organization performance improvement goals established for all disciplines and flowed down into the organization Connection between Organization Improvement Goals and Project Improvement Goals and individual goals PACE Board is the Performance / Process Improvement focal point and coordinating body for the Executive Staff Multi-disciplined Management Steering Groups in all disciplines All personnel at all levels participate in continuous improvement Monthly review of Process Improvement Initiatives, Current Monthly review of Process Improvement Initiatives, Current Monthly review Processconnects Improvement Initiatives, Current Business and New of Business improvement goals to Business and Business andNew NewBusiness Businessconnects connectsimprovement improvementgoals goalsto to project performance project projectperformance performance – Focus is on performance improvement, not individual blame
PACE Board Function Performance / Process Improvement focal point and coordinating body for the Executive Staff – Comprised of senior level cross functional members Ensure that continuous improvement methodologies are implemented across all business processes. Ensure coordination and cooperation across functional boundaries for all improvement initiatives. Monthly PACE Reviews by the Executive Staff – Agenda reviews organizational progress against performance improvement goals
Robust Risk Management Organization-wide Continuous Process Improvement Standardized Quantitative Mgmt Defect Prevention Mgmt Learning & Sharing Mgmt Or ga n P Im er izati pro for on vem ma -wid en nce e tG oa ls Improved Customer Satisfaction & Recognition Low-Risk Technology Insertion Improved Employee Satisfaction Improved Results
Standardized Quantitative Management Linked to organizational goals Project and Process measurements Provides accurate quantitative knowledge of organizational capabilities – Accurate estimates on future opportunities – Quantitative insight to areas of improvement (i.e., via training, process, or technology)
Project Measurements Cost Performance Indicator (CPI) cumulative SLOC growth current Requirements Stability Schedule Performance Indicator (SPI) cumulative Peer Review number held vs planned Source Lines of Code (SLOC) growth cumulative Defect Density for Code Peer Review (Fagan inspection) Estimate at Completion (EAC) stability RAM usage projected vs. budget EAC vs Budget CPI vs To Complete Performance Index (TCPI) ROM usage projected vs. budget CPU usage projected vs. budget
Process Measurements Fagan Inspection Effectiveness – Defects per inspection Escaping defects profiles Productivity % Defects Detected Prior to Test Training Hours per Employee Internal and External Customer Satisfaction Employee Satisfaction OSSP Software Update Requests Defect Prevention Causal Analysis Status Technology Change Management Status Quality Process Audits
Standardized Quantitative Mgmt Defect Prevention Mgmt Learning & Sharing Mgmt Robust Risk Management Organization-wide Continuous Process Improvement Or ga n P Im er izati pro for on vem ma -wid en nce e tG oa ls Improved Customer Satisfaction & Recognition Low-Risk Technology Insertion Improved Employee Satisfaction Improved Results
Robust Risk Management Process Pervasive use of Early Warning Indicators (EWIs) by: – Programs – Systems Engineering – Software Engineering Avoids missed deliveries via early risk mitigation Augments risk identification / mitigation processes
EWIs - Programs Project CPI SPI Margin Contingency Sales (Cum-to-date) Sales (Forcast/Year) Risk Opportunity Technical Contracts Customer Satisfaction Improvement Goals Process IPT Phase Review EWI Defects Inspection Test Yields Prevention Cycle-time EVMS Proposals 1 2 3 4 5 6 7 8 9 G Y G Y G G G Y G G G G G G B B B B B B G G B B Y R R B G B B B G B G B G G G Y B B Y B R B B G G G B G B G G G G G G G Y G G G Y G Y G G G Y Y G G B G B Y R G G G Y Y G G B G Y Y N/A G Y P Y N/A B G G G B G G G Y G Y Y G G G G G B G Y G G G G G G G G Y G G G G G G G G G Y G G G G G G G G Y Y Y G Y Y G Y G G G G B B G N/A B B B G G N/A Monthly Monthlyprogram programreview review integrates integratesproject projectperformance, performance, process processadherence, adherence,and and organizational organizationalimprovement improvementY G goals goals G G G G G G G B G G G N/A G G G G G
EWIs - Systems Engineering System Early Warning Indicators Current Status Previous Status CPI cumulative* (Project Current Month) Yellow Yellow Systems indicators are derived Systems indicators are derived EAC versus budget in % * (100* EAC/Budget) Green Green from the standardized project from the standardized SPI cumulative* (Project Current Month) Yellowproject Yellow metrics EAC Stability *. No growth in (EAC-Budget) over previous months. metrics Blue Blue Percent planned staffing, and project related experience in place. Blue Red Status of resources relative to plan. Green Yellow Percent of all system requirements defined todate Green Yellow Percent of acceptance criteria defined todate Green Yellow Requirements/Acceptance criteria impact to Cost and Schedule Green Yellow How well does current system design meet all system requirements? Green Green Percent of added, deleted, clarified/modified requirements since SR Blue Blue Percent of total non funded changes in requirements Blue Blue DPI current estimate Green Green DPI projected at project completion Green Green Total number of Design, Fagan. Peer reviews held versus planned. Green Green How well do current product DPI projections meet product plan? Green Green
EWIs - Software Engineering Critical Factors CPI cumulative SPI cumulative SLOC growth: cumulative EAC Stability: No growth in EAC over previous months EAC versus Budget CPI versus TCPI SLOC growth: current period Percent of total unfunded changes in requirements Plan for Early Detection of Defects Defect Tracking (defect detection and coverage) RAM usage: projected versus budget ROM usage: projected versus budget CPU usage: projected versus budget Quantitative Management Status Defect Prevention Activity Status Current Status Previous Status Comments Contract mods to include additional functionality in process; will return to green in 2 months. indicators YellowSoftware Yellow Same. Software indicatorsare arederived derived Green from Green the from thestandardized standardizedproject project Green Yellow Stable for 5 months metrics metrics Contract mods to include additional functionality Yellow Yellow in process; will return to green in 2 months. Blue Blue CPI current period 1.31 Green Green Green Green Green Green Recovering inspection schedule via replanning Yellow Red and focusing on highest complexity code. Blue Blue Estimated 21% usage vs 50% requirement Blue Blue Estimated 25% usage vs 50% requirement Blue Blue Estimated 57% usage vs 75% requirement Blue Blue No Quantitative Management issues Root cause analysis meetings and resulting Blue Green actions are being conducted according to plan. Yellow Yellow
Standardized Quantitative Mgmt Defect Prevention Mgmt Learning & Sharing Mgmt Robust Risk Management Organization-wide Continuous Process Improvement Or ga n P Im er izati pro for on vem ma -wid en nce e tG oa ls Improved Customer Satisfaction & Recognition Low-Risk Technology Insertion Improved Employee Satisfaction Improved Results
Defect Prevention Management Reduced defect insertion and early “left-shift” detection – Fagan Inspection Process in all phases Root-Cause Analysis and corrective action Reduced costs and avoidance of repeating mistakes
Escaping Defects / Early Defect Detection % Defects Found Prior to Integration & Test 93.6 % 62 Integration & Test Code/Unit Test 605 56 32 Design 11 6.4% Requirements 194 0 14 100 200 300 400 # Defects Detected 500 600 700 800 # Defects Escaping Integration & Test Code/Unit Test 77 4 Design 26 Requirements 0 10 20 30 40 50 # of Fagan Inspections 60 70 80 90 100
Standardized Quantitative Mgmt Defect Prevention Mgmt Learning & Sharing Mgmt Robust Risk Management Organization-wide Continuous Process Improvement Or ga n P Im er izati pro for on vem ma -wid en nce e tG oa ls Improved Customer Satisfaction & Recognition Low-Risk Technology Insertion Improved Employee Satisfaction Improved Results
Low Risk Technology Insertion On-going technology evaluations and pilots result in low risk technology insertion Technology Insertion Review Board – Multi-disciplined team including: Software, Systems, Programs, & Operations – Coordinate & draft Software Technology Insertion Plan based on MSG, Engineering Technology Board, & Strategic Business Plan input. – Facilitate the identification, evaluation, & introduction of new technologies which improve quality, increase productivity and/or decrease cycle time. – Maintain a Technology Change Management (TCM) database & library. – Serve as focal point for coordination of software technology change & insertion activities with other BAE SYSTEMS’ companies. – Conducts pilots & issues technology reports; issues monthly technology newsletter; evaluates entries for Lessons Learned.
TCM Examples Selection of PC-lint as code analysis tool – CodeWizard to enforce coding conventions Evaluation of Insure for memory leakage detection Initiated introduction of DOORS, DocExpress. – Connecting with PVCS Introduced NT version & web-based PVCS Generation of 20 pilot plans for various tools and operating systems Evaluation of COTS OS vendors
Standardized Quantitative Mgmt Defect Prevention Mgmt Learning & Sharing Mgmt Robust Risk Management Organization-wide Continuous Process Improvement Or ga n P Im er izati pro for on vem ma -wid en nce e tG oa ls Improved Customer Satisfaction & Recognition Low-Risk Technology Insertion Improved Employee Satisfaction Improved Results
Learning & Sharing Management Robust Training Program – – Lessons Learned meetings (Learning from Experience) and databases – – – – – – – Meets needs of Organization, project, and employee Training is considered a high priority Fagan Inspections are a learning experience and reduce defect insertion Defect Prevention Causal Analysis Results Technology Insertion Board recommendations Lessons Learned sessions at the end of each project phase Contribute to the database Retrieve from the database Robust Lessons Learned Database Search by Project, Project Phase, keyword Best Practices Artifacts Continually updated OSSP residing on website Level 5 infrastructure greatly enhances assimilation of new personnel – 30% growth in the last 1.5 years while continuing to sustain performance improvement 3
Standardized Quantitative Mgmt Defect Prevention Mgmt Learning & Sharing Mgmt Robust Risk Management Organization-wide Continuous Process Improvement Or ga n P Im er izati pro for on vem ma -wid en nce e tG oa ls Improved Customer Satisfaction & Recognition Low-Risk Technology Insertion Improved Employee Satisfaction Improved Results 3
Improved Customer Satisfaction & Recognition Enhanced Customer Satisfaction – – Level 5 companies are preferred suppliers – Level 3 (minimum) required for major DOD programs Improved accuracy and estimates resulting in on-cost, schedule, quality, and functional deliveries External Customer Satisfaction improved 9% in the past year resulting in major new contract awards Improved Customer Recognition – – – Level 5 is in the top 2% of 645 US assessed companies; 5.3% Level 4 and 22% Level 3 Level 5 is in the top 3.9% of 280 DoD / Federal contractors; 8.9% Level 4 and 37.1% Level 3 Customers recognize Level 5 as world-class benchmark performance Internal Customer Satisfaction improved 5% in the past year which exceeded the 3% improvement goal 3
Standardized Quantitative Mgmt Defect Prevention Mgmt Learning & Sharing Mgmt Robust Risk Management Organization-wide Continuous Process Improvement Or ga n P Im er izati pro for on vem ma -wid en nce e tG oa ls Improved Customer Satisfaction & Recognition Low-Risk Technology Insertion Improved Employee Satisfaction Improved Results 3
Improved Employee Satisfaction “People like being in a company that is striving to be World Class” “I enjoy being with my family on the weekend prior to a formal customer qualification test” “The Fagan process is really saving us integration time” “Management is modeling the behavior for the company” “I am proud to meet our customer milestones consistently” 3
Standardized Quantitative Mgmt Defect Prevention Mgmt Learning & Sharing Mgmt Robust Risk Management Organization-wide Continuous Process Improvement Or ga n P Im er izati pro for on vem ma -wid en nce e tG oa ls Improved Customer Satisfaction & Recognition Low-Risk Technology Insertion Improved Employee Satisfaction Improved Results 3
Performance Improvement Level 2 Performance 1.4 Level 3 Level 5 1.2 1.0 0.8 0.6 1996 1997 1998 Productivity: Cost: Schedule: 1999 2000 2001 2002 ‘99 - ’02 16% Improvement ‘99 - ’02 26% Improvement ‘98 - ’02 33% Improvement 3
Contact Information Michael D’Ambrosa BAE SYSTEMS - CNIR Division 164 Totowa Road / P.O. BOX 975 Wayne, New Jersey 07474-0975 Mail Code: 11B28 (973) 633-6080 [email protected] 3