Forest Inventory and Analysis Program: Trends for Georgia’s
22 Slides2.66 MB
Forest Inventory and Analysis Program: Trends for Georgia’s Forest Land – 2016 FIA Data Created by: David Dickinson FIA Coordinator for Georgia [email protected] David Dickinson FIA Coordinator Georgia Forestry Commission PO Box 819 Using Evalidator Version 1.8.0.00 found at: https://apps.fs.usda.gov/Evalidator/evalidator.jsp Macon, GA 31202
Forest Inventory and Analysis, Georgia FIA facts and history The Forest Inventory and Analysis (FIA) Program is a cooperative program between the U.S. Forest Service and the states to provide estimates of the condition of the forest and forest trend data A forest inventory was mandated as necessary by the U.S. Congress in the 1930’s in order to provide status updates of the United States’ forest resources The data can: Indicate if forest resources are being managed sustainably Indicate trends such as gains or losses of forest acreage, the species David Dickinson composition of our forest, the age/quantity/quality of the timber FIA Coordinator resources and the health of our forests. Georgia Forestry Commission Data are collected on research plots across the state on public and private PO Box 819 land Macon, GA 31202 Landowners have the opportunity to deny access to their property at any time
Forest Inventory and Analysis, Georgia FIA in Georgia Georgia assumed data collection responsibilities from U.S. Forest Service in 1998 All data are given back to the USFS for compilation/analysis FIA is a 75% federally funded grant with 25% of funds matched by states with 5 year cycles We currently have 12 foresters collecting FIA data across Georgia All foresters on the FIA team in Georgia have degrees in forestry and are tested and certified prior to collecting data in order to maintain data integrity All data, once compiled, is made available to the public at www.fia.fs.fed.us/tools-data and through publications such as Forest Factsheets and this powerpoint on the Georgia Forestry Commission website No individual landowner information from the FIA Plots is made public in order to protect privacy
Forest Inventory and Analysis, Georgia Why is a Forest Inventory Needed? Without a forest inventory there is no scientific source for the trends of our forests – provides consistent metrics over time Without a forest inventory, forestry decisions in our agency, the state government and the federal government are made based on feelings and popular opinion instead of numbers Our numbers give forest industry the necessary information to decide to locate new wood using facilities here in Georgia – new mills new jobs putting Georgians to work FIA gives us the opportunity to correct undesirable forest trends before it is too late FIA data are based on ground measurements and provide a ground truth for satellite imagery tools to test against and improve over time. Nothing replaces boots on the ground.
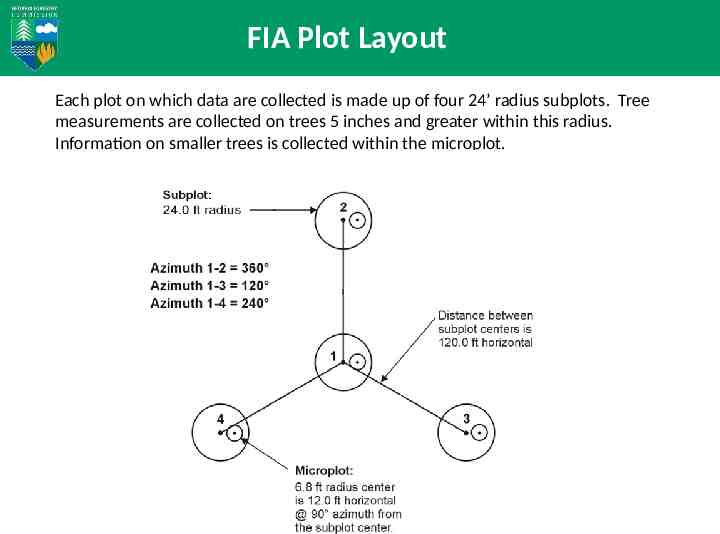
FIA Plot Layout Each plot on which data are collected is made up of four 24’ radius subplots. Tree measurements are collected on trees 5 inches and greater within this radius. Information on smaller trees is collected within the microplot.
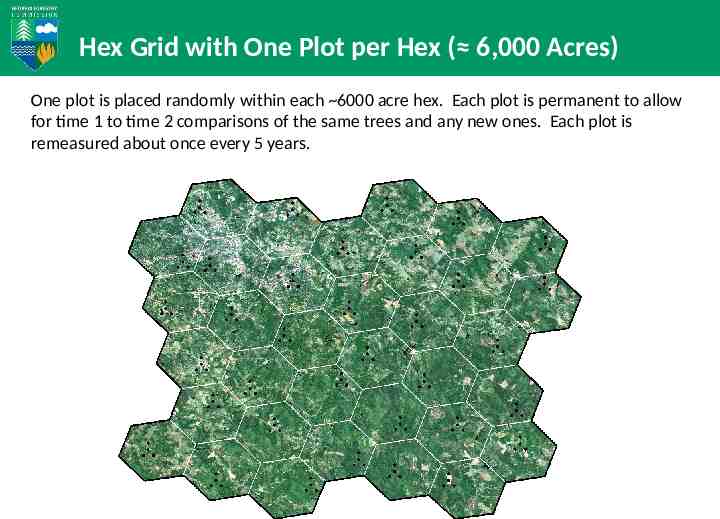
Hex Grid with One Plot per Hex ( 6,000 Acres) One plot is placed randomly within each 6000 acre hex. Each plot is permanent to allow for time 1 to time 2 comparisons of the same trees and any new ones. Each plot is remeasured about once every 5 years.
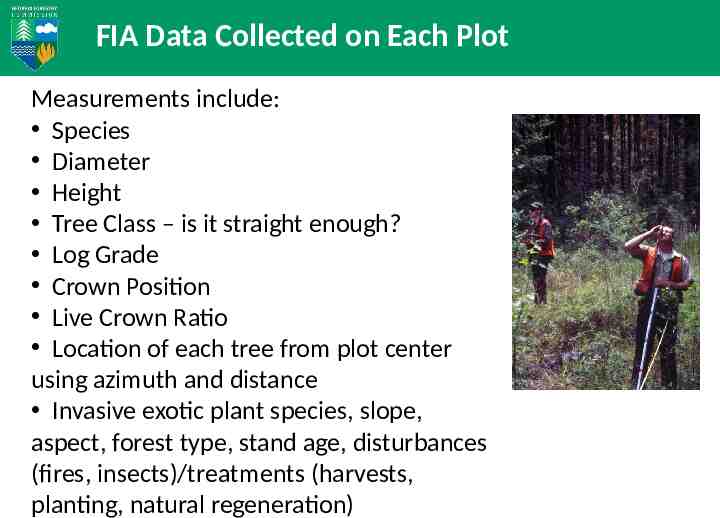
FIA Data Collected on Each Plot Measurements include: Species Diameter Height Tree Class – is it straight enough? Log Grade Crown Position Live Crown Ratio Location of each tree from plot center using azimuth and distance Invasive exotic plant species, slope, aspect, forest type, stand age, disturbances (fires, insects)/treatments (harvests, planting, natural regeneration)
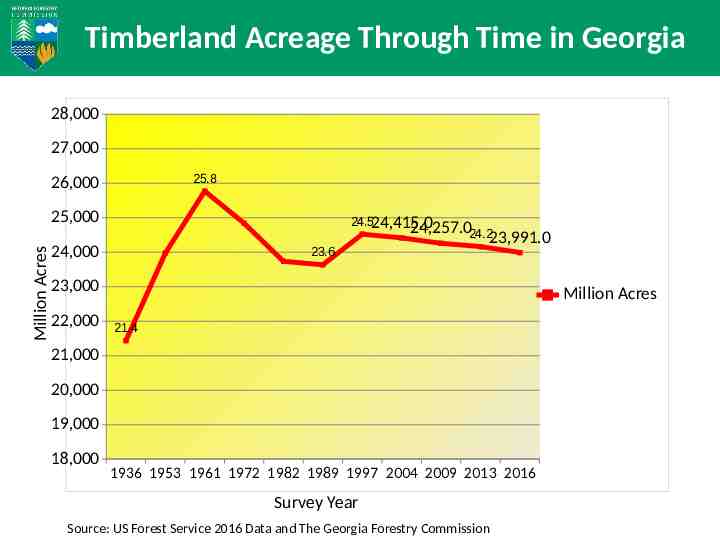
Timberland Acreage Through Time in Georgia 28,000 27,000 25.8 26,000 Million Acres 25,000 24.524,415.0 24,000 23.6 24,257.024.2 23,991.0 23,000 22,000 Million Acres 21.4 21,000 20,000 19,000 18,000 1936 1953 1961 1972 1982 1989 1997 2004 2009 2013 2016 Survey Year Source: US Forest Service 2016 Data and The Georgia Forestry Commission
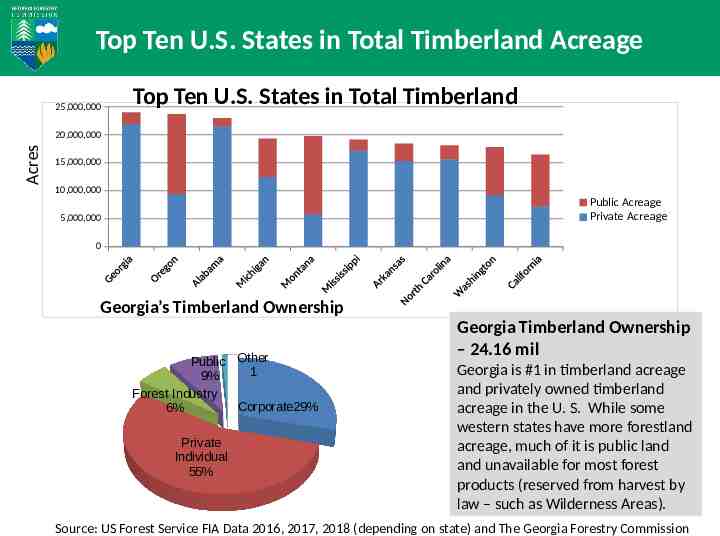
Top Ten U.S. States in Total Timberland Acreage 25,000,000 Top Ten U.S. States in Total Timberland Acres 20,000,000 15,000,000 10,000,000 Public Acreage Private Acreage 5,000,000 0 Georgia’s Timberland Ownership Public Other 1 9% Forest Industry Corporate29% 6% Private Individual 55% Georgia Timberland Ownership – 24.16 mil Georgia is #1 in timberland acreage and privately owned timberland acreage in the U. S. While some western states have more forestland acreage, much of it is public land and unavailable for most forest products (reserved from harvest by law – such as Wilderness Areas). Source: US Forest Service FIA Data 2016, 2017, 2018 (depending on state) and The Georgia Forestry Commission
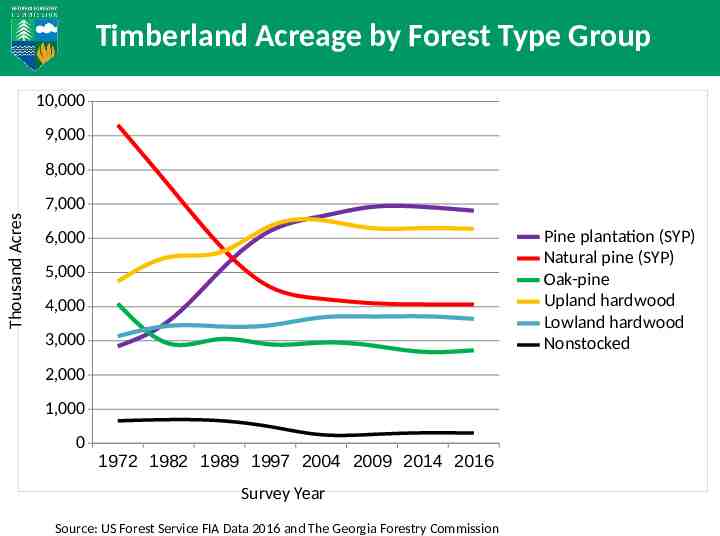
Timberland Acreage by Forest Type Group 10,000 9,000 Thousand Acres 8,000 7,000 Pine plantation (SYP) Natural pine (SYP) Oak-pine Upland hardwood Lowland hardwood Nonstocked 6,000 5,000 4,000 3,000 2,000 1,000 0 1972 1982 1989 1997 2004 2009 2014 2016 Survey Year Source: US Forest Service FIA Data 2016 and The Georgia Forestry Commission
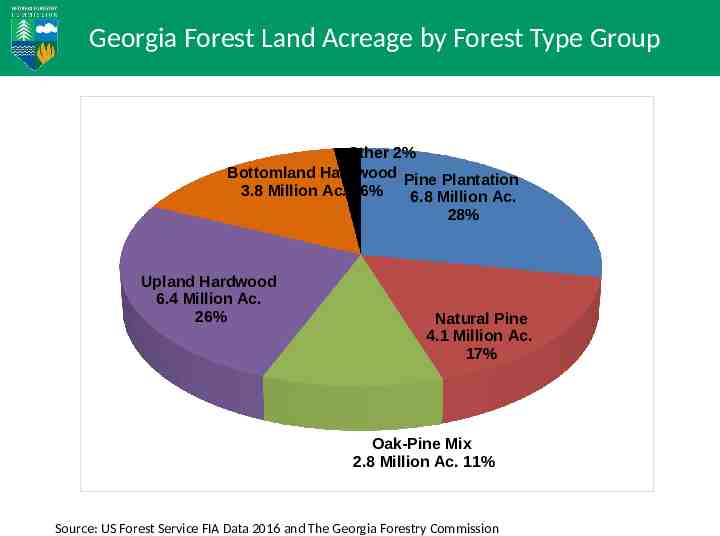
Georgia Forest Land Acreage by Forest Type Group Other 2% Bottomland Hardwood Pine Plantation 3.8 Million Ac. 16% 6.8 Million Ac. 28% Upland Hardwood 6.4 Million Ac. 26% Natural Pine 4.1 Million Ac. 17% Oak-Pine Mix 2.8 Million Ac. 11% Source: US Forest Service FIA Data 2016 and The Georgia Forestry Commission
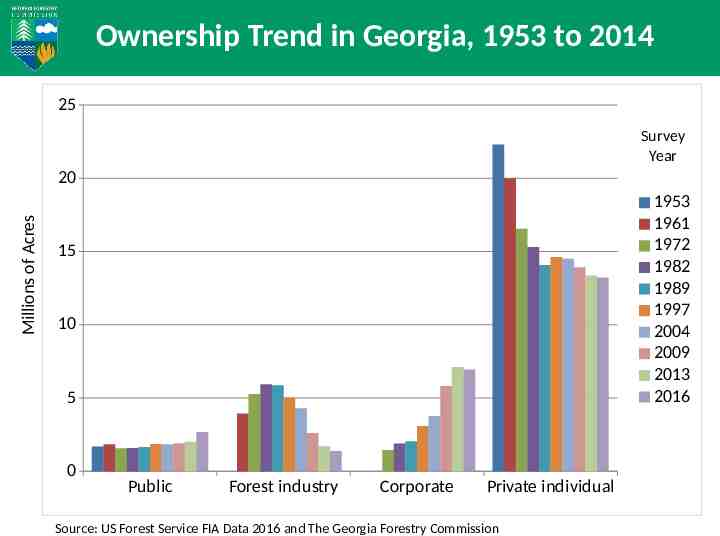
Ownership Trend in Georgia, 1953 to 2014 25 Survey Year Millions of Acres 20 1953 1961 1972 1982 1989 1997 2004 2009 2013 2016 15 10 5 0 Public Forest industry Corporate Private individual Source: US Forest Service FIA Data 2016 and The Georgia Forestry Commission
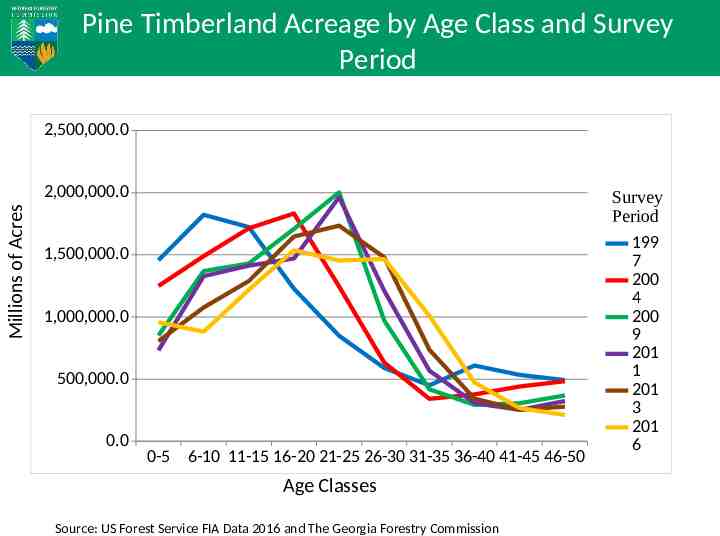
Pine Timberland Acreage by Age Class and Survey Period 2,500,000.0 Millions of Acres 2,000,000.0 1,500,000.0 1,000,000.0 500,000.0 0.0 0-5 6-10 11-15 16-20 21-25 26-30 31-35 36-40 41-45 46-50 Age Classes Source: US Forest Service FIA Data 2016 and The Georgia Forestry Commission Survey Period 199 7 200 4 200 9 201 1 201 3 201 6
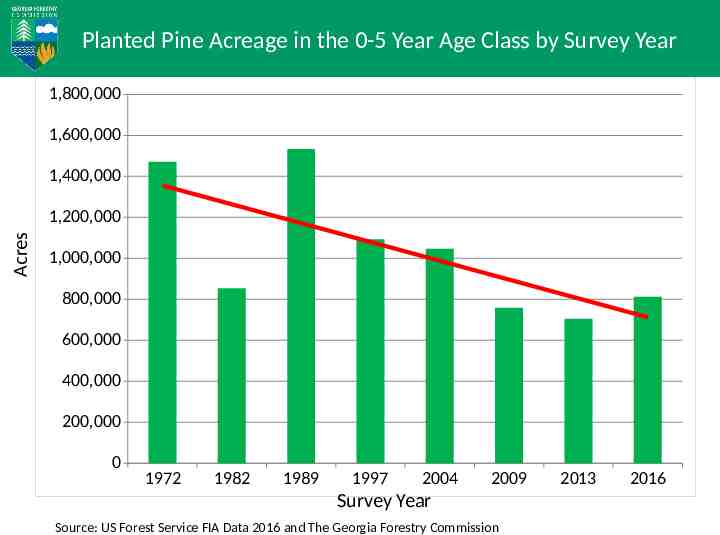
Planted Pine Acreage in the 0-5 Year Age Class by Survey Year 1,800,000 1,600,000 1,400,000 Acres 1,200,000 1,000,000 800,000 600,000 400,000 200,000 0 1972 1982 1989 1997 2004 2009 Survey Year Source: US Forest Service FIA Data 2016 and The Georgia Forestry Commission 2013 2016
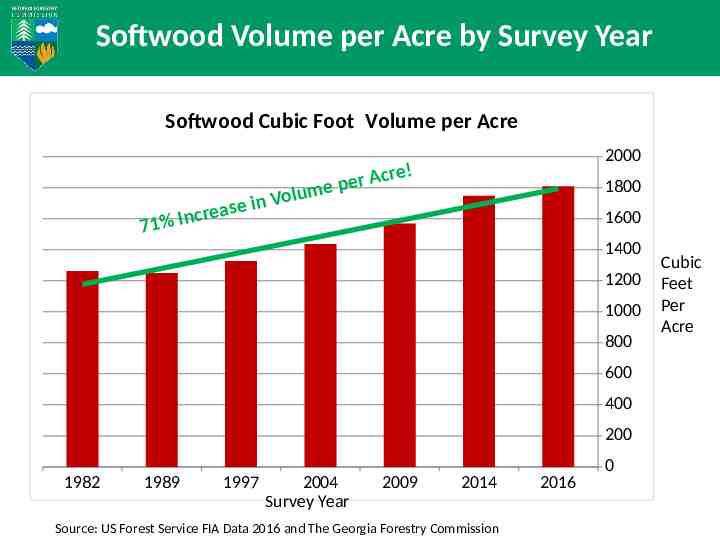
Softwood Volume per Acre by Survey Year Softwood Cubic Foot Volume per Acre 71 Vo n i e s ea % I n cr r Ac e p e lum 2000 re! 1800 1600 1400 1200 1000 800 600 400 200 1982 1989 1997 2004 Survey Year 2009 2014 Source: US Forest Service FIA Data 2016 and The Georgia Forestry Commission 2016 0 Cubic Feet Per Acre
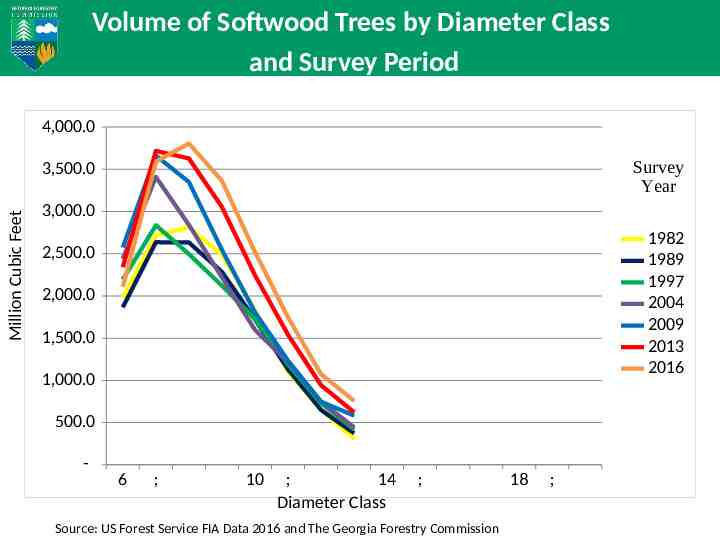
Volume of Softwood Trees by Diameter Class and Survey Period 4,000.0 Survey Year Million Cubic Feet 3,500.0 3,000.0 1982 1989 1997 2004 2009 2013 2016 2,500.0 2,000.0 1,500.0 1,000.0 500.0 - 6 ; 10 ; 14 Diameter Class ; Source: US Forest Service FIA Data 2016 and The Georgia Forestry Commission 18 ;
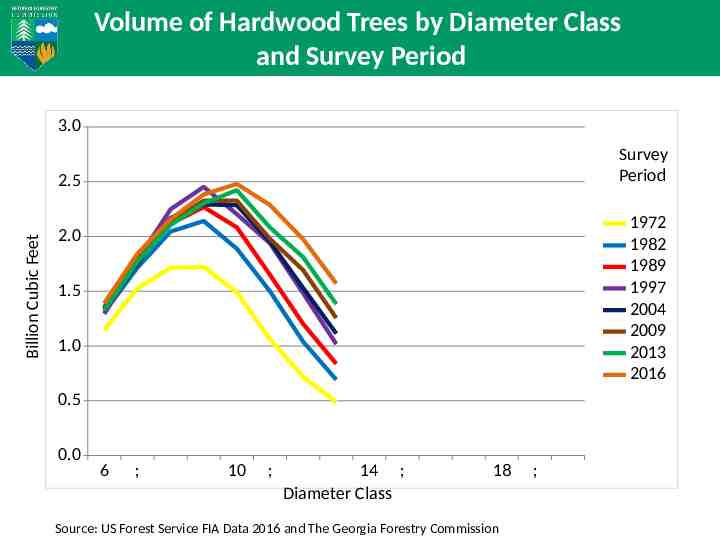
Volume of Hardwood Trees by Diameter Class and Survey Period 3.0 Survey Period Billion Cubic Feet 2.5 1972 1982 1989 1997 2004 2009 2013 2016 2.0 1.5 1.0 0.5 0.0 6 ; 10 ; 14 ; Diameter Class 18 Source: US Forest Service FIA Data 2016 and The Georgia Forestry Commission ;
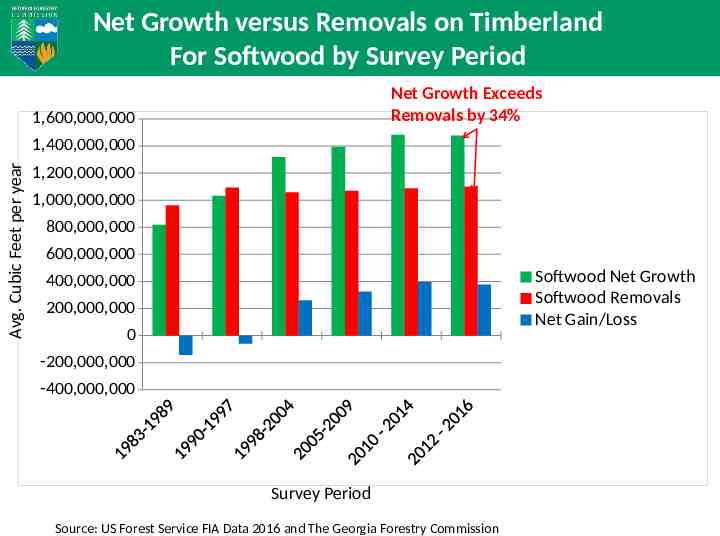
Net Growth versus Removals on Timberland For Softwood by Survey Period Net Growth Exceeds Removals by 34% 1,600,000,000 Avg. Cubic Feet per year 1,400,000,000 1,200,000,000 1,000,000,000 800,000,000 600,000,000 Softwood Net Growth Softwood Removals Net Gain/Loss 400,000,000 200,000,000 0 -200,000,000 -400,000,000 Survey Period Source: US Forest Service FIA Data 2016 and The Georgia Forestry Commission
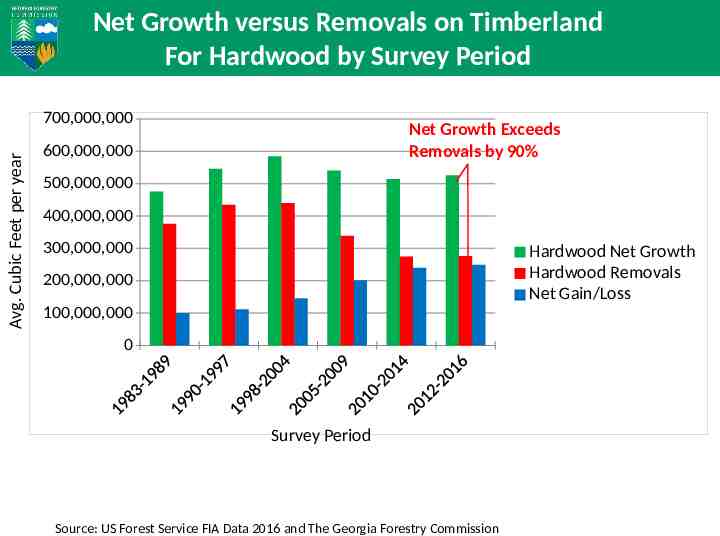
Net Growth versus Removals on Timberland For Hardwood by Survey Period Avg. Cubic Feet per year 700,000,000 Net Growth Exceeds Removals by 90% 600,000,000 500,000,000 400,000,000 300,000,000 Hardwood Net Growth Hardwood Removals Net Gain/Loss 200,000,000 100,000,000 0 Survey Period Source: US Forest Service FIA Data 2016 and The Georgia Forestry Commission
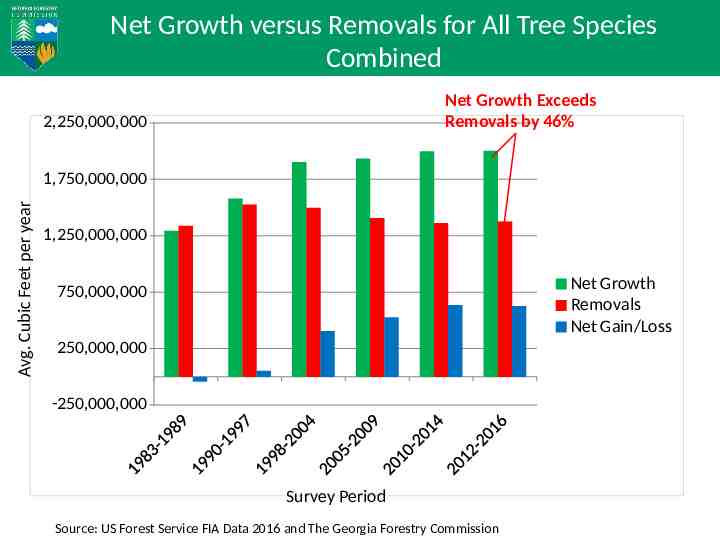
Net Growth versus Removals for All Tree Species Combined By Survey Period Net Growth Exceeds Removals by 46% 2,250,000,000 Avg. Cubic Feet per year 1,750,000,000 1,250,000,000 Net Growth Removals Net Gain/Loss 750,000,000 250,000,000 -250,000,000 Survey Period Source: US Forest Service FIA Data 2016 and The Georgia Forestry Commission
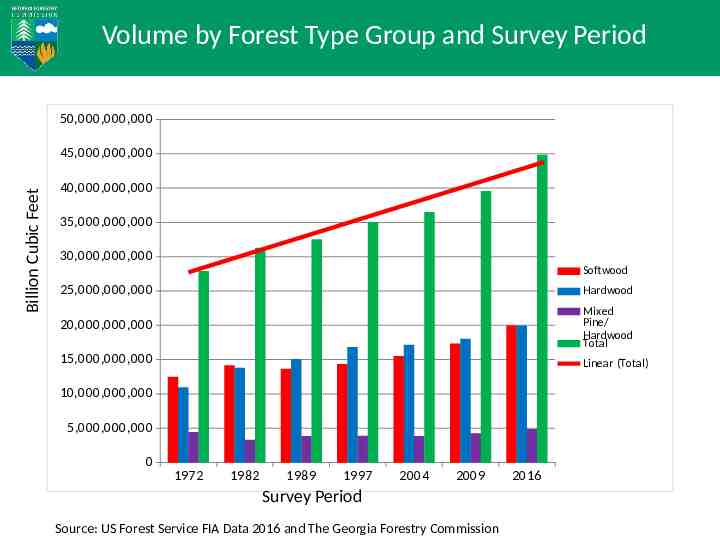
Volume by Forest Type Group and Survey Period 50,000,000,000 Billion Cubic Feet 45,000,000,000 40,000,000,000 35,000,000,000 30,000,000,000 Softwood 25,000,000,000 Hardwood 20,000,000,000 Mixed Pine/ Hardwood Total 15,000,000,000 Linear (Total) 10,000,000,000 5,000,000,000 0 1972 1982 1989 1997 2004 2009 Survey Period Source: US Forest Service FIA Data 2016 and The Georgia Forestry Commission 2016
Georgia’s Forests Final Thoughts Our forests are being managed sustainably Forests benefit all Georgians with a continuous flow of goods and services of traditional forest products Also benefits society with clean air, clean water, wildlife habitat, soil conservation, recreation and aesthetic benefits Remember that 2 out of 3 raindrops in Georgia fall on forestland Planting pines now for the future is what Georgia needs to remain sustainable www.gatrees.org