TELECOM CUSTOMER CHURN PREDICTION Ayush Kumar Jimmy Joseph


6 Slides4.22 MB
TELECOM CUSTOMER CHURN PREDICTION Ayush Kumar Jimmy Joseph Kamal Kannan Krishnan Namita Singh University of Connecticut Stamford CT
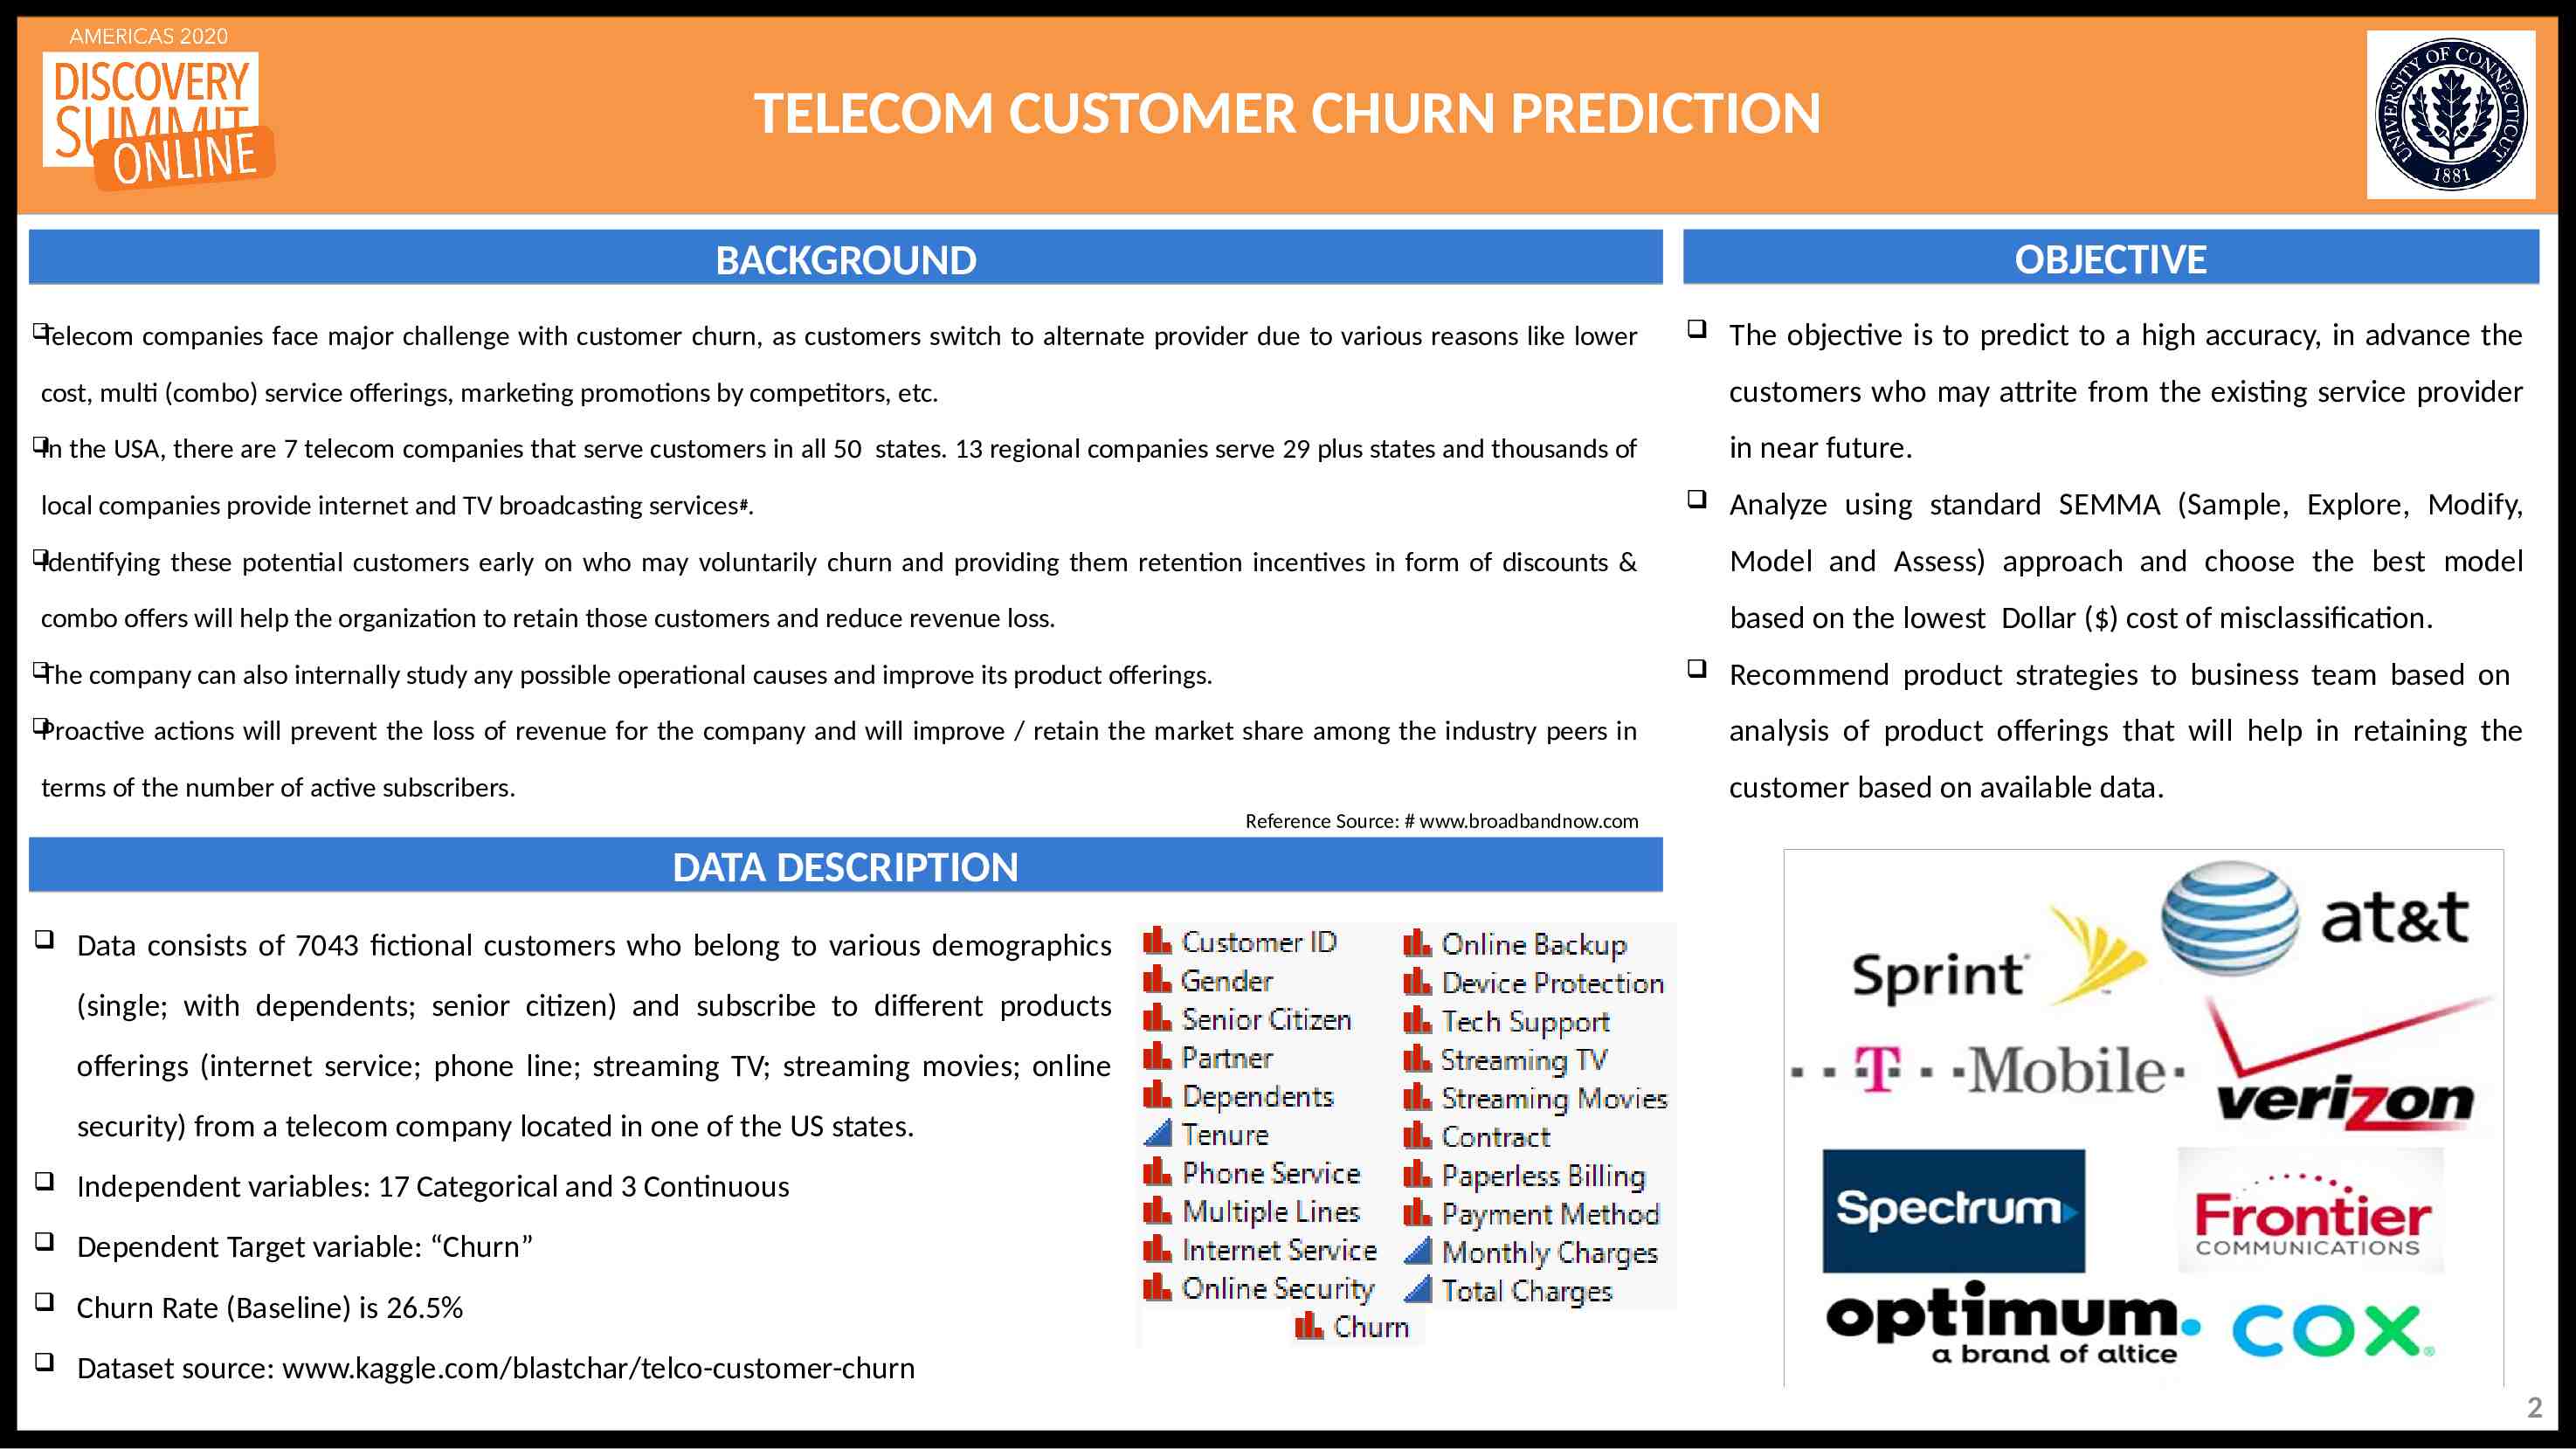
TELECOM CUSTOMER CHURN PREDICTION OBJECTIVE BACKGROUND Telecom companies face major challenge with customer churn, as customers switch to alternate provider due to various reasons like lower customers who may attrite from the existing service provider cost, multi (combo) service offerings, marketing promotions by competitors, etc. In in near future. the USA, there are 7 telecom companies that serve customers in all 50 states. 13 regional companies serve 29 plus states and thousands of local companies provide internet and TV broadcasting services #. Identifying Analyze using standard SEMMA (Sample, Explore, Modify, Model and Assess) approach and choose the best model these potential customers early on who may voluntarily churn and providing them retention incentives in form of discounts & based on the lowest Dollar ( ) cost of misclassification. combo offers will help the organization to retain those customers and reduce revenue loss. The company can also internally study any possible operational causes and improve its product offerings. Proactive The objective is to predict to a high accuracy, in advance the actions will prevent the loss of revenue for the company and will improve / retain the market share among the industry peers in Recommend product strategies to business team based on analysis of product offerings that will help in retaining the customer based on available data. terms of the number of active subscribers. Reference Source: # www.broadbandnow.com DATA DESCRIPTION Data consists of 7043 fictional customers who belong to various demographics (single; with dependents; senior citizen) and subscribe to different products offerings (internet service; phone line; streaming TV; streaming movies; online security) from a telecom company located in one of the US states. Independent variables: 17 Categorical and 3 Continuous Dependent Target variable: “Churn” Churn Rate (Baseline) is 26.5% Dataset source: www.kaggle.com/blastchar/telco-customer-churn 2
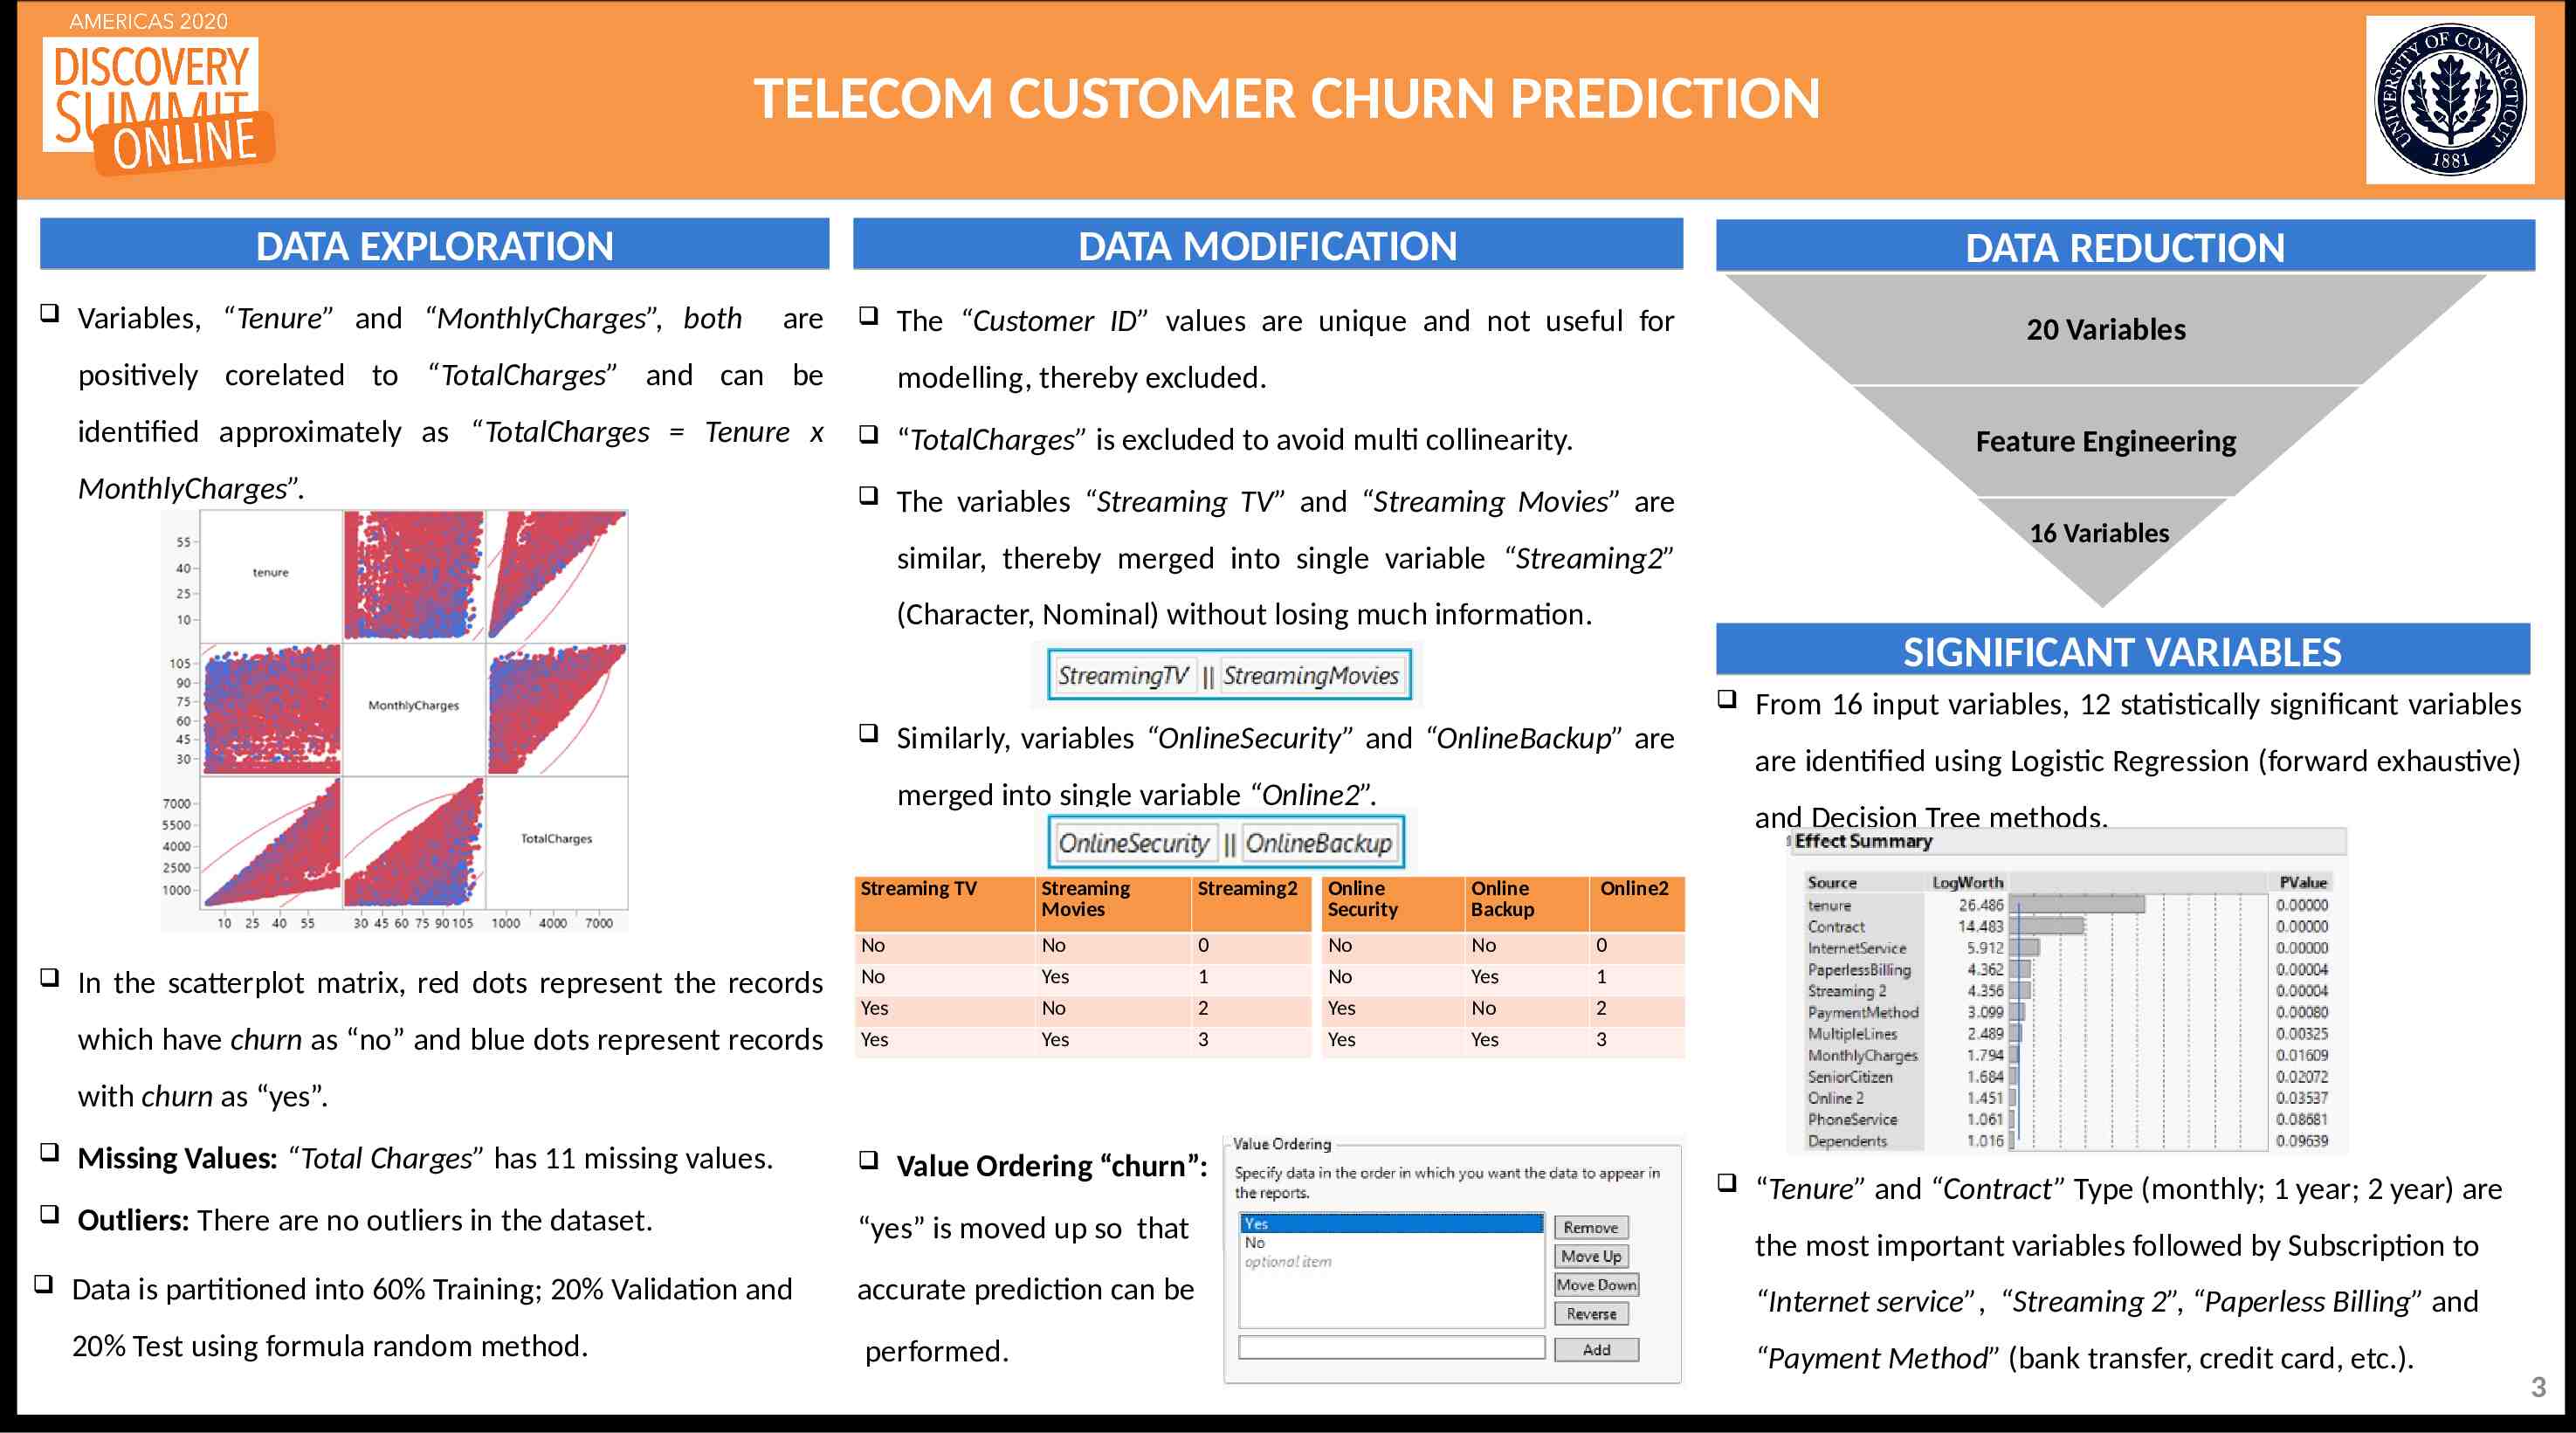
TELECOM CUSTOMER CHURN PREDICTION DATA EXPLORATION Variables, “Tenure” and “MonthlyCharges”, both DATA MODIFICATION are positively corelated to “TotalCharges” and can be DATA REDUCTION The “Customer ID” values are unique and not useful for 20 Variables modelling, thereby excluded. identified approximately as “TotalCharges Tenure x “TotalCharges” is excluded to avoid multi collinearity. MonthlyCharges”. The variables “Streaming TV” and “Streaming Movies” are Feature Engineering 16 Variables similar, thereby merged into single variable “Streaming2” (Character, Nominal) without losing much information. SIGNIFICANT VARIABLES Similarly, variables “OnlineSecurity” and “OnlineBackup” are are identified using Logistic Regression (forward exhaustive) merged into single variable “Online2”. From 16 input variables, 12 statistically significant variables and Decision Tree methods. Streaming TV Streaming Movies Streaming2 Online Security Online Backup Online2 No No Yes Yes No Yes No Yes 0 1 2 3 No No Yes Yes No Yes No Yes 0 1 2 3 Missing Values: “Total Charges” has 11 missing values. Value Ordering “churn”: Outliers: There are no outliers in the dataset. “yes” is moved up so that Data is partitioned into 60% Training; 20% Validation and accurate prediction can be “Internet service”, “Streaming 2”, “Paperless Billing” and 20% Test using formula random method. performed. “Payment Method” (bank transfer, credit card, etc.). In the scatterplot matrix, red dots represent the records which have churn as “no” and blue dots represent records with churn as “yes”. “Tenure” and “Contract” Type (monthly; 1 year; 2 year) are the most important variables followed by Subscription to 3
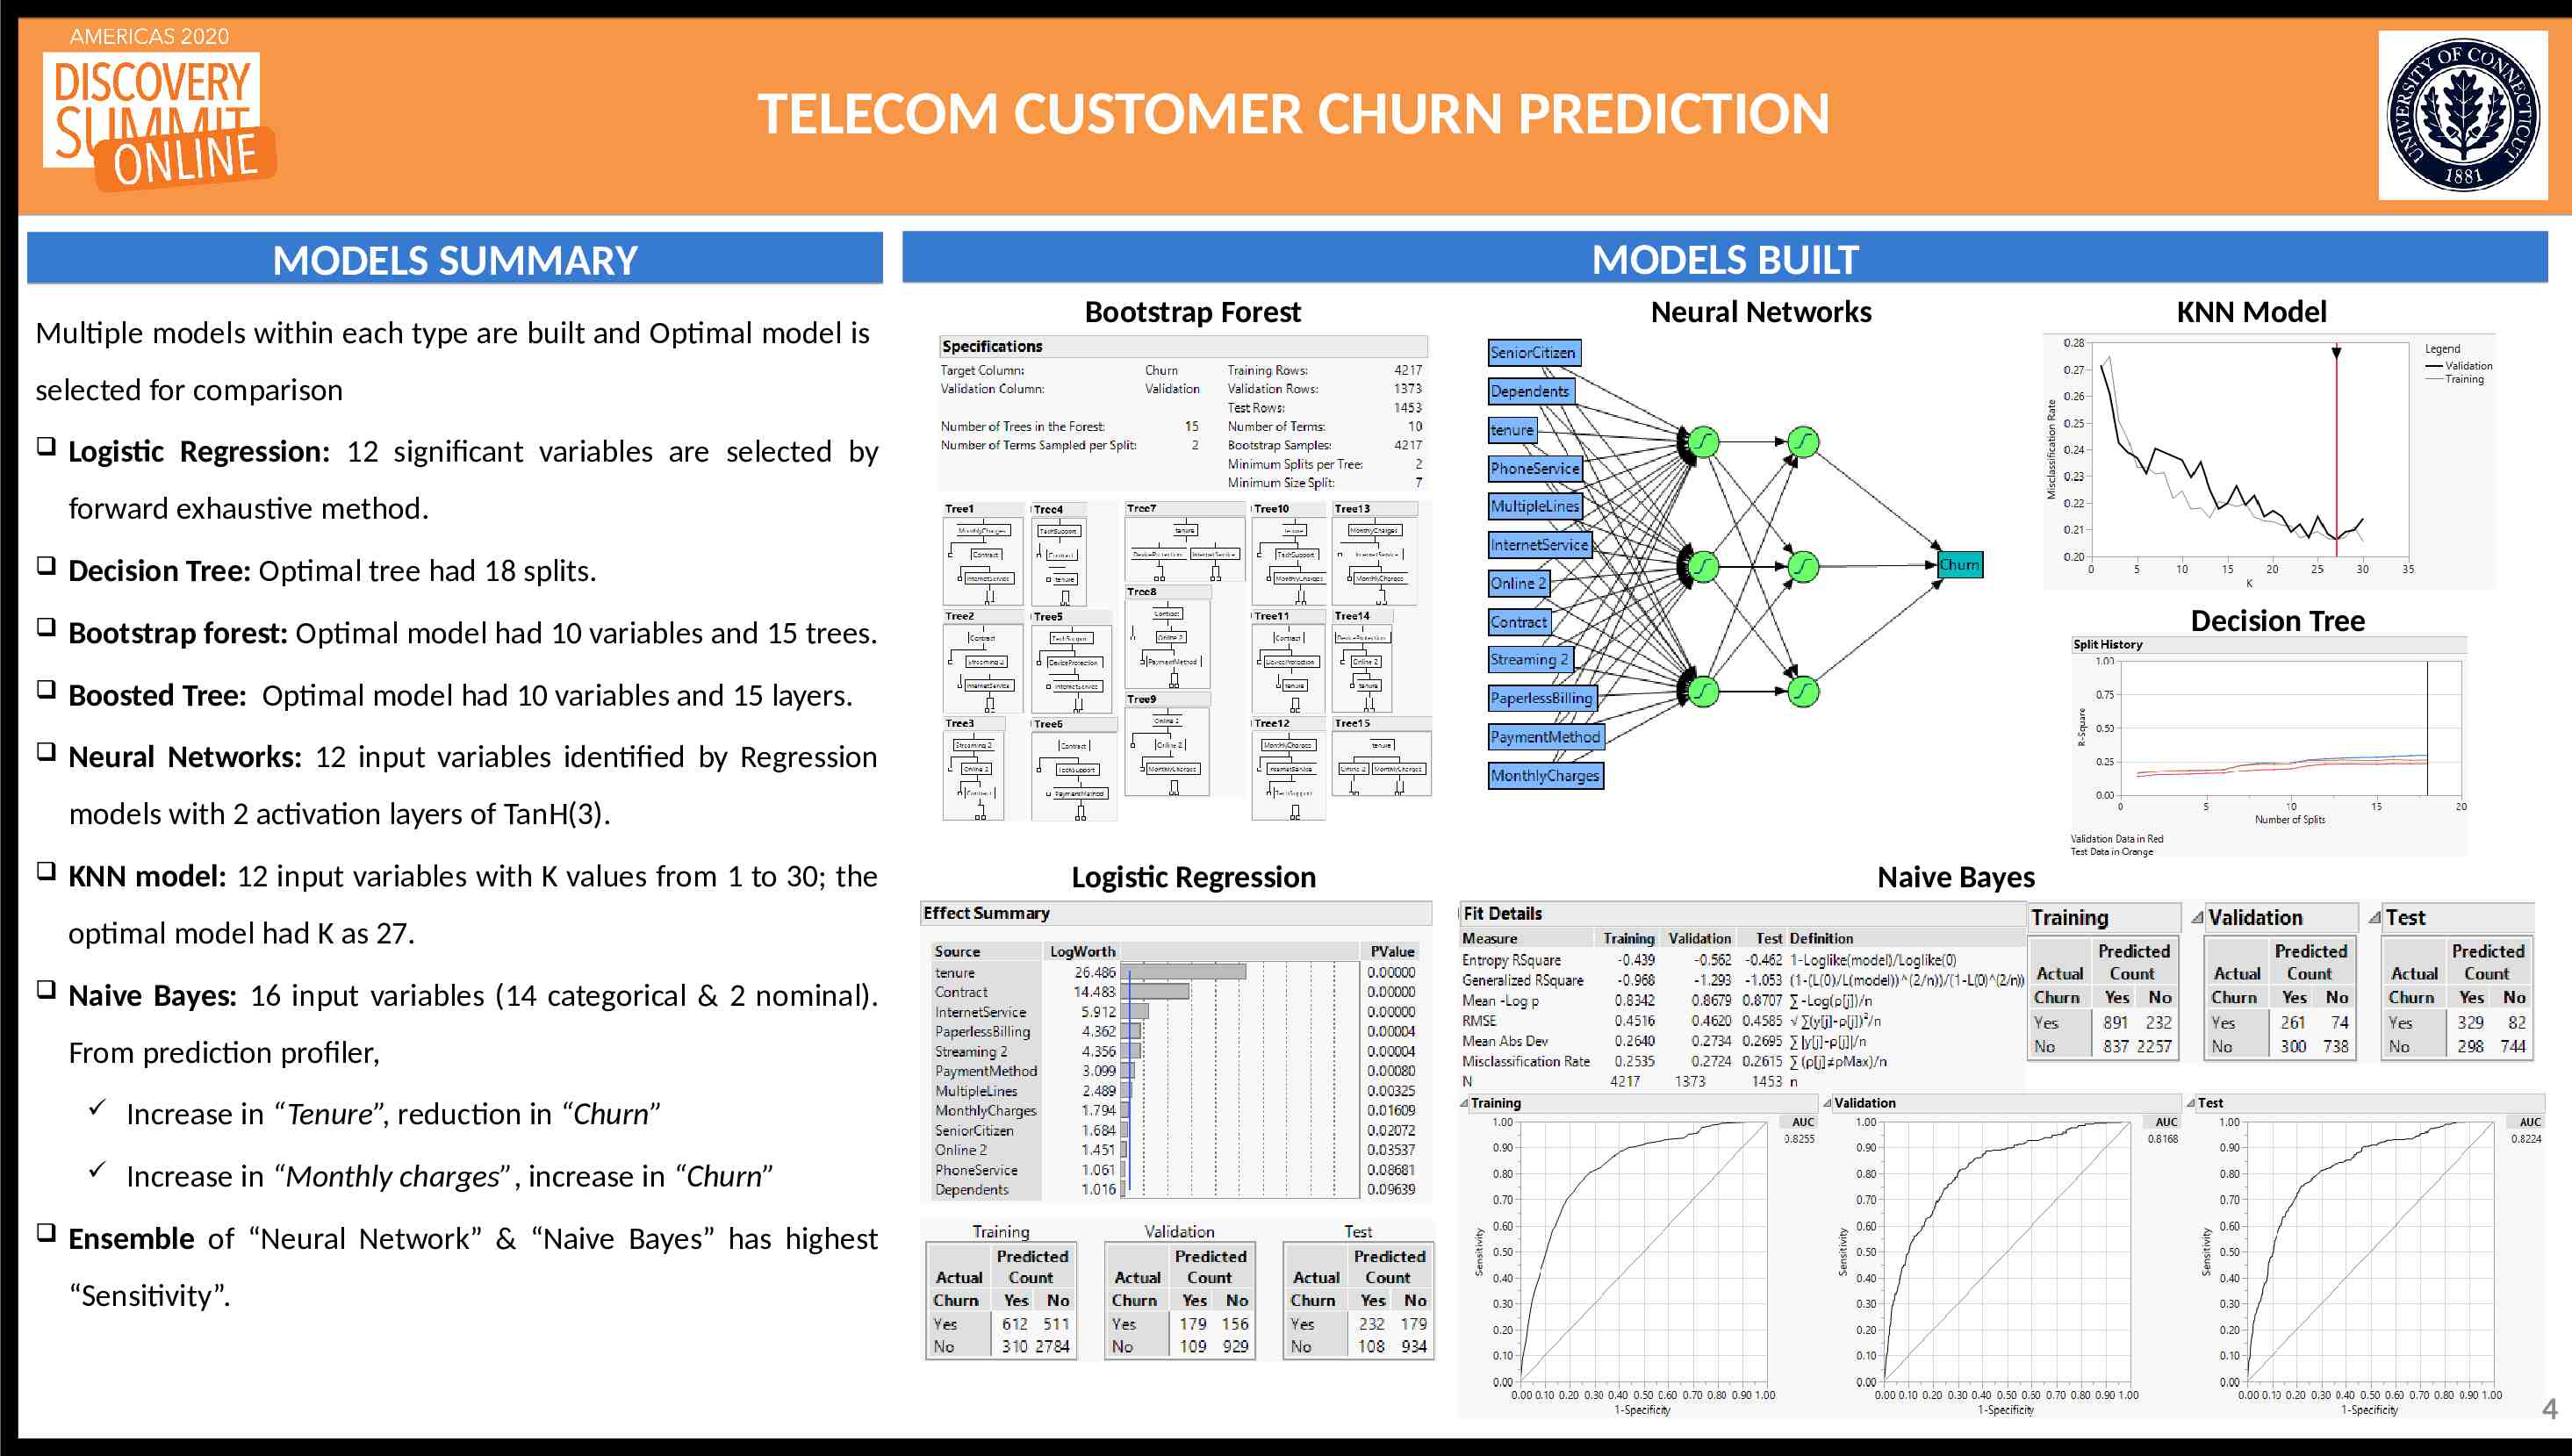
TELECOM CUSTOMER CHURN PREDICTION MODELS BUILT MODELS SUMMARY Multiple models within each type are built and Optimal model is Bootstrap Forest Neural Networks KNN Model selected for comparison Logistic Regression: 12 significant variables are selected by forward exhaustive method. Decision Tree: Optimal tree had 18 splits. Bootstrap forest: Optimal model had 10 variables and 15 trees. Boosted Tree: Optimal model had 10 variables and 15 layers. Neural Networks: 12 input variables identified by Regression Decision Tree models with 2 activation layers of TanH(3). KNN model: 12 input variables with K values from 1 to 30; the Logistic Regression Naive Bayes optimal model had K as 27. Naive Bayes: 16 input variables (14 categorical & 2 nominal). From prediction profiler, Increase in “Tenure”, reduction in “Churn” Increase in “Monthly charges”, increase in “Churn” Ensemble of “Neural Network” & “Naive Bayes” has highest “Sensitivity”. 4
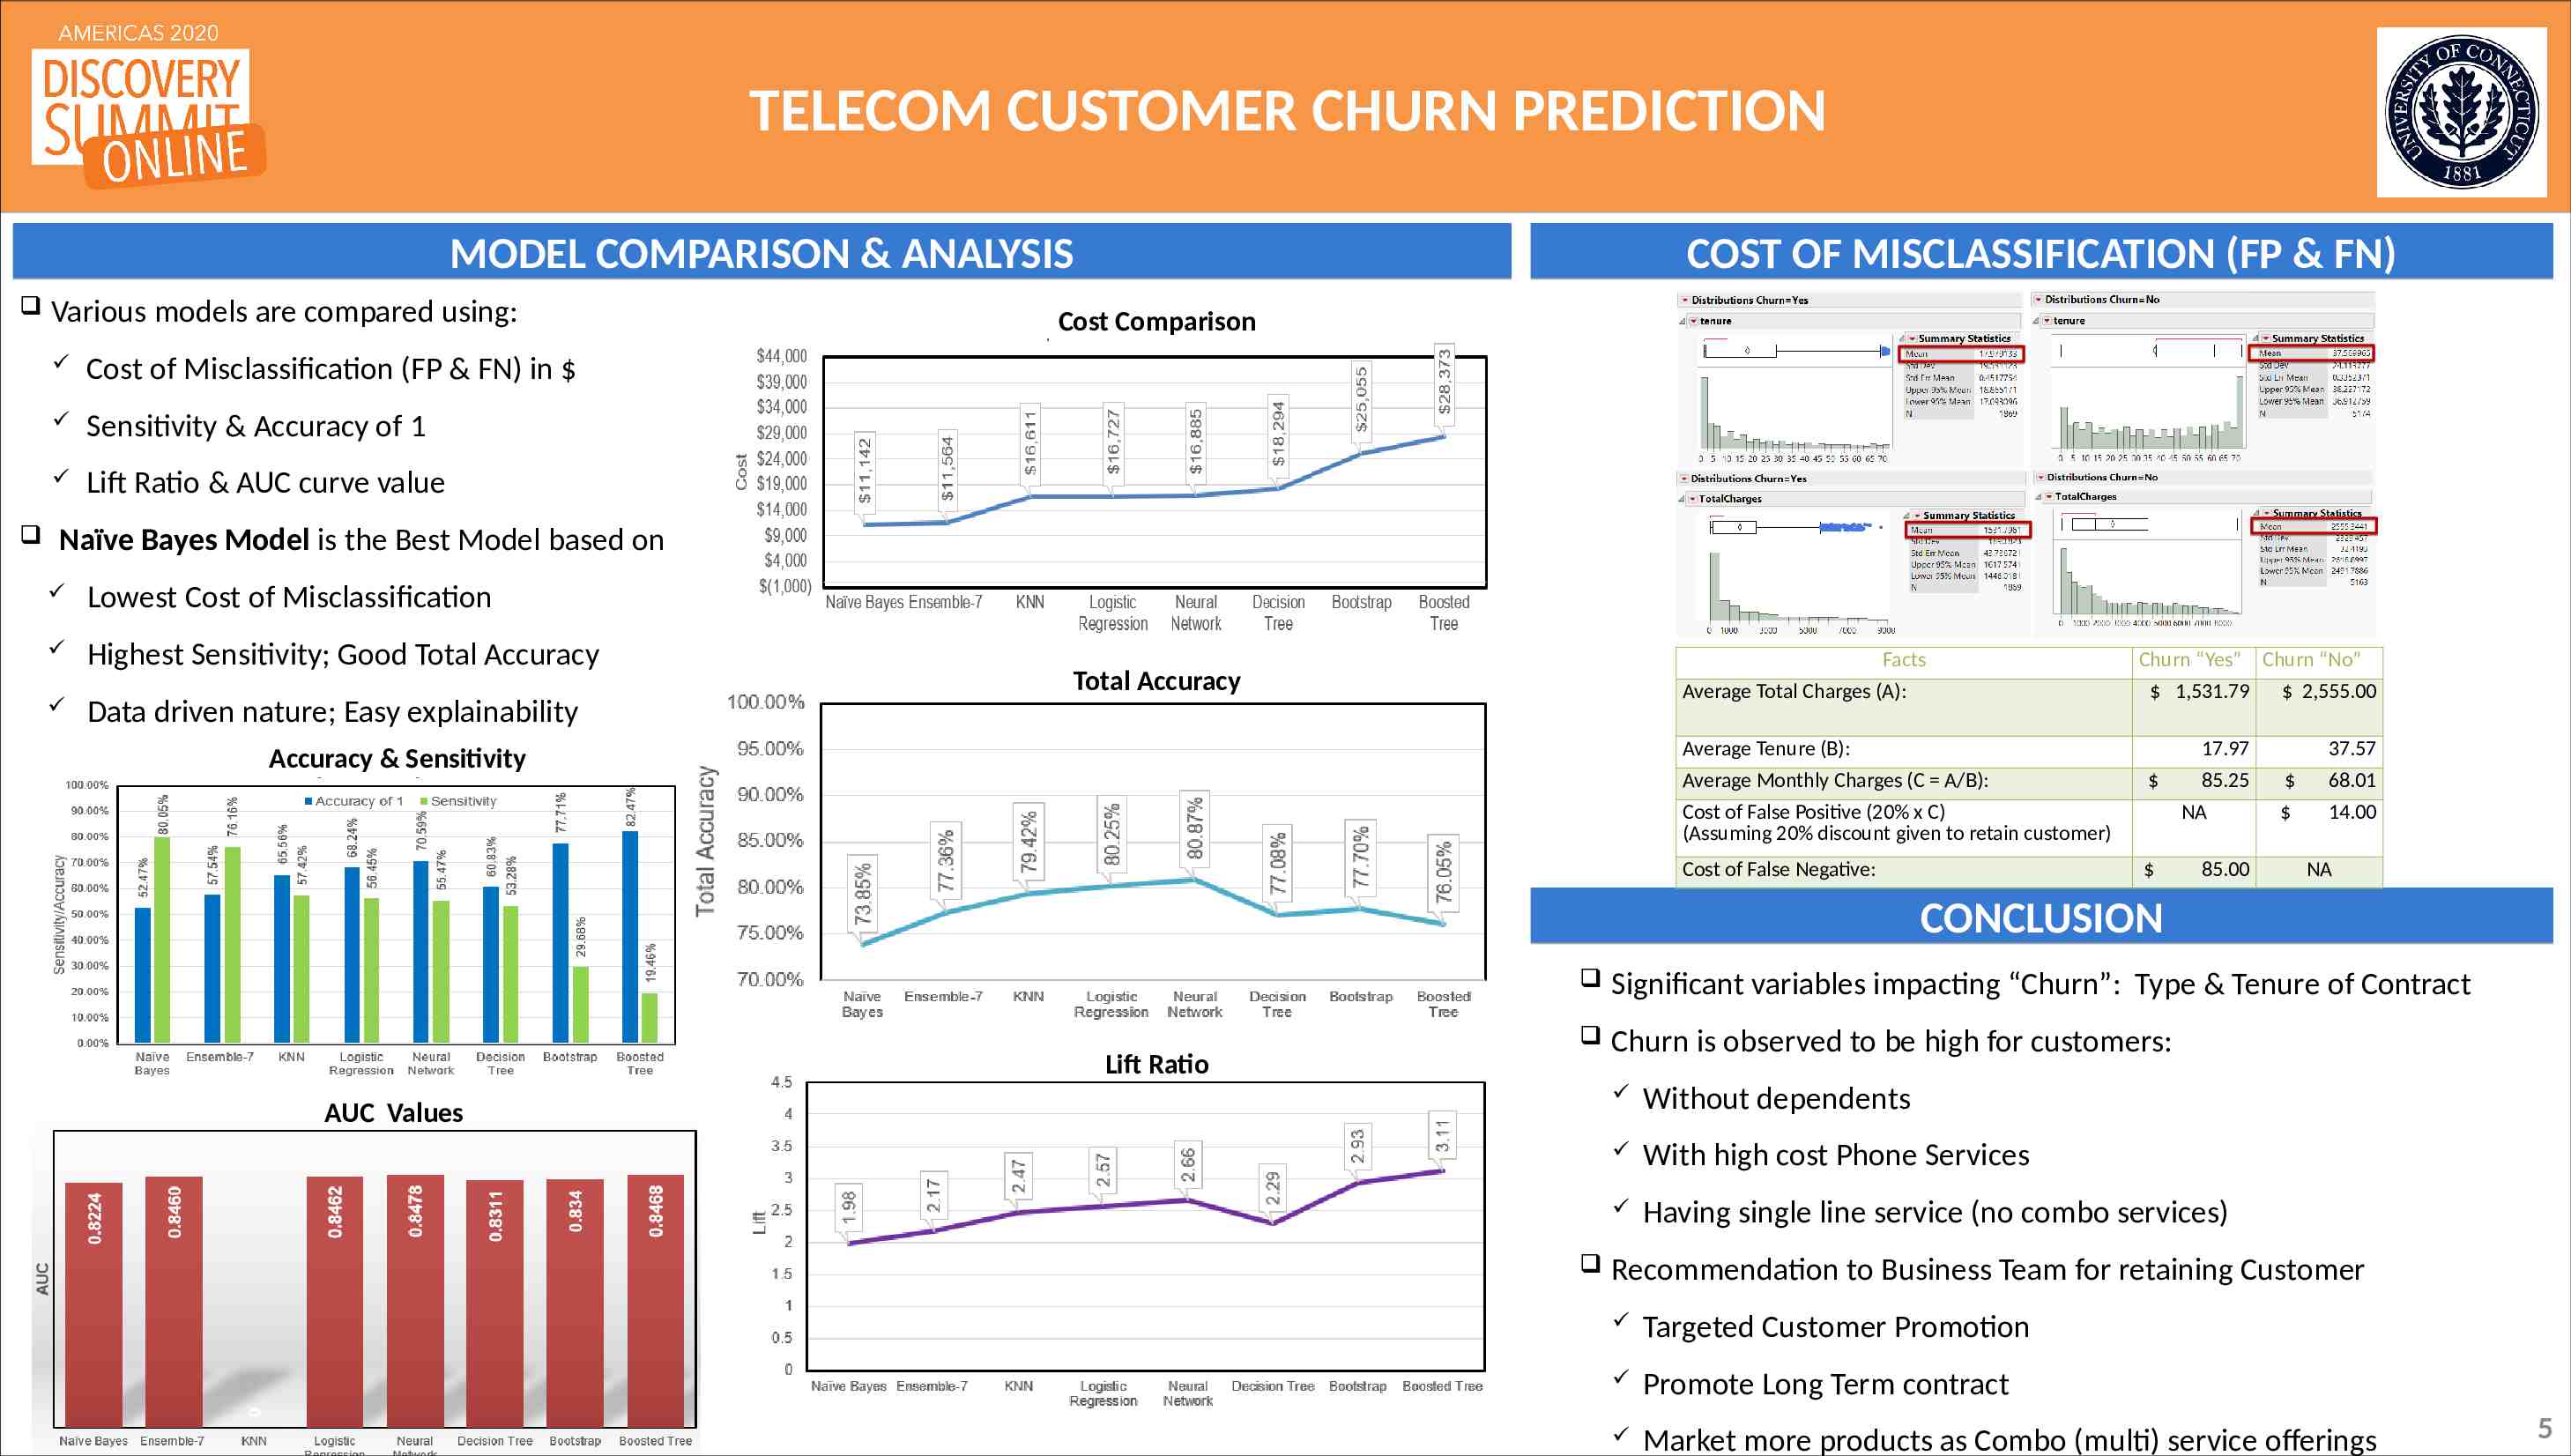
TELECOM CUSTOMER CHURN PREDICTION MODEL COMPARISON & ANALYSIS Various models are compared using: Cost of Misclassification (FP & FN) in Sensitivity & Accuracy of 1 Lift Ratio & AUC curve value COST OF MISCLASSIFICATION (FP & FN) Cost Comparison Naïve Bayes Model is the Best Model based on Lowest Cost of Misclassification Highest Sensitivity; Good Total Accuracy Facts Average Total Charges (A): Total Accuracy Data driven nature; Easy explainability Churn “Yes” Churn “No” 1,531.79 2,555.00 Average Tenure (B): Accuracy & Sensitivity 17.97 Average Monthly Charges (C A/B): Cost of False Positive (20% x C) (Assuming 20% discount given to retain customer) 85.25 NA Cost of False Negative: 85.00 37.57 68.01 14.00 NA CONCLUSION Significant variables impacting “Churn”: Type & Tenure of Contract Churn is observed to be high for customers: Lift Ratio AUC Values Without dependents With high cost Phone Services Having single line service (no combo services) Recommendation to Business Team for retaining Customer Targeted Customer Promotion Promote Long Term contract Market more products as Combo (multi) service offerings 5
TEAM Kamal Kannan Krishnan Ayush Kumar Namita Singh Jimmy Joseph kamal [email protected] [email protected] [email protected] [email protected] https://www.linkedin.com/in/kamal-kann an/ https://www.linkedin.com/in/ayush-kumar-367 62882 https://www.linkedin.com/in/namita-singh-7350 b922/ https://www.linkedin.com/in/jimmy-joseph-7 b0462/ MS Business Analytics and Project Management / MBA Graduate Students University of Connecticut Stamford CT