Spatial Concepts and Data Models

52 Slides9.77 MB
Spatial Concepts and Data Models
Outline Spatial data models Field data model (spatial raster data) Object data model (spatial vector data)
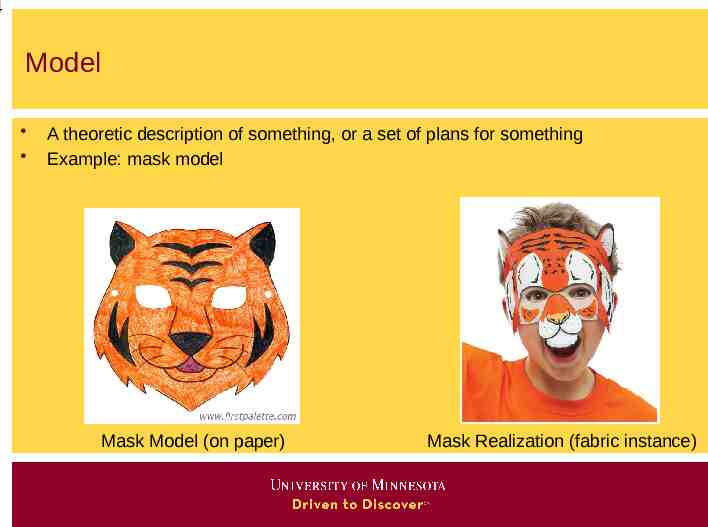
3 Model A theoretic description of something, or a set of plans for something
4 Model A theoretic description of something, or a set of plans for something Example: mask model Mask Model (on paper) Mask Realization (fabric instance)
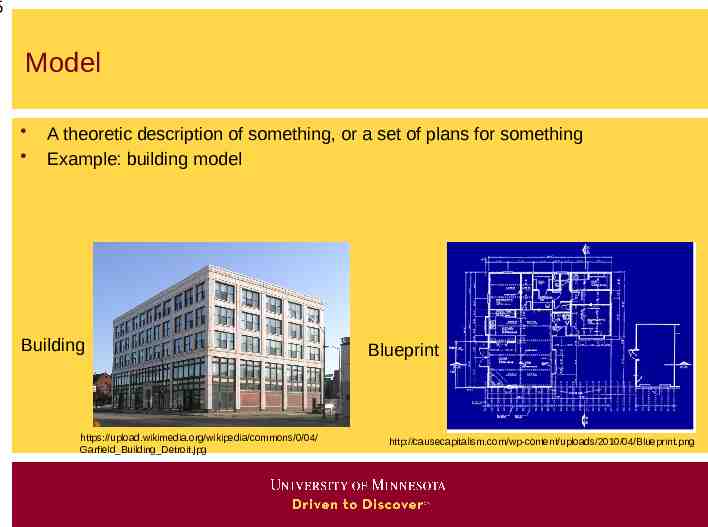
5 Model A theoretic description of something, or a set of plans for something Example: building model Building https://upload.wikimedia.org/wikipedia/commons/0/04/ Garfield Building Detroit.jpg Blueprint http://causecapitalism.com/wp-content/uploads/2010/04/Blueprint.png
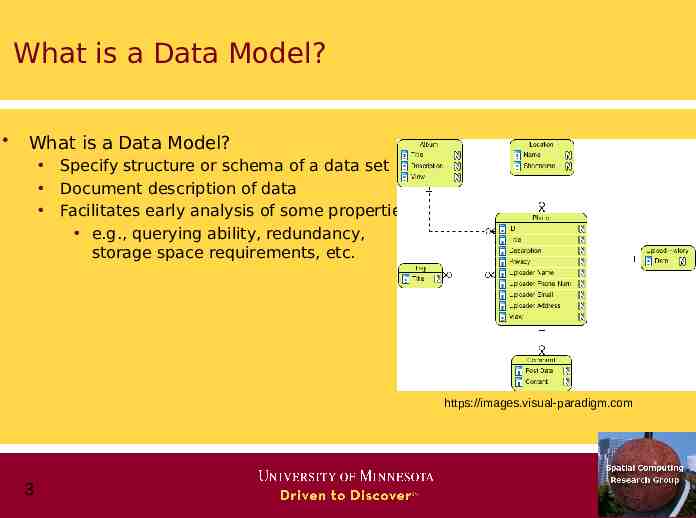
What is a Data Model? What is a Data Model? Specify structure or schema of a data set Document description of data Facilitates early analysis of some properties e.g., querying ability, redundancy, storage space requirements, etc. https://images.visual-paradigm.com 3
Why Data Models? Data models facilitate Early analysis of properties, e.g. storage cost, querying ability, . Reuse of shared data among multiple applications Exchange of data across organization Conversion of data to new software / environment Lessons from Y2K Crisis 4
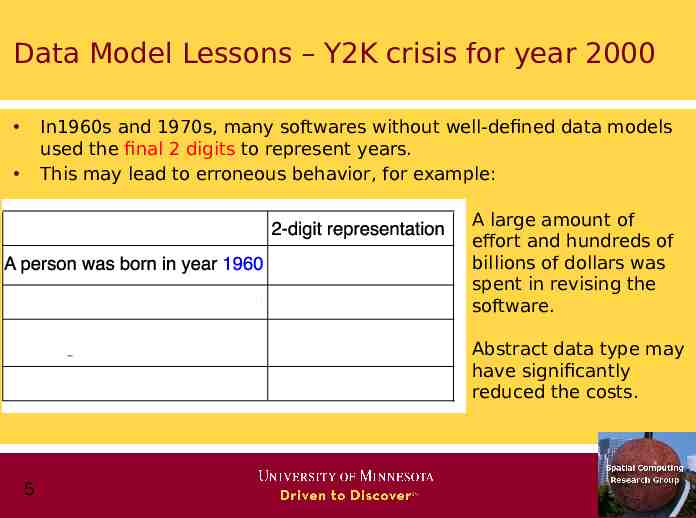
Data Model Lessons – Y2K crisis for year 2000 In1960s and 1970s, many softwares without well-defined data models used the final 2 digits to represent years. This may lead to erroneous behavior, for example: A large amount of effort and hundreds of billions of dollars was spent in revising the software. Abstract data type may have significantly reduced the costs. 5
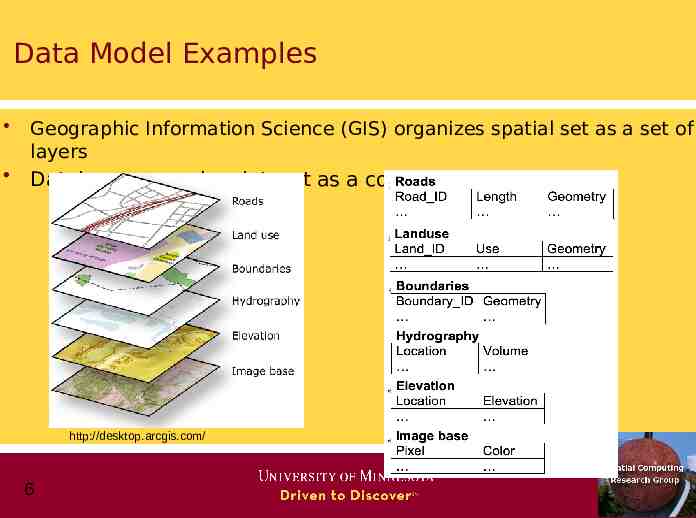
Data Model Examples Geographic Information Science (GIS) organizes spatial set as a set of layers Databases organize dataset as a collection of tables http://desktop.arcgis.com/ 6
Types of Data Models – Two Types Generic data models Developed for business data processing Support simple abstract data types (ADTs), e.g. numbers, strings, date Not convenient for spatial ADTs, e.g. polygons Application Domain specific models, e.g. spatial models Set of concepts developed in Geographic Information Science (GIS) Common spatial ADTs across different GIS applications 7
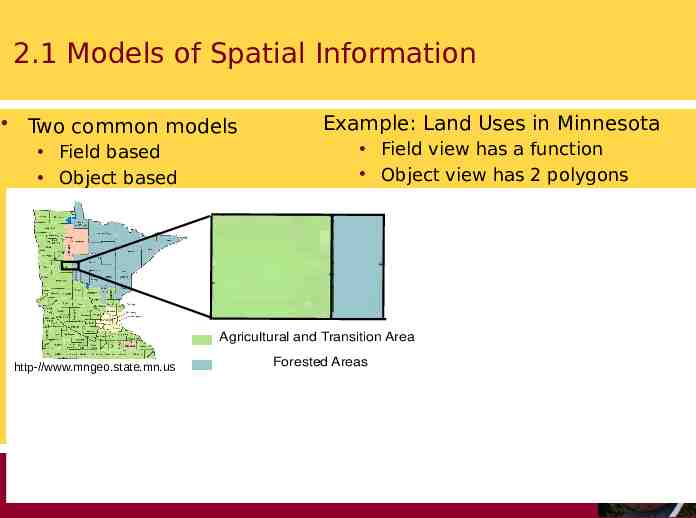
2.1 Models of Spatial Information Two common models Example: Land Uses in Minnesota Field view has a function Object view has 2 polygons Field based Object based Y 3 2 Agricultural and Transition Forest 1 X Agricultural and Transition Areas http-//www.mngeo.state.mn.us Field Viewpoint of Land Use "Agr. & Tran.", 0 x 3; 0 y 3 1 2 3 4 Object Viewpoint of Land Use Area-ID Land Use Area/Boundary LU1 Agri. & Tran. [(0,0), (3,0), (3,3), (0,3)] f(x,y) 9 0 Forested Areas "Forest", 3 x 4; 0 y 3 LU2 Forest [(3,0), (4,0), (4,3), (3,3)]
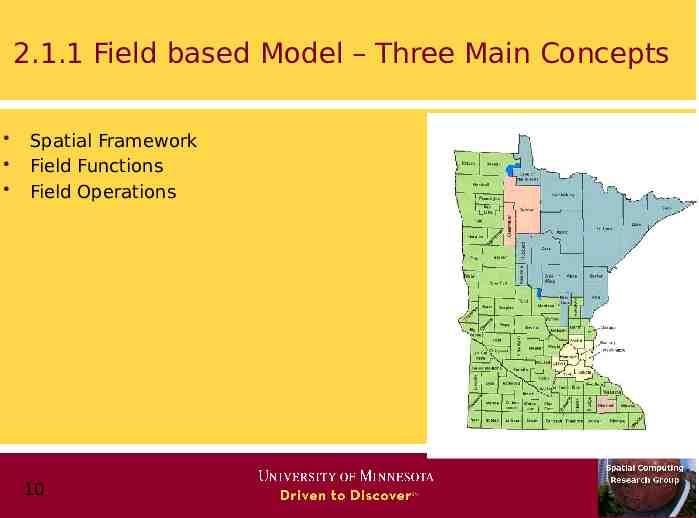
2.1.1 Field based Model – Three Main Concepts Spatial Framework Field Functions Field Operations 10
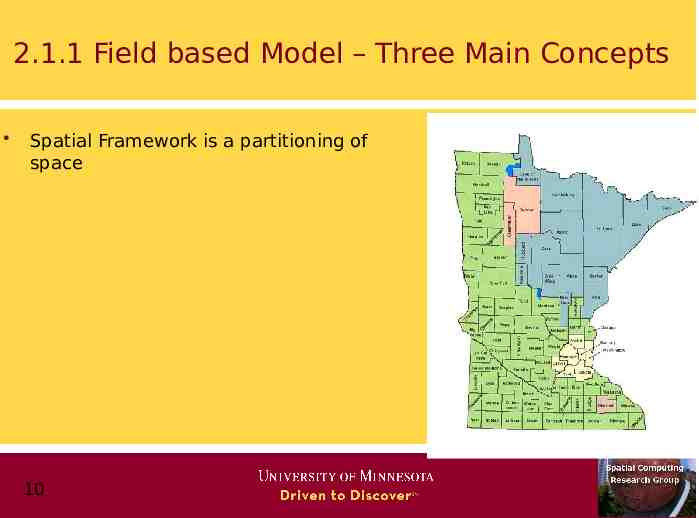
2.1.1 Field based Model – Three Main Concepts Spatial Framework is a partitioning of space 10
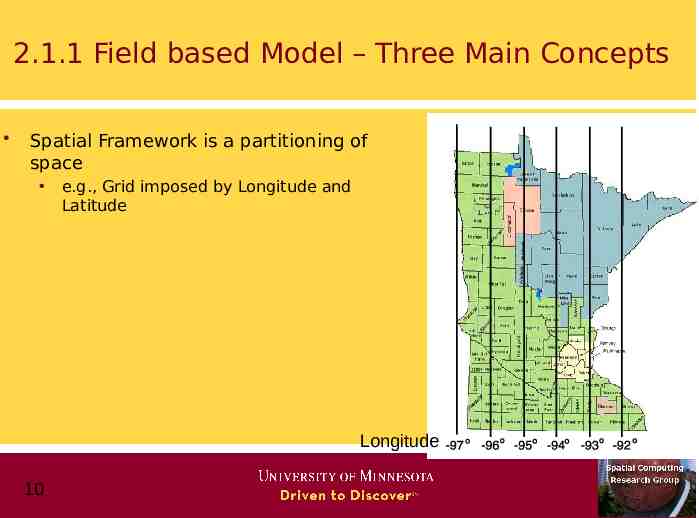
2.1.1 Field based Model – Three Main Concepts Spatial Framework is a partitioning of space e.g., Grid imposed by Longitude and Latitude Longitude 10
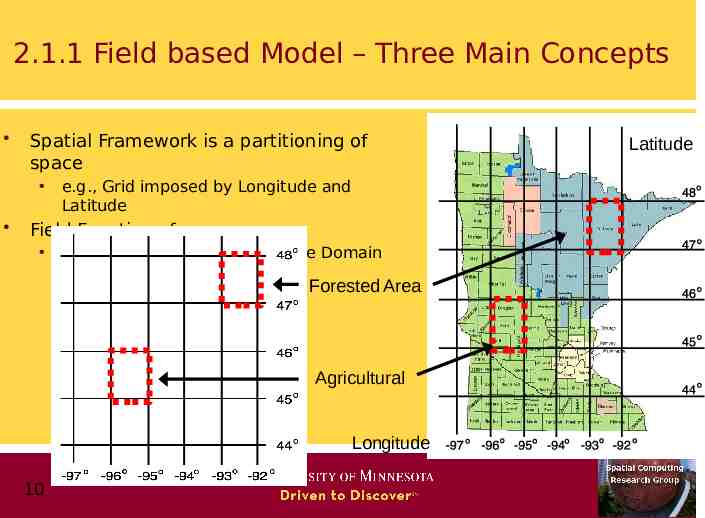
2.1.1 Field based Model – Three Main Concepts Spatial Framework is a partitioning of space e.g., Grid imposed by Longitude and Latitude Field Functions f: f: Spatial Framework Attribute Domain Forested Area Agricultural Longitude 10 Latitude
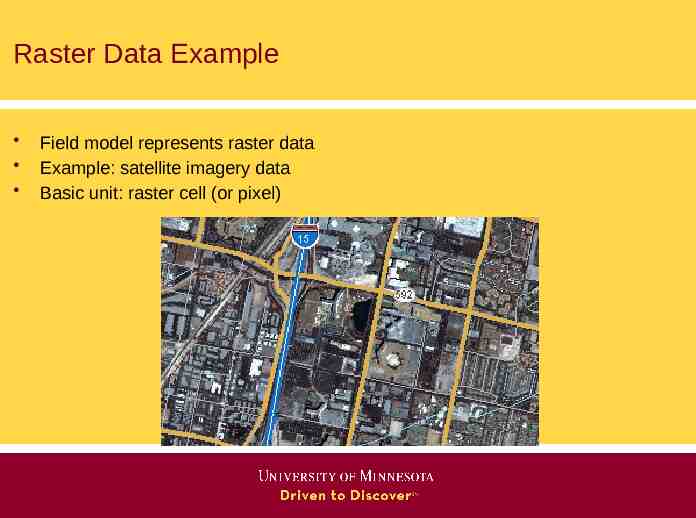
Raster Data Example Field model represents raster data Example: satellite imagery data Basic unit: raster cell (or pixel)
2.1.1 Field based Model – Field Operations Field Operations (operations between fields) Can be classified into four groups: 11 Local Focal Zonal Global
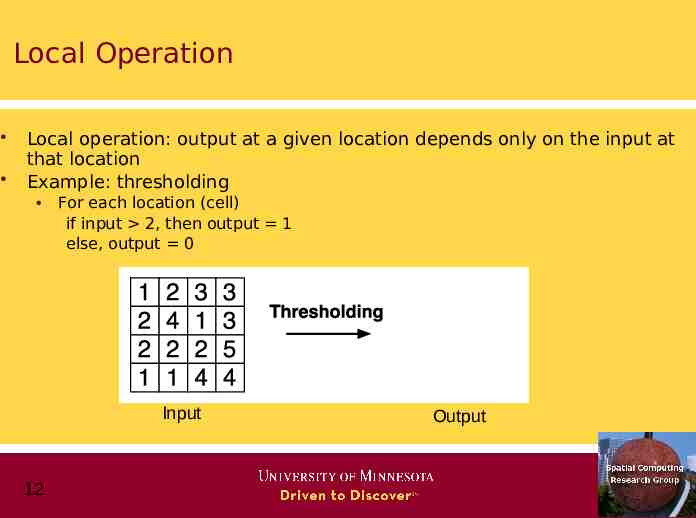
Local Operation Local operation: output at a given location depends only on the input at that location Example: thresholding For each location (cell) if input 2, then output 1 else, output 0 Input 12 Output
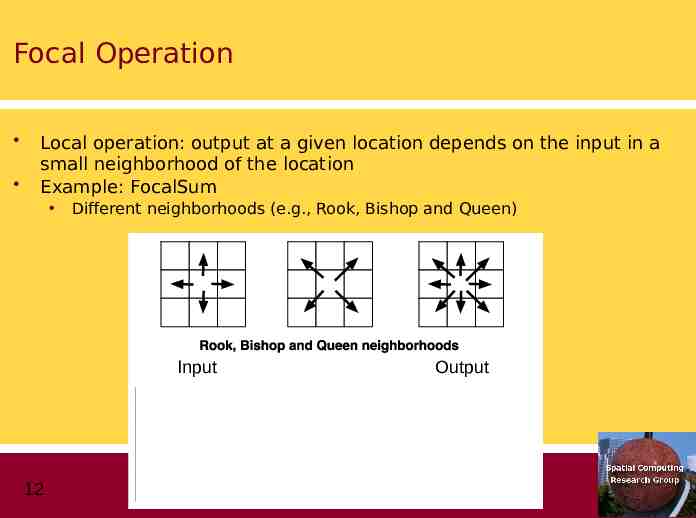
Focal Operation Local operation: output at a given location depends on the input in a small neighborhood of the location Example: FocalSum Different neighborhoods (e.g., Rook, Bishop and Queen) Input 12 Output
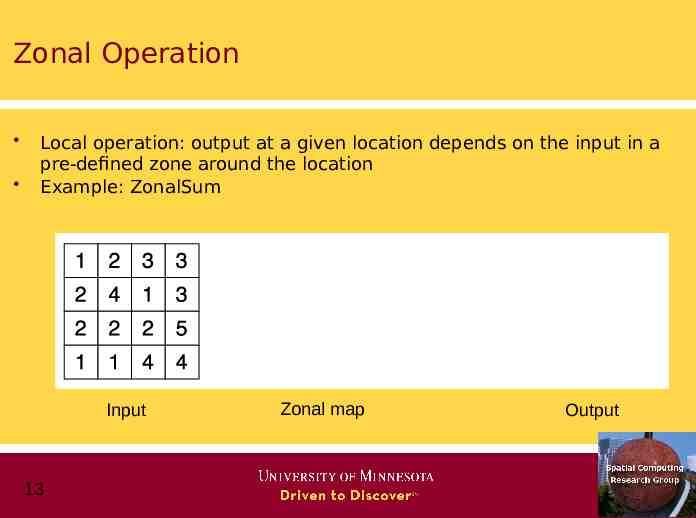
Zonal Operation Local operation: output at a given location depends on the input in a pre-defined zone around the location Example: ZonalSum Input 13 Zonal map Output
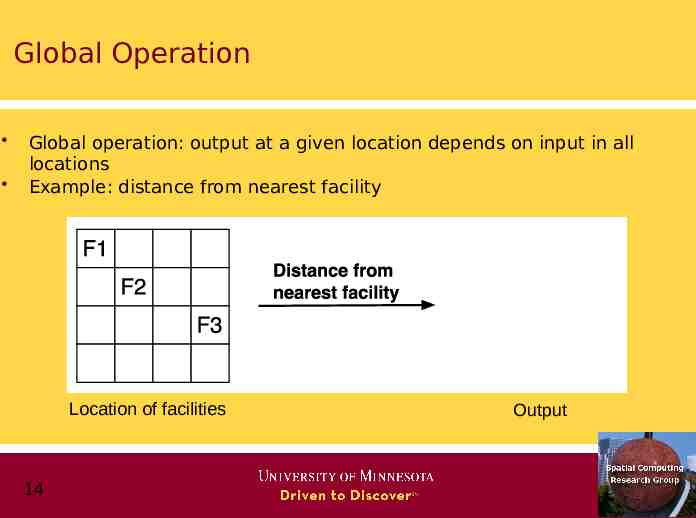
Global Operation Global operation: output at a given location depends on input in all locations Example: distance from nearest facility Location of facilities 14 Output
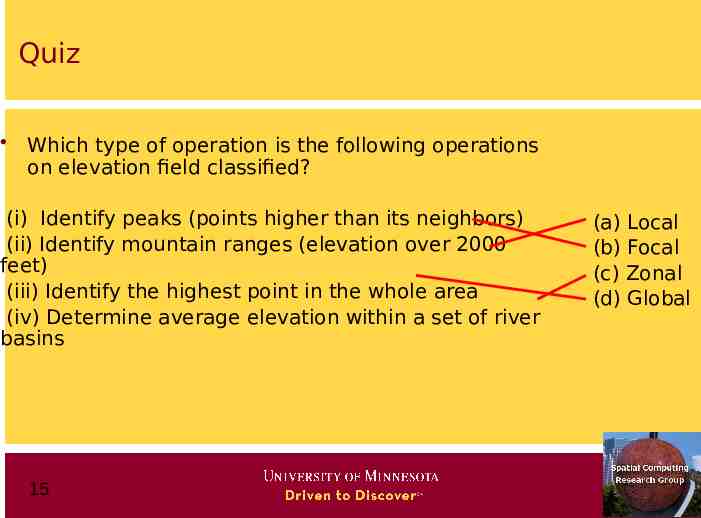
Quiz Which type of operation is the following operations on elevation field classified? (i) Identify peaks (points higher than its neighbors) (ii) Identify mountain ranges (elevation over 2000 feet) (iii) Identify the highest point in the whole area (iv) Determine average elevation within a set of river basins 15 (a) Local (b) Focal (c) Zonal (d) Global
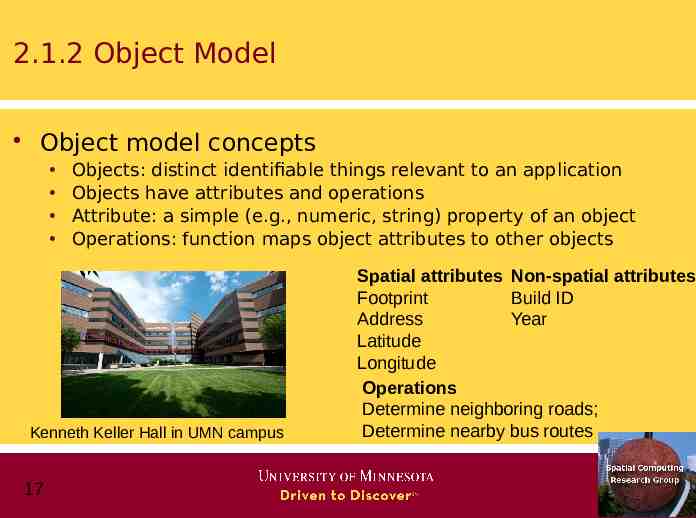
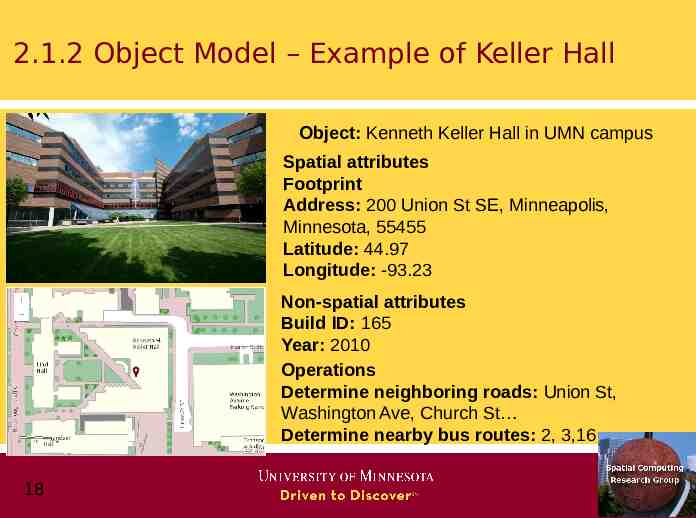
2.1.2 Object Model Object model concepts Objects: distinct identifiable things relevant to an application Objects have attributes and operations Attribute: a simple (e.g., numeric, string) property of an object Operations: function maps object attributes to other objects Kenneth Keller Hall in UMN campus 17 Spatial attributes Non-spatial attributes Footprint Build ID Address Year Latitude Longitude Operations Determine neighboring roads; Determine nearby bus routes
2.1.2 Object Model – Example of Keller Hall Object: Kenneth Keller Hall in UMN campus Spatial attributes Footprint Address: 200 Union St SE, Minneapolis, Minnesota, 55455 Latitude: 44.97 Longitude: -93.23 Non-spatial attributes Build ID: 165 Year: 2010 Operations Determine neighboring roads: Union St, Washington Ave, Church St Determine nearby bus routes: 2, 3,16 18
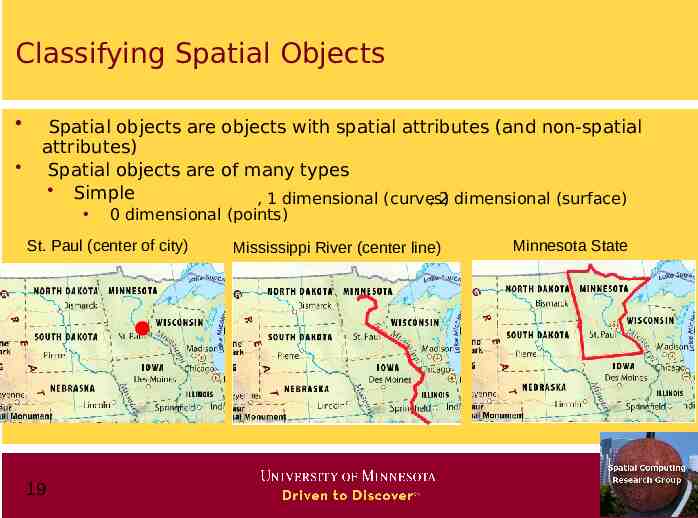
Classifying Spatial Objects Spatial objects are objects with spatial attributes (and non-spatial attributes) Spatial objects are of many types Simple , 1 dimensional (curves) , 2 dimensional (surface) 0 dimensional (points) St. Paul (center of city) 19 Mississippi River (center line) Minnesota State
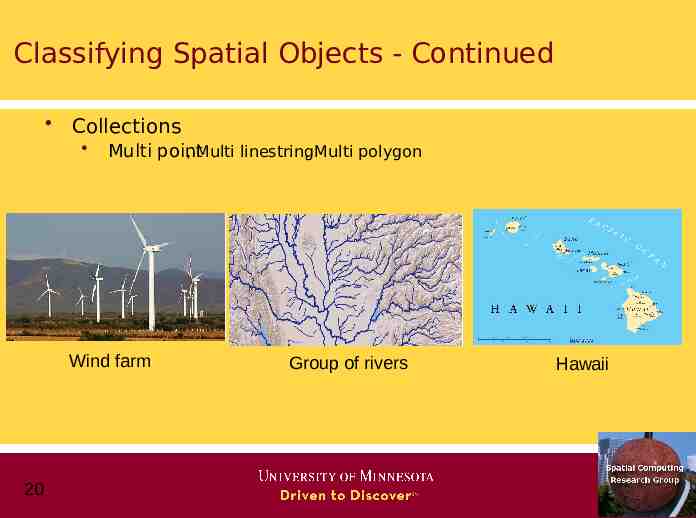
Classifying Spatial Objects - Continued Collections Multi point , Multi linestring , Multi polygon Wind farm 20 Group of rivers Hawaii
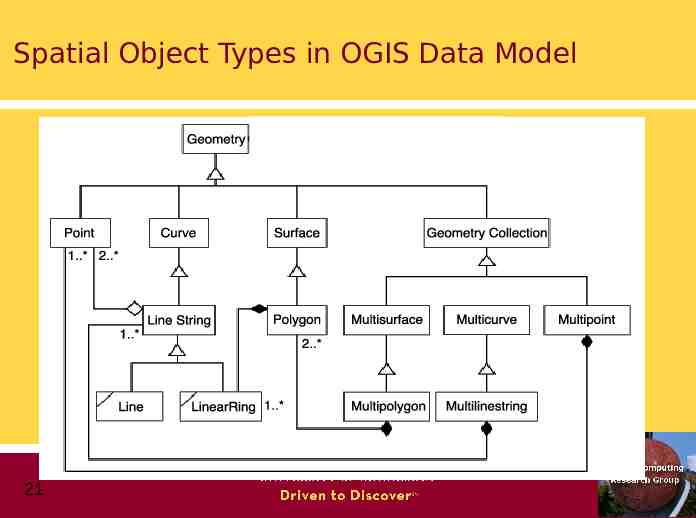
Spatial Object Types in OGIS Data Model 21
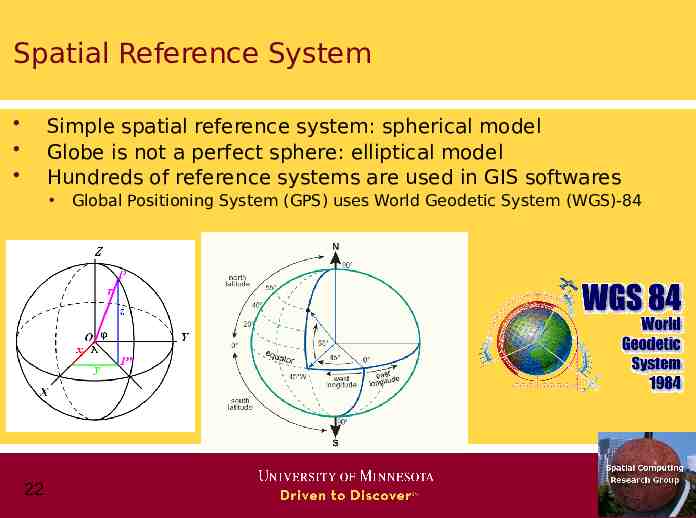
Spatial Reference System Simple spatial reference system: spherical model Globe is not a perfect sphere: elliptical model Hundreds of reference systems are used in GIS softwares 22 Global Positioning System (GPS) uses World Geodetic System (WGS)-84
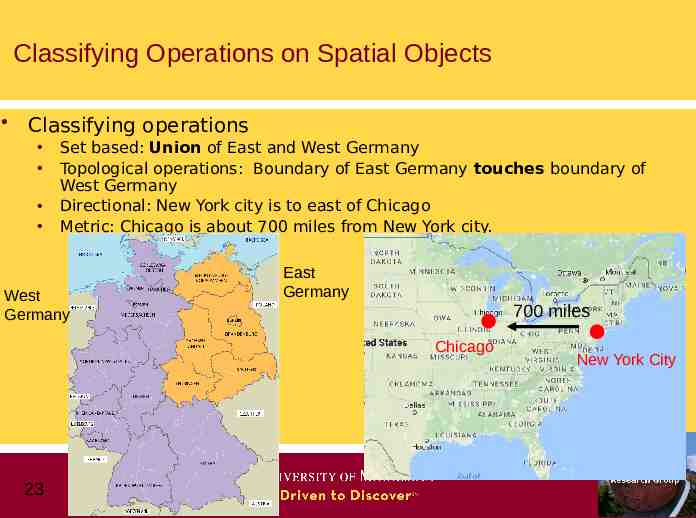
Classifying Operations on Spatial Objects Classifying operations Set based: Union of East and West Germany Topological operations: Boundary of East Germany touches boundary of West Germany Directional: New York city is to east of Chicago Metric: Chicago is about 700 miles from New York city. West Germany East Germany 700 miles Chicago 23 New York City
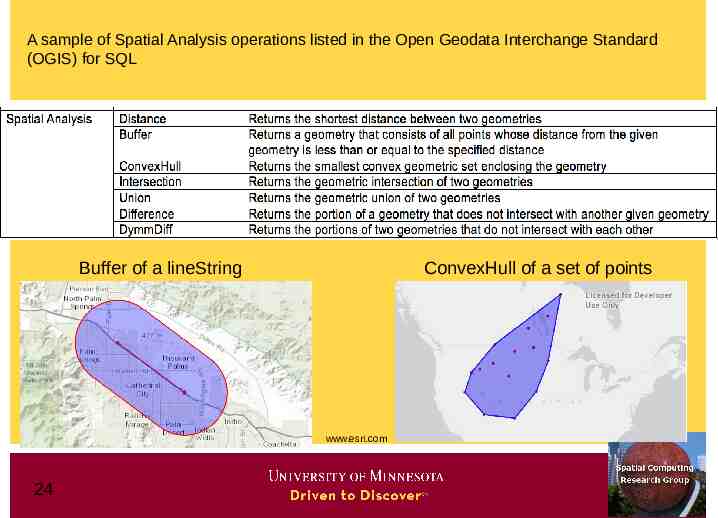
A sample of Spatial Analysis operations listed in the Open Geodata Interchange Standard (OGIS) for SQL Buffer of a lineString ConvexHull of a set of points www.esri.com 24
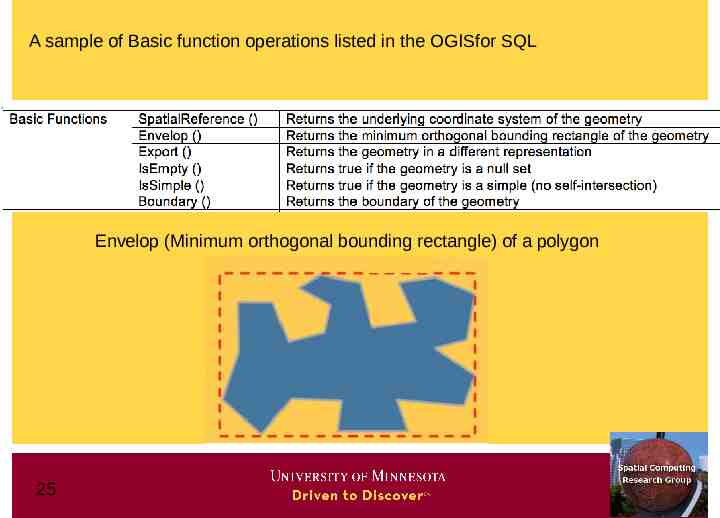
A sample of Basic function operations listed in the OGISfor SQL Envelop (Minimum orthogonal bounding rectangle) of a polygon 25
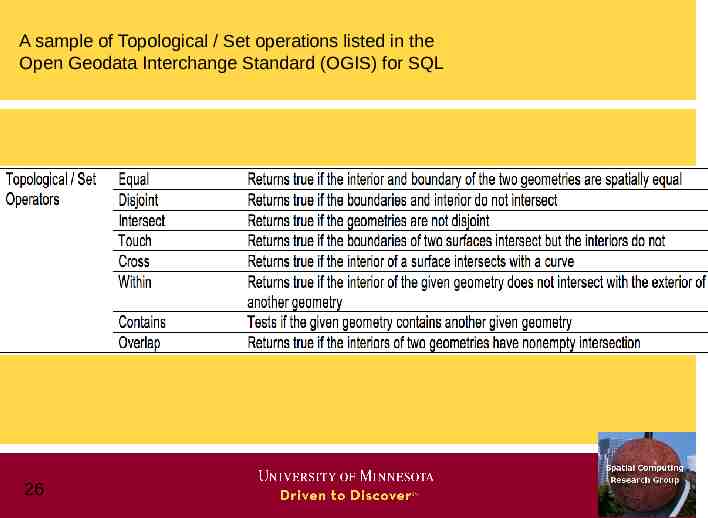
A sample of Topological / Set operations listed in the Open Geodata Interchange Standard (OGIS) for SQL 26
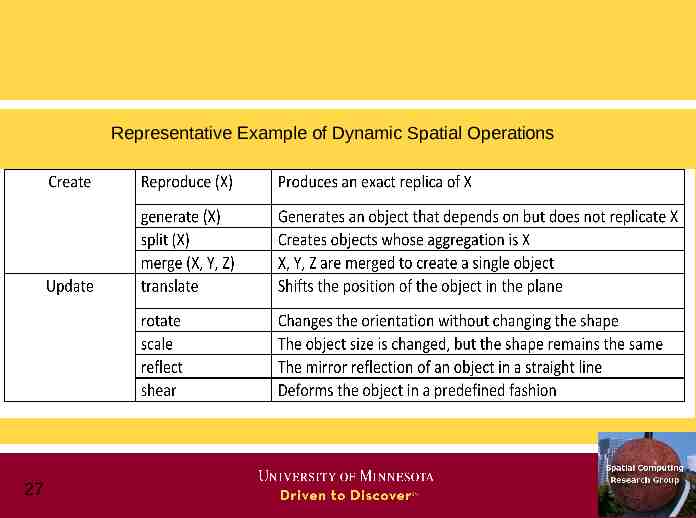
Representative Example of Dynamic Spatial Operations 27
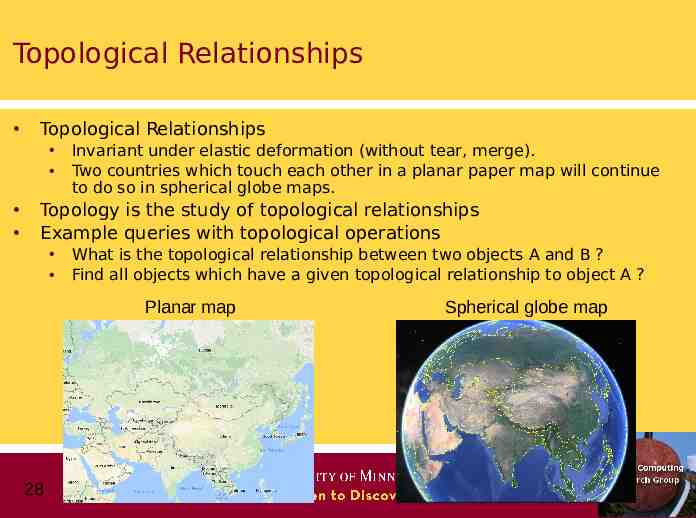
Topological Relationships Topological Relationships Invariant under elastic deformation (without tear, merge). Two countries which touch each other in a planar paper map will continue to do so in spherical globe maps. Topology is the study of topological relationships Example queries with topological operations What is the topological relationship between two objects A and B ? Find all objects which have a given topological relationship to object A ? Planar map 28 Spherical globe map
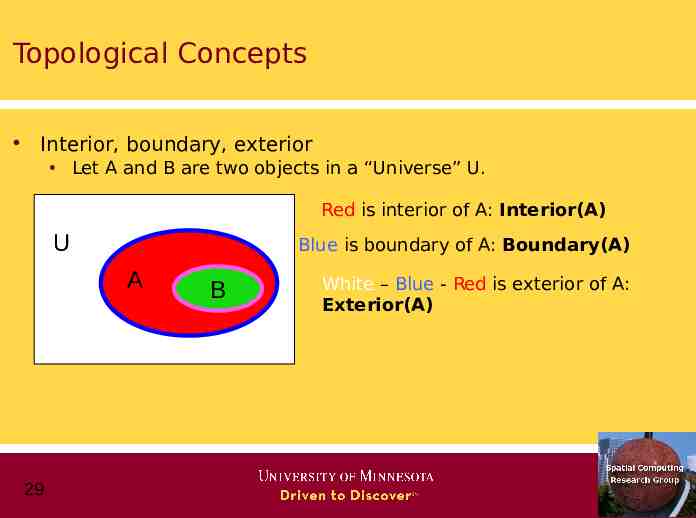
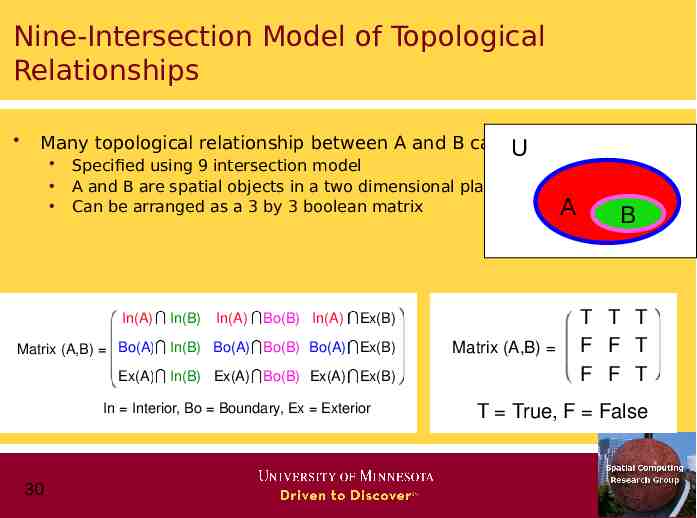
Topological Concepts Interior, boundary, exterior Let A and B are two objects in a “Universe” U. Red is interior of A: Interior(A) U Blue is boundary of A: Boundary(A) A 29 B White – Blue - Red is exterior of A: Exterior(A)
Nine-Intersection Model of Topological Relationships Many topological relationship between A and B can be U Specified using 9 intersection model A and B are spatial objects in a two dimensional plane. Can be arranged as a 3 by 3 boolean matrix In(A) In(B) In(A) Bo(B) In(A) Ex(B) Matrix (A,B) Bo(A) In(B) Bo(A) Bo(B) Bo(A) Ex(B) Ex(A) In(B) Ex(A) Bo(B) Ex(A) Ex(B) In Interior, Bo Boundary, Ex Exterior 30 Matrix (A,B) A B T T T F F T F F T T True, F False
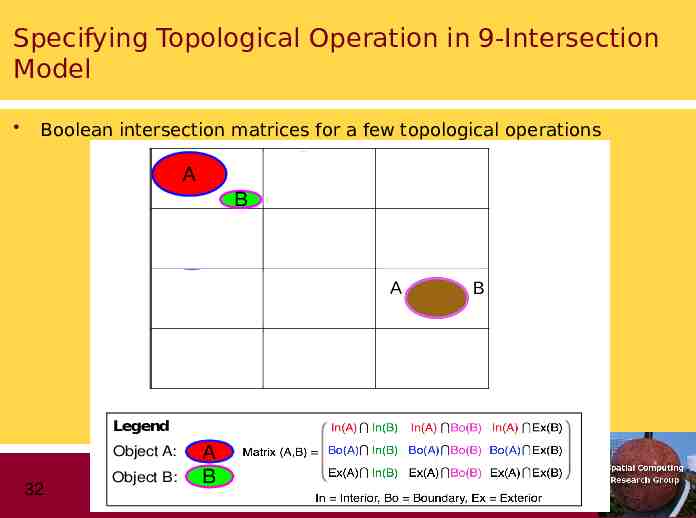
Specifying Topological Operation in 9-Intersection Model Boolean intersection matrices for a few topological operations A B B F F T A F T F T T T disjoint B T F F T T T T F T Covers Legend Object A: 32 Object B: A AA A B F F T F T T meet T T T A B T F F T T F T F T Contains T T T A T F F A B B T T T T T T Overlap T F F T T T T F T Covers 1 1 1 1 1 1 1 1 1 overlap B B F T F Equal F F T
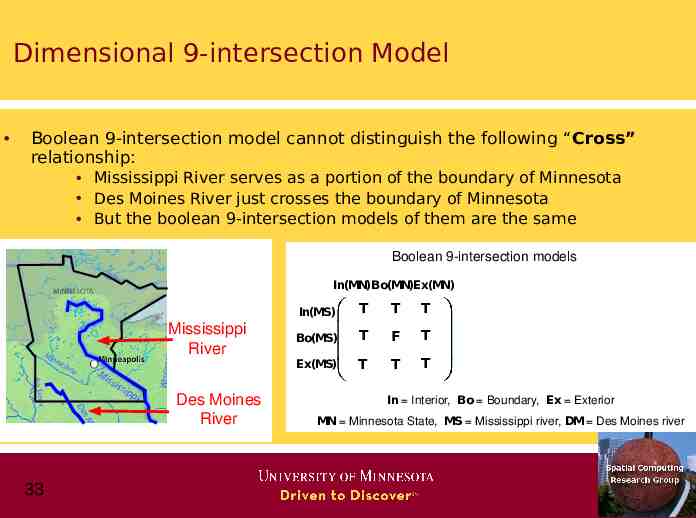
Dimensional 9-intersection Model Boolean 9-intersection model cannot distinguish the following “Cross” relationship: Mississippi River serves as a portion of the boundary of Minnesota Des Moines River just crosses the boundary of Minnesota But the boolean 9-intersection models of them are the same Boolean 9-intersection models In(MN)Bo(MN)Ex(MN) Mississippi River Des Moines River 33 In(MN)Bo(MN)Ex(MN) In(MS) T T T In(DM) T T T Bo(MS) T F T Bo(DM) T F T Ex(MS) T T T Ex(DM) T T T In Interior, Bo Boundary, Ex Exterior MN Minnesota State, MS Mississippi river, DM Des Moines river
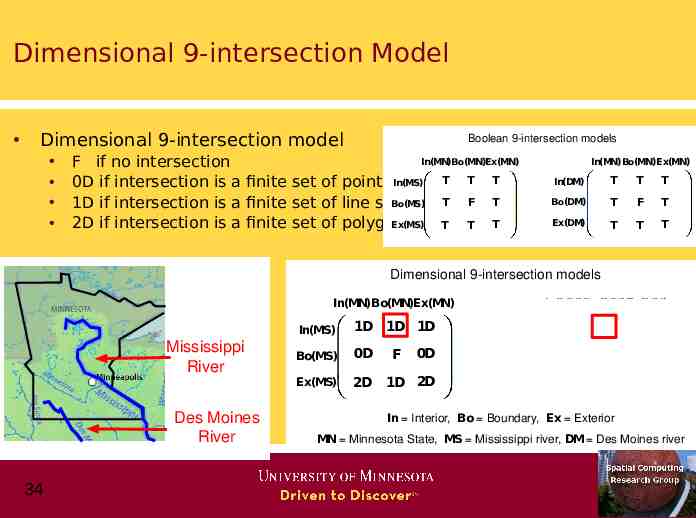
Dimensional 9-intersection Model Dimensional 9-intersection model Boolean 9-intersection models In(MN)Bo(MN)Ex(MN) F if no intersection 0D if intersection is a finite set of points In(MS) T T T T F T Bo(MS) 1D if intersection is a finite set of line strings Ex(MS) T 2D if intersection is a finite set of polygons T T In(MN)Bo(MN)Ex(MN) In(DM) T T T Bo(DM) T F T Ex(DM) T T T Dimensional 9-intersection models In(MN)Bo(MN)Ex(MN) Mississippi River Des Moines River 34 In(MN)Bo(MN)Ex(MN) In(MS) 1D 1D 1D In(DM) 1D 0D 1D Bo(MS) 0D 0D Bo(DM) 0D Ex(MS) T 1D T 2D 2D Ex(DM) 2D F F 0D 1D 2D In Interior, Bo Boundary, Ex Exterior MN Minnesota State, MS Mississippi river, DM Des Moines river
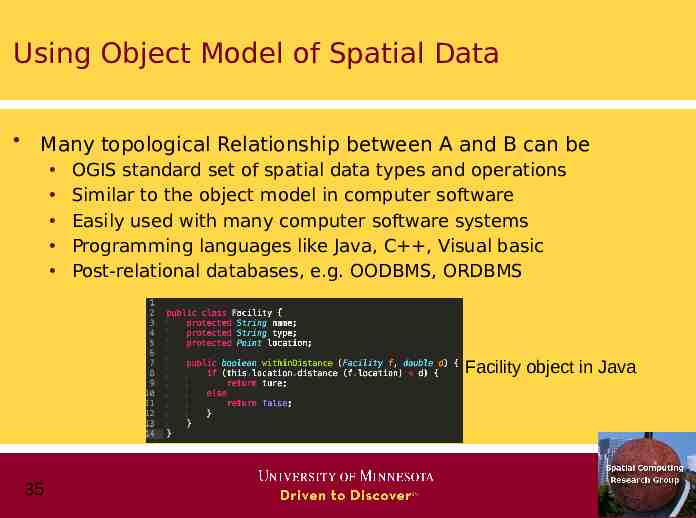
Using Object Model of Spatial Data Many topological Relationship between A and B can be OGIS standard set of spatial data types and operations Similar to the object model in computer software Easily used with many computer software systems Programming languages like Java, C , Visual basic Post-relational databases, e.g. OODBMS, ORDBMS Facility object in Java 35
END OF REQUIRED CONTENT
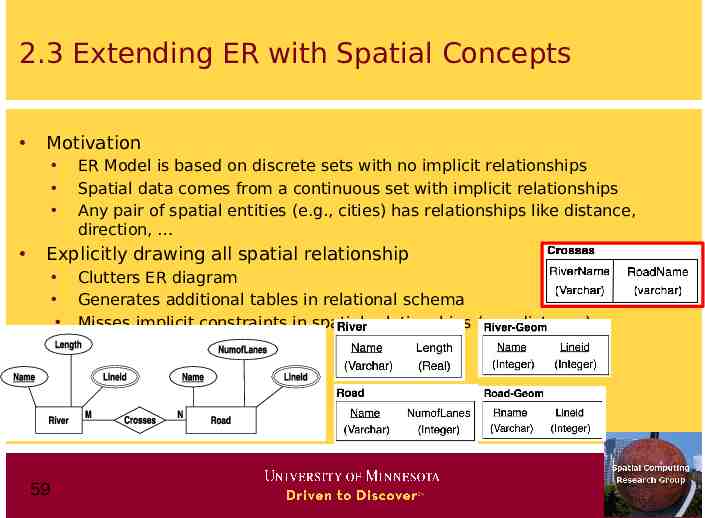
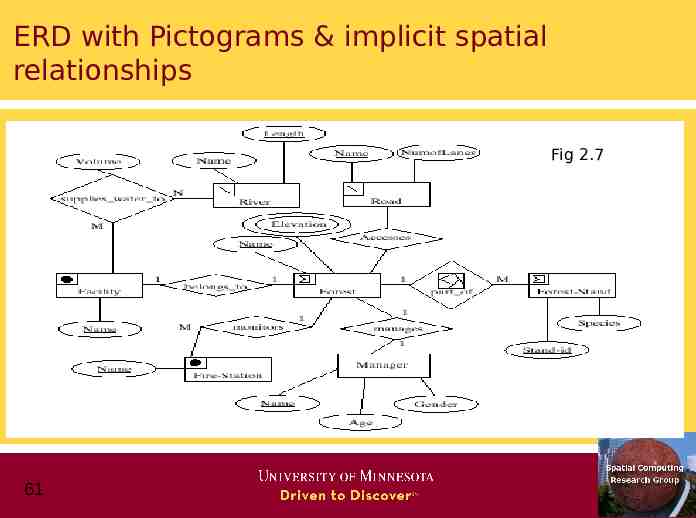
2.3 Extending ER with Spatial Concepts Motivation ER Model is based on discrete sets with no implicit relationships Spatial data comes from a continuous set with implicit relationships Any pair of spatial entities (e.g., cities) has relationships like distance, direction, Explicitly drawing all spatial relationship 59 Clutters ER diagram Generates additional tables in relational schema Misses implicit constraints in spatial relationships (e.g. distance)
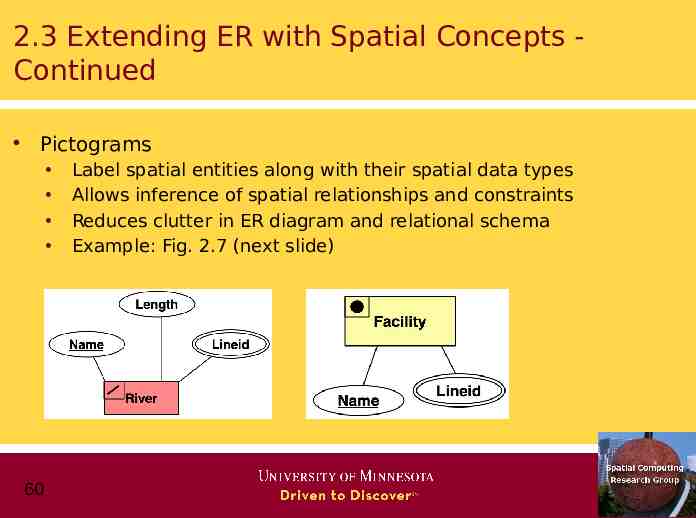
2.3 Extending ER with Spatial Concepts Continued Pictograms 60 Label spatial entities along with their spatial data types Allows inference of spatial relationships and constraints Reduces clutter in ER diagram and relational schema Example: Fig. 2.7 (next slide)
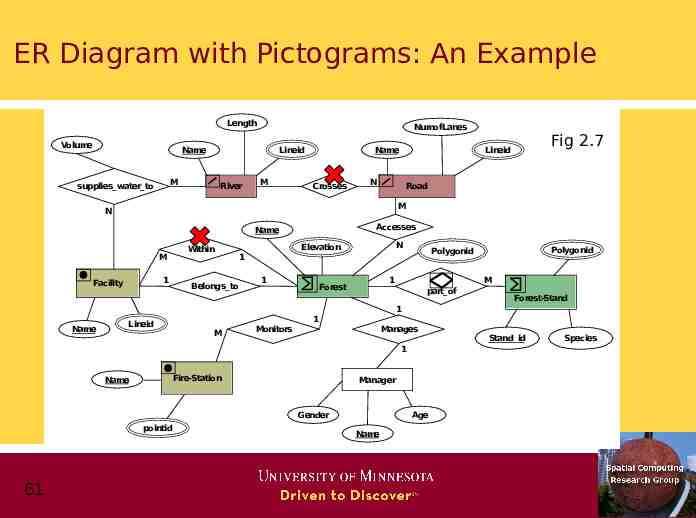
ER Diagram with Pictograms: An Example Length Volume NumofLanes Name Lineid M supplies water to River M Name Crosses Fig 2.7 Lineid N Road M N Accesses Name Within M 1 Facility Belongs to N Elevation 1 1 1 Forest Polygonid Polygonid M part of Forest-Stand 1 Name Lineid M Monitors 1 Manages 1 Name Fire-Station Manager Gender pointid 61 Age Name Stand id Species
ERD with Pictograms & implicit spatial relationships Fig 2.7 61
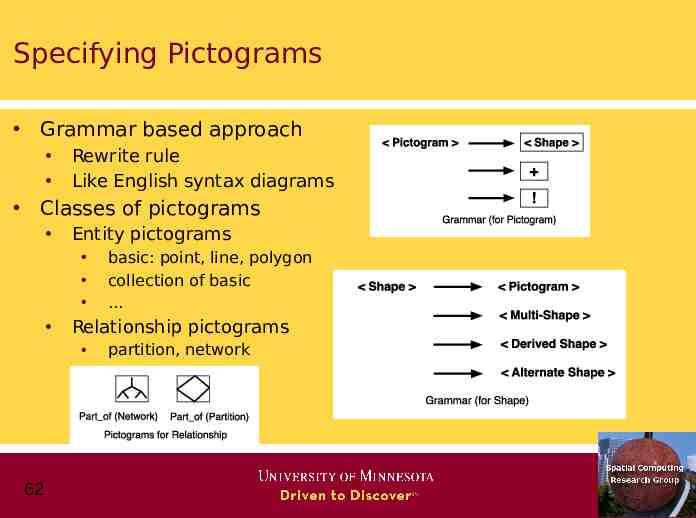
Specifying Pictograms Grammar based approach Rewrite rule Like English syntax diagrams Classes of pictograms Entity pictograms Relationship pictograms 62 basic: point, line, polygon collection of basic . partition, network
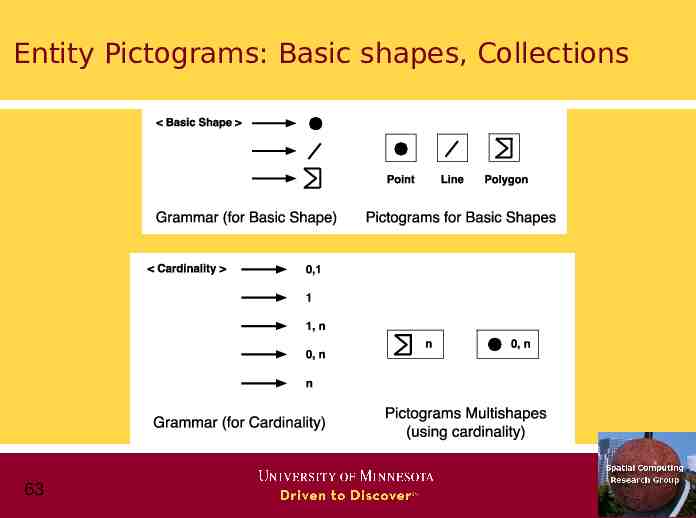
Entity Pictograms: Basic shapes, Collections 63
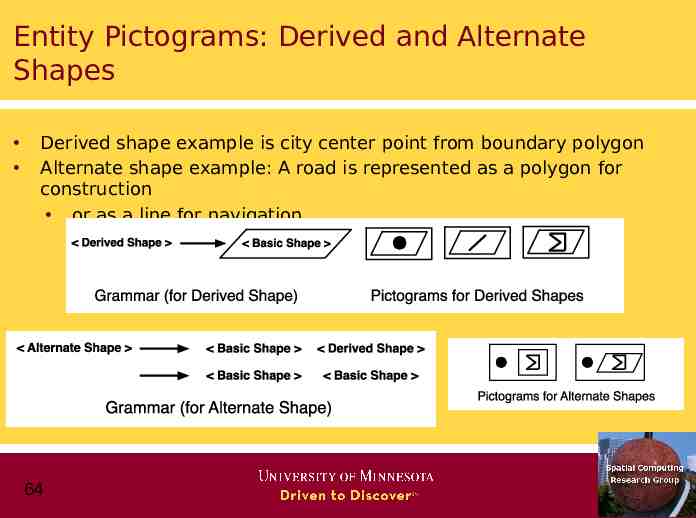
Entity Pictograms: Derived and Alternate Shapes Derived shape example is city center point from boundary polygon Alternate shape example: A road is represented as a polygon for construction or as a line for navigation 64
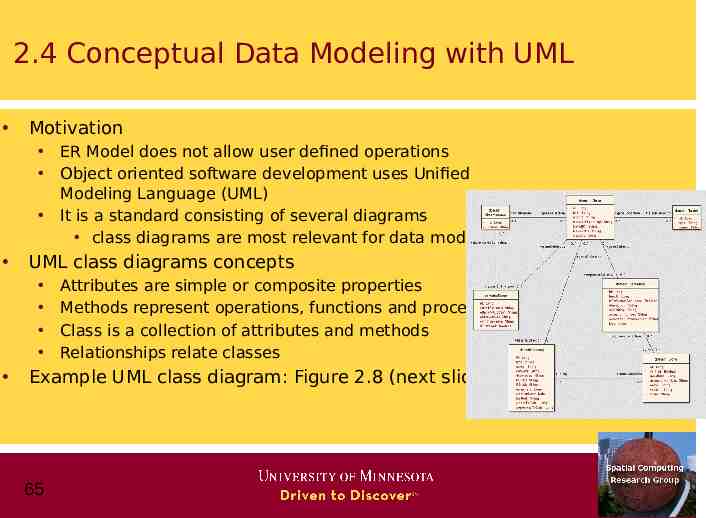
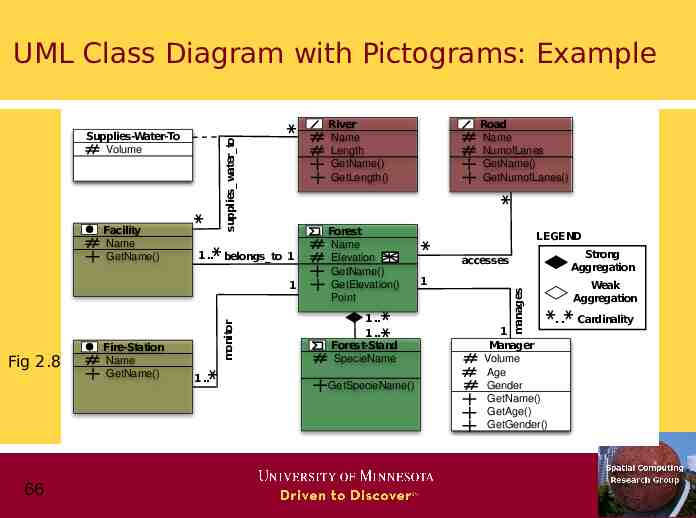
2.4 Conceptual Data Modeling with UML Motivation UML class diagrams concepts ER Model does not allow user defined operations Object oriented software development uses Unified Modeling Language (UML) It is a standard consisting of several diagrams class diagrams are most relevant for data modeling Attributes are simple or composite properties Methods represent operations, functions and procedures Class is a collection of attributes and methods Relationships relate classes Example UML class diagram: Figure 2.8 (next slide) 65
66 * 1 . GetSpecieName() Strong Aggregation accesses 1 Weak Aggregation * * 1 . 1 . Forest-Stand SpecieName LEGEND manages monitor Forest Name Elevation GetName() GetElevation() Point * Fig 2.8 Road Name NumofLanes GetName() GetNumofLanes() * 1 . belongs to 1 1 Fire-Station Name GetName() River Name Length GetName() GetLength() ** * Facility Name GetName() * Supplies-Water-To Volume supplies water to * UML Class Diagram with Pictograms: Example 1 Manager Volume Age Gender GetName() GetAge() GetGender() . Cardinality
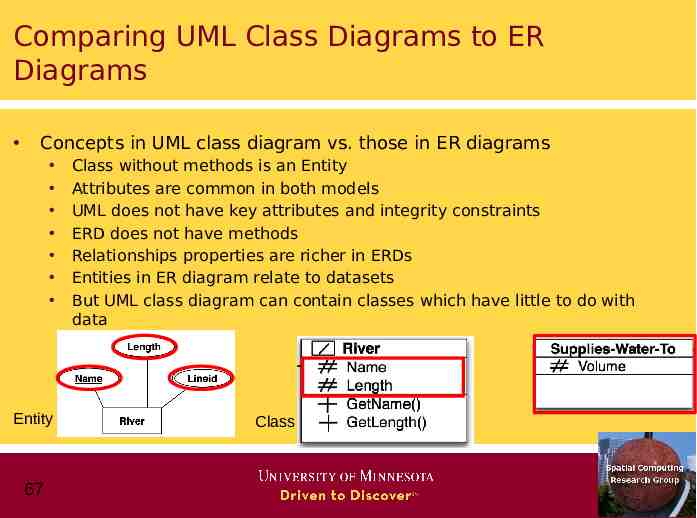
Comparing UML Class Diagrams to ER Diagrams Concepts in UML class diagram vs. those in ER diagrams Entity 67 Class without methods is an Entity Attributes are common in both models UML does not have key attributes and integrity constraints ERD does not have methods Relationships properties are richer in ERDs Entities in ER diagram relate to datasets But UML class diagram can contain classes which have little to do with data Class
Summary A data model is a high level description of the data It can help in early analysis of storage cost, data quality There are two popular models of spatial information Field based and Object based Database are designed in 3-steps Conceptual (ER), Logical (relational model) and Physical (indexing) Pictograms can simplify Conceptual data models 69