Should Introductory Statistics Classes Include Multifactor Statistical


66 Slides2.68 MB
Should Introductory Statistics Classes Include Multifactor Statistical Design of Experiments (DoE)? USCOTS 2021 Tuesday, June 29th 3:00-3:45pm ET David Fluharty Adjunct Professor of Statistics and Economics Ivy Tech Community College—Columbus IN [email protected] 1
Should Introductory Statistics Classes Include DoE? Discussion in a Beyond Session at USCOTS 2021 Tuesday, June 29th 3:00-3:45pm ET To Continue the Discussion and Possibly Form an “Early DoE” Community, Please Email me at [email protected] 2
Dave Fluharty Adjunct Professor of Statistics and Economics, Ivy Tech Community College—Columbus Indiana In 2020 completed 4 decades in motor vehicle industry working in statistics, forecasting, finance, economics, reliability, and training PhD, Educational Evaluation and Research, Wayne State University MA, International Relations, University of Chicago MBA, Business Economics and Finance, Booth School of Business, University of Chicago 2021 David A. Fluharty 3
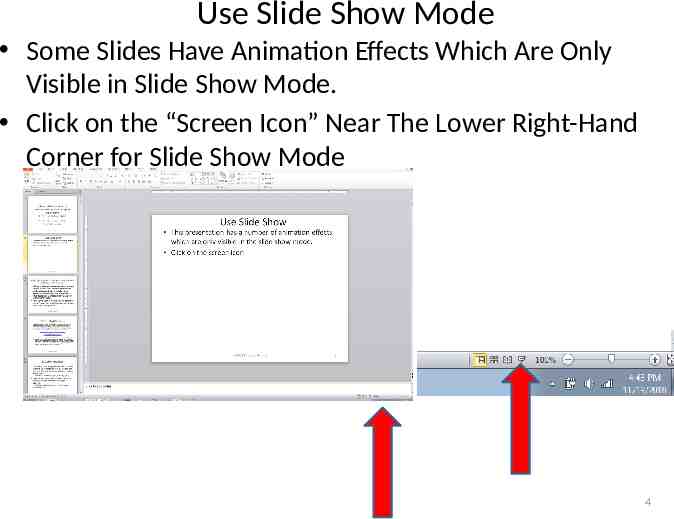
Use Slide Show Mode Some Slides Have Animation Effects Which Are Only Visible in Slide Show Mode. Click on the “Screen Icon” Near The Lower Right-Hand Corner for Slide Show Mode 4
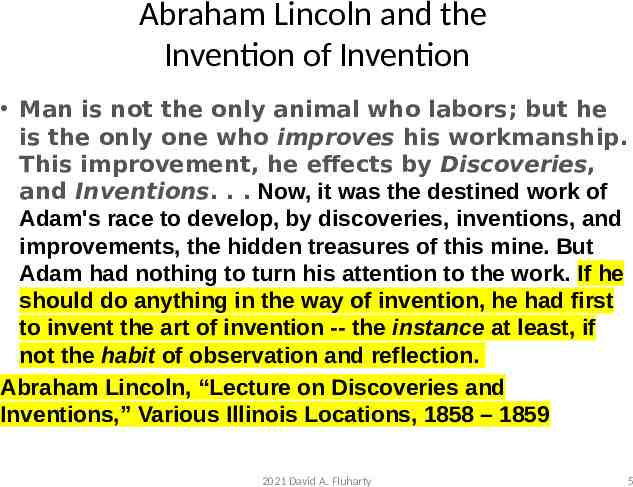
Abraham Lincoln and the Invention of Invention Man is not the only animal who labors; but he is the only one who improves his workmanship. This improvement, he effects by Discoveries, and Inventions. . . Now, it was the destined work of Adam's race to develop, by discoveries, inventions, and improvements, the hidden treasures of this mine. But Adam had nothing to turn his attention to the work. If he should do anything in the way of invention, he had first to invent the art of invention -- the instance at least, if not the habit of observation and reflection. Abraham Lincoln, “Lecture on Discoveries and Inventions,” Various Illinois Locations, 1858 – 1859 2021 David A. Fluharty 5
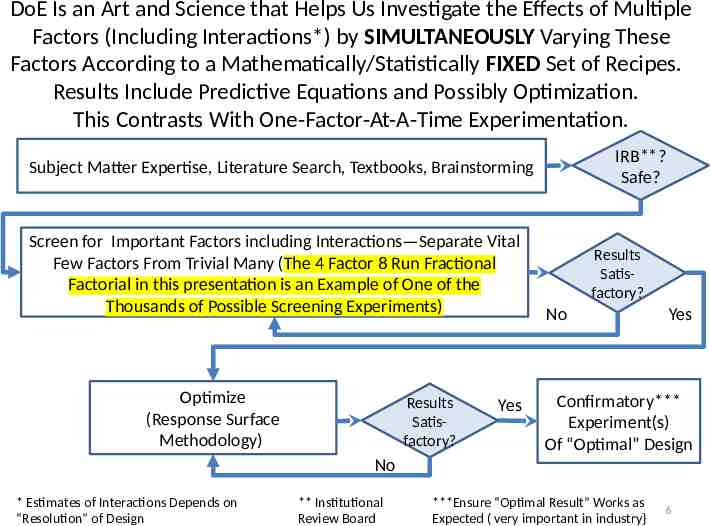
DoE Is an Art and Science that Helps Us Investigate the Effects of Multiple Factors (Including Interactions*) by SIMULTANEOUSLY Varying These Factors According to a Mathematically/Statistically FIXED Set of Recipes. Results Include Predictive Equations and Possibly Optimization. This Contrasts With One-Factor-At-A-Time Experimentation. IRB**? Safe? Subject Matter Expertise, Literature Search, Textbooks, Brainstorming Screen for Important Factors including Interactions—Separate Vital Few Factors From Trivial Many (The 4 Factor 8 Run Fractional Factorial in this presentation is an Example of One of the Thousands of Possible Screening Experiments) Optimize (Response Surface Methodology) Results Satisfactory? Yes Results Satisfactory? No Yes Confirmatory*** Experiment(s) Of “Optimal” Design No * Estimates of Interactions Depends on “Resolution” of Design ** Institutional (c) 2021 David A. Fluharty Review Board ***Ensure “Optimal Result” Works as Expected ( very important in industry} 6
Many People Who Learn DoE Learn it in a Graduate Level Course or 3-5 Day Seminar 7
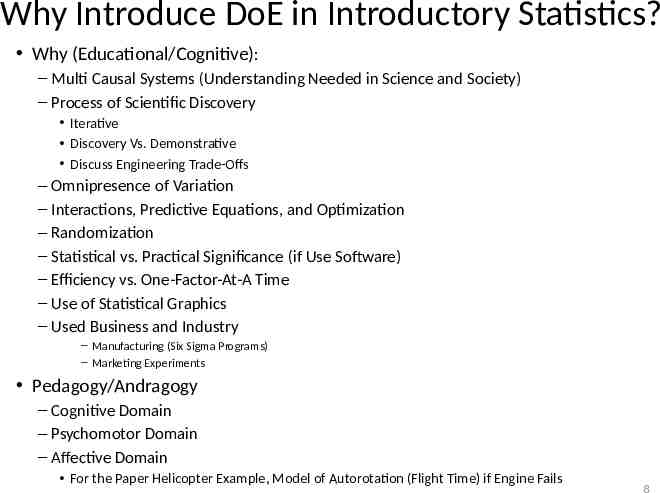
Why Introduce DoE in Introductory Statistics? Why (Educational/Cognitive): – Multi Causal Systems (Understanding Needed in Science and Society) – Process of Scientific Discovery Iterative Discovery Vs. Demonstrative Discuss Engineering Trade-Offs – Omnipresence of Variation – Interactions, Predictive Equations, and Optimization – Randomization – Statistical vs. Practical Significance (if Use Software) – Efficiency vs. One-Factor-At-A Time – Use of Statistical Graphics – Used Business and Industry – Manufacturing (Six Sigma Programs) – Marketing Experiments Pedagogy/Andragogy – Cognitive Domain – Psychomotor Domain – Affective Domain For the Paper Helicopter Example, Model of Autorotation (Flight Time) if Engine Fails 8
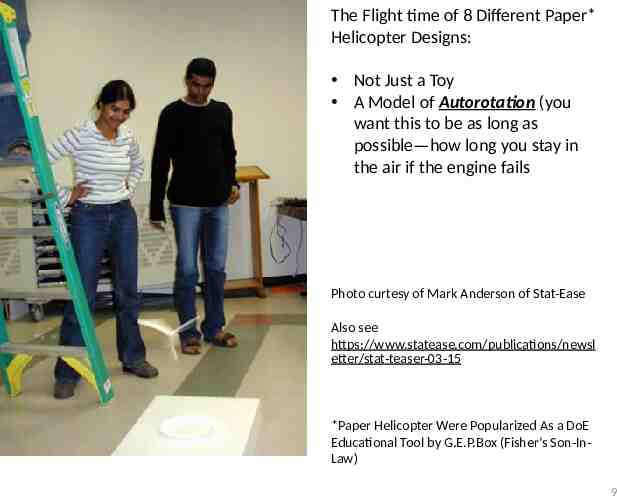
The Flight time of 8 Different Paper* Helicopter Designs: Not Just a Toy A Model of Autorotation (you want this to be as long as possible—how long you stay in the air if the engine fails Photo curtesy of Mark Anderson of Stat-Ease Also see https://www.statease.com/publications/newsl etter/stat-teaser-03-15 *Paper Helicopter Were Popularized As a DoE Educational Tool by G.E.P.Box (Fisher’s Son-InLaw) 9
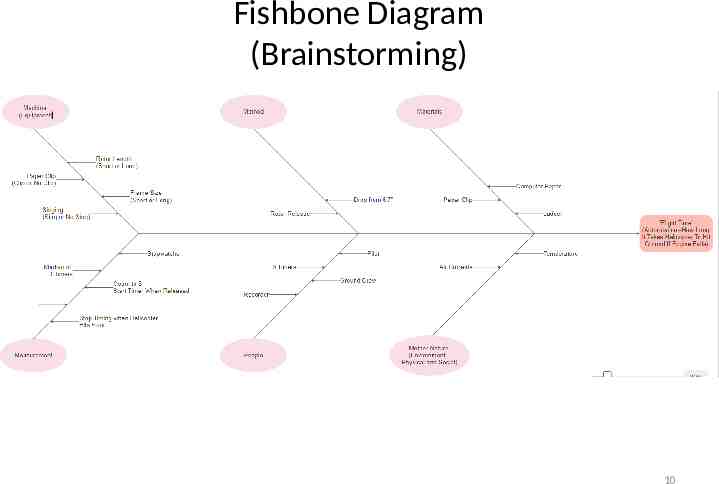
Fishbone Diagram (Brainstorming) 10
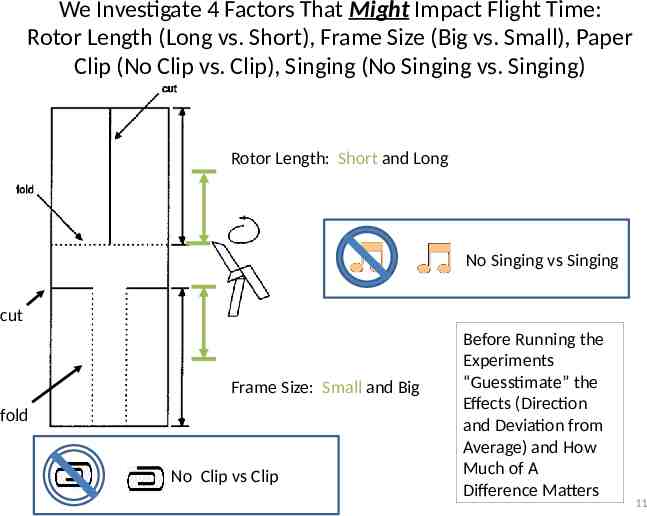
We Investigate 4 Factors That Might Impact Flight Time: Rotor Length (Long vs. Short), Frame Size (Big vs. Small), Paper Clip (No Clip vs. Clip), Singing (No Singing vs. Singing) Rotor Length: Short and Long No Singing vs Singing cut Frame Size: Small and Big fold No Clip vs Clip Before Running the Experiments “Guesstimate” the Effects (Direction and Deviation from Average) and How Much of A Difference Matters 11
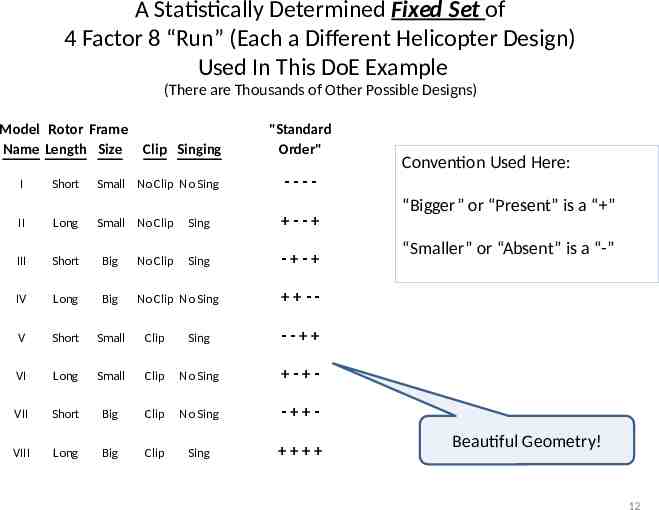
A Statistically Determined Fixed Set of 4 Factor 8 “Run” (Each a Different Helicopter Design) Used In This DoE Example (There are Thousands of Other Possible Designs) Model Rotor Frame Name Length Size I Short Clip Singing "Standard Order" Small No Clip No Sing ---- Small No Clip Sing -- Sing - - II Long III Short Big No Clip IV Long Big No Clip No Sing V Short Small Clip Sing -- VI Long Small Clip No Sing - - VII Short Big Clip No Sing - - VIII Long Big Clip Sing Convention Used Here: “Bigger” or “Present” is a “ ” “Smaller” or “Absent” is a “-” -- Beautiful Geometry! 12
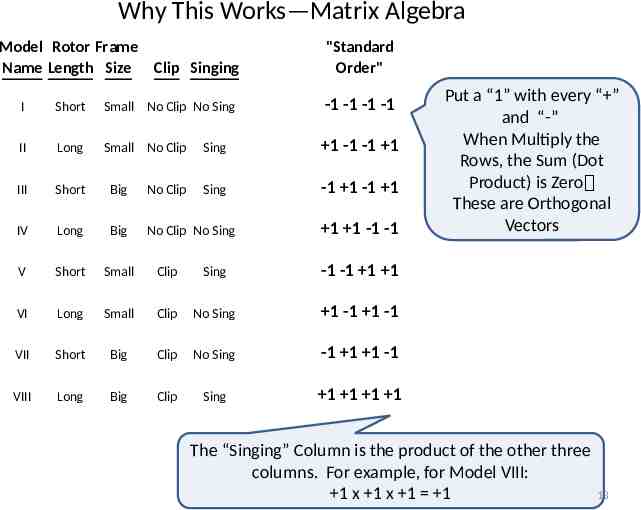
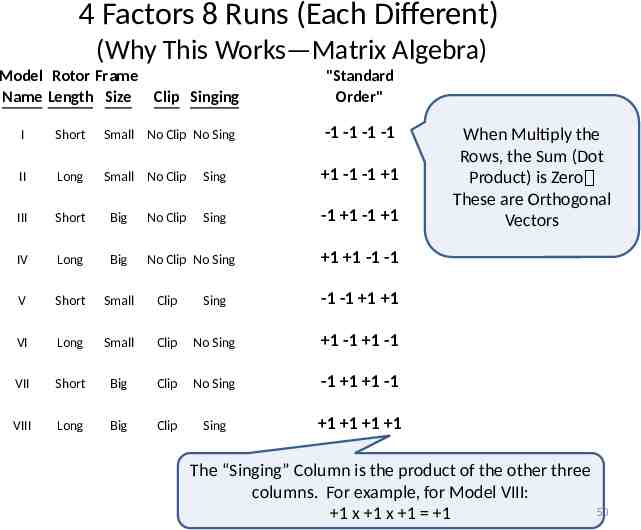
Why This Works—Matrix Algebra Model Rotor Frame Name Length Size Clip Singing "Standard Order" I Short Small No Clip No Sing -1 -1 -1 -1 II Long Small No Clip Sing 1 -1 -1 1 III Short Big No Clip Sing -1 1 -1 1 IV Long Big No Clip No Sing V Short Small Clip Sing -1 -1 1 1 VI Long Small Clip No Sing 1 -1 1 -1 VII Short Big Clip No Sing -1 1 1 -1 VIII Long Big Clip Sing 1 1 1 1 1 1 -1 -1 Put a “1” with every “ ” and “-” When Multiply the Rows, the Sum (Dot Product) is Zero These are Orthogonal Vectors The “Singing” Column is the product of the other three columns. For example, for Model VIII: 1 x 1 x 1 1 13
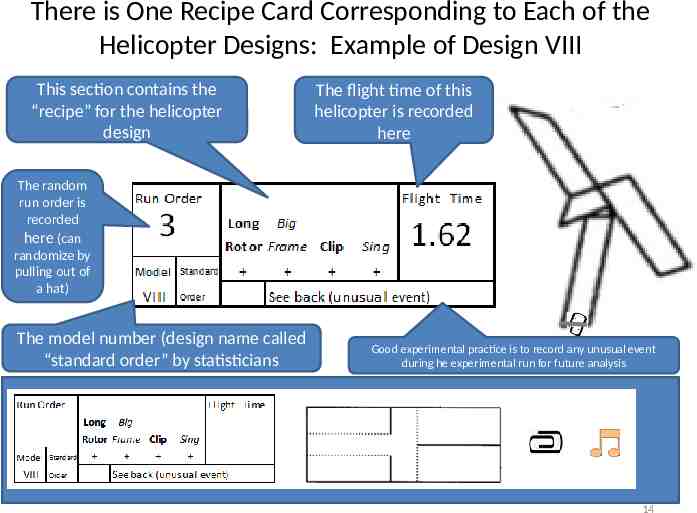
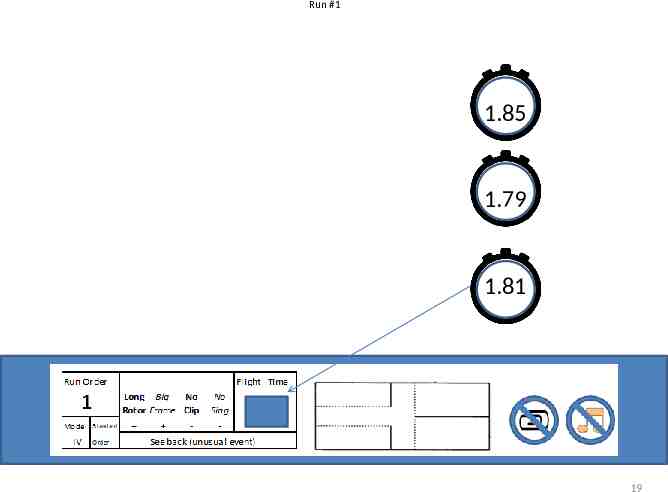
There is One Recipe Card Corresponding to Each of the Helicopter Designs: Example of Design VIII This section contains the “recipe” for the helicopter design The flight time of this helicopter is recorded here The random run order is recorded here (can randomize by pulling out of a hat) The model number (design name called “standard order” by statisticians Good experimental practice is to record any unusual event during he experimental run for future analysis 14
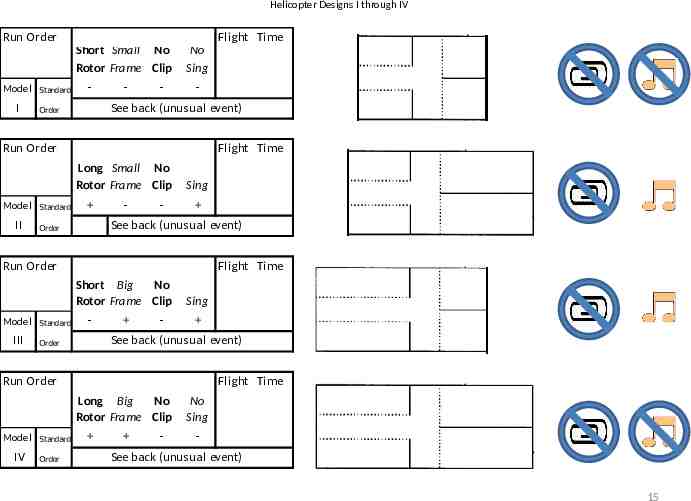
Helicopter Designs I through IV Run Order Flight Time Short Small No Rotor Frame Clip Model I Standard - - - No Sing - See back (unusual event) Order Run Order Flight Time Long Small No Rotor Frame Clip Model II Standard - - Sing See back (unusual event) Order Run Order Flight Time Short Big No Rotor Frame Clip Model III Standard - - Sing See back (unusual event) Order Run Order Flight Time Long Big No Rotor Frame Clip Model IV Standard Order - No Sing - See back (unusual event) 15
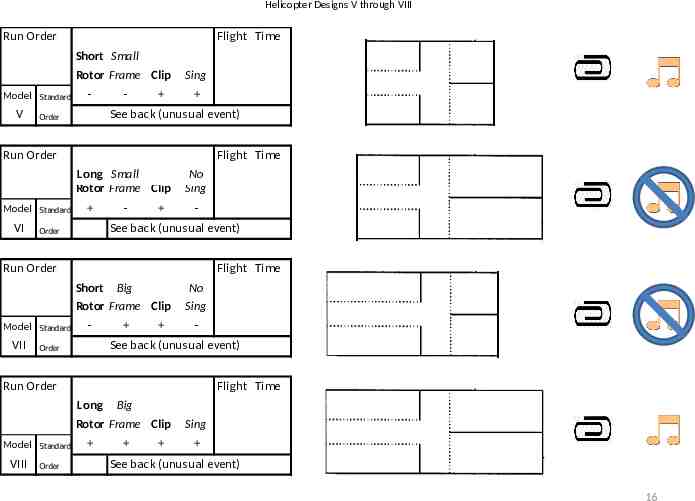
Helicopter Designs V through VIII Run Order Flight Time Short Small Rotor Frame Clip Model V Standard - - Sing See back (unusual event) Order Run Order Flight Time Long Small Rotor Frame Clip Model VI Standard - No Sing - See back (unusual event) Order Run Order Flight Time Short Big Rotor Frame Clip Model VII Standard - No Sing - See back (unusual event) Order Run Order Flight Time Long Big Rotor Frame Clip Model VIII Standard Order Sing See back (unusual event) 16
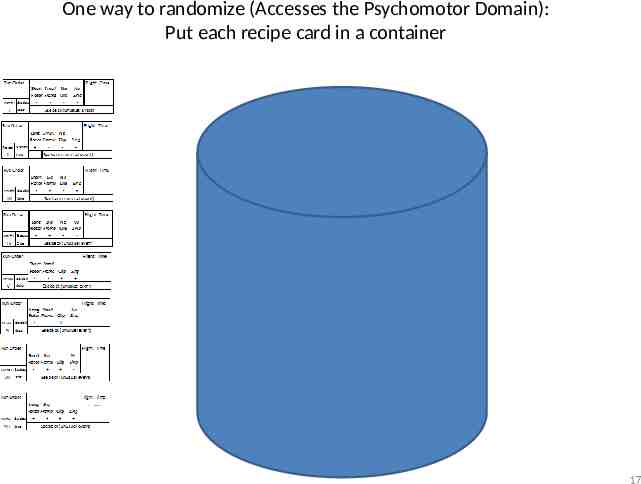
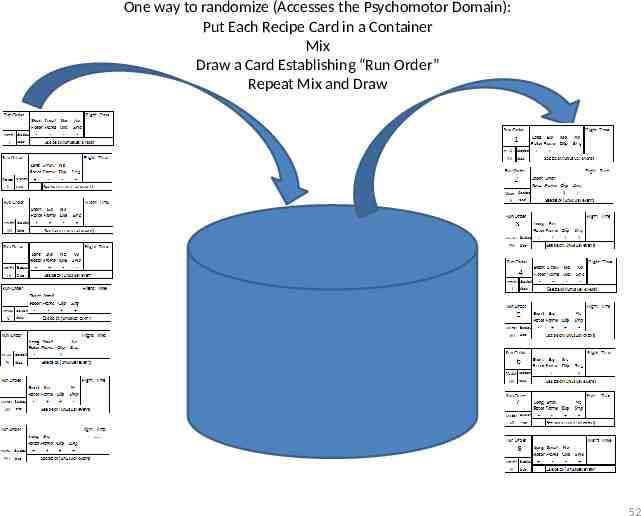
One way to randomize (Accesses the Psychomotor Domain): Put each recipe card in a container v 17
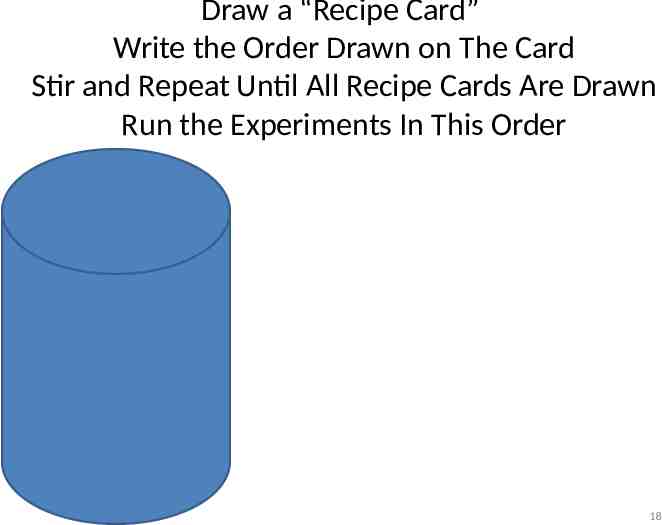
Draw a “Recipe Card” Write the Order Drawn on The Card Stir and Repeat Until All Recipe Cards Are Drawn Run the Experiments In This Order 18
Run #1 1.85 1.79 1.81 19
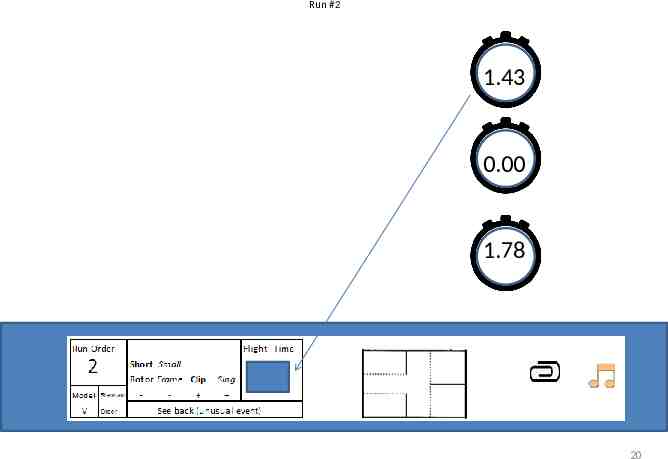
Run #2 1.43 0.00 1.78 20
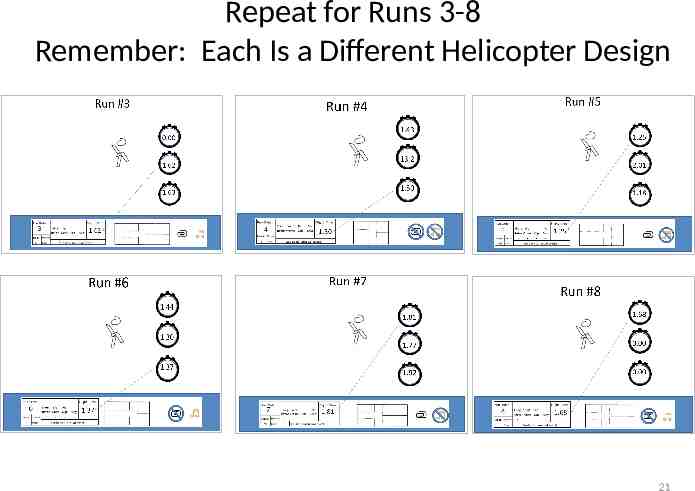
Repeat for Runs 3-8 Remember: Each Is a Different Helicopter Design 21
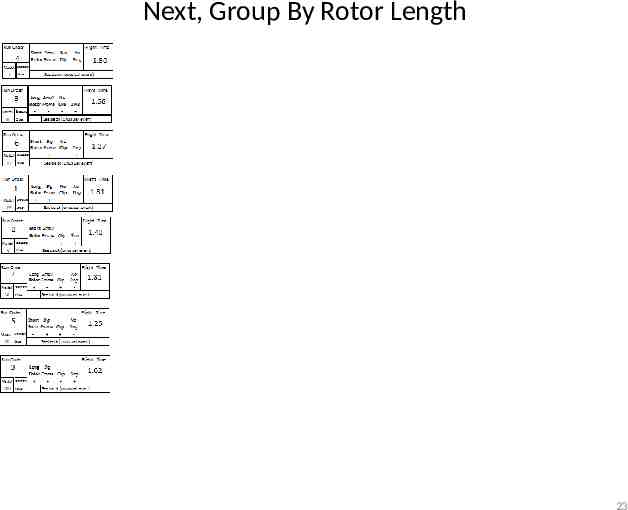
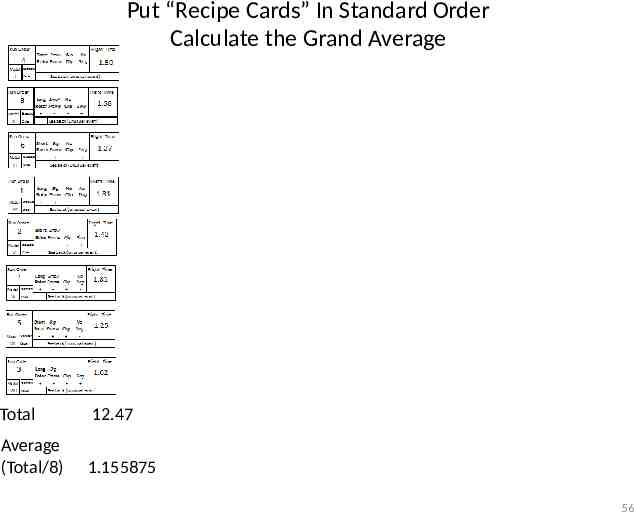
Put “Recipe Cards” In Standard Order Calculate the Grand Average Total 12.47 Average (Total/8) 1.155875 22
Next, Group By Rotor Length 23
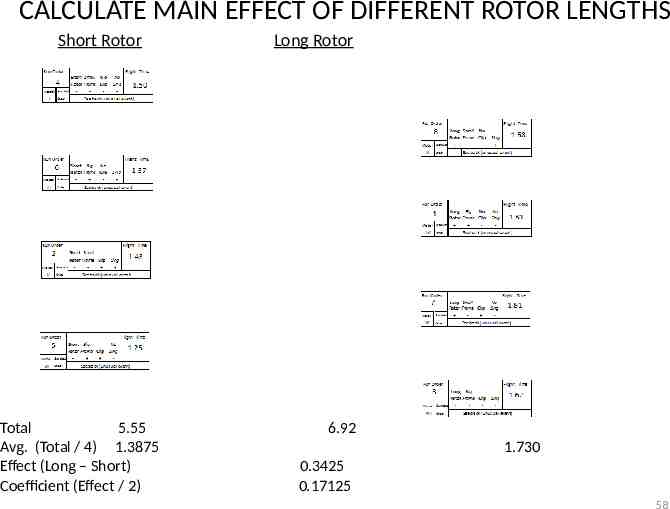
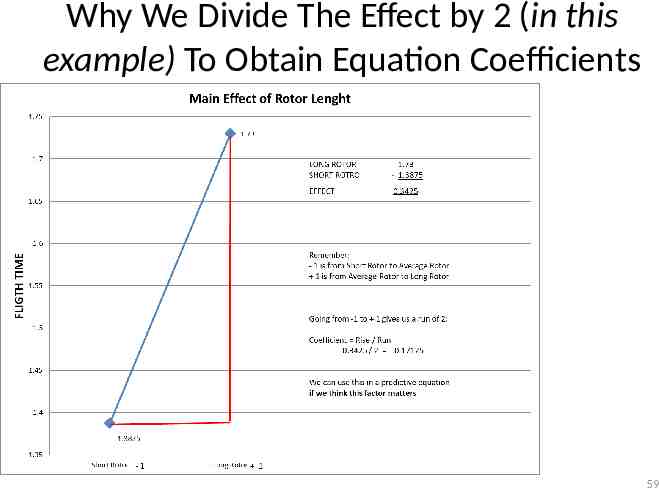
CALCULATE MAIN EFFECT OF DIFFERENT ROTOR LENGTHS Short Rotor Total 5.55 Avg. (Total / 4) 1.3875 Effect (Long – Short) Coefficient (Effect / 2) Long Rotor 6.92 1.730 0.3425 0.17125 24
Why We Divide The Effect by 2 (in this example) To Obtain Equation Coefficients 25
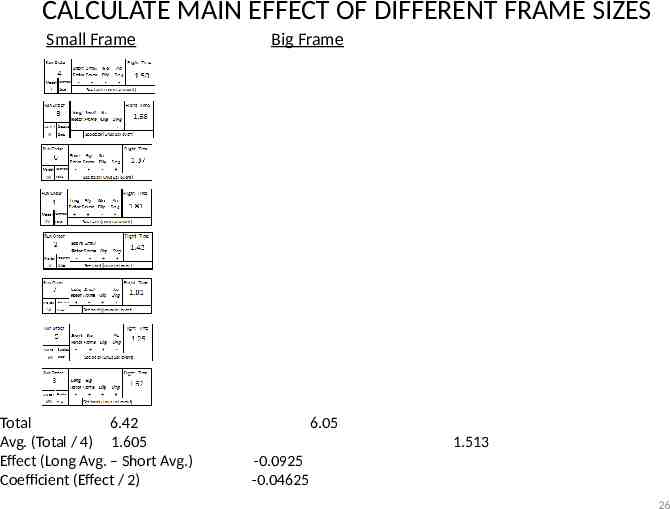
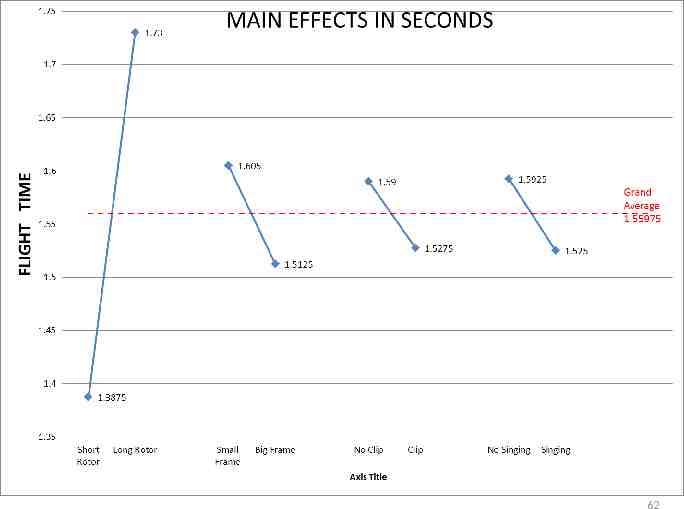
CALCULATE MAIN EFFECT OF DIFFERENT FRAME SIZES Small Frame Total 6.42 Avg. (Total / 4) 1.605 Effect (Long Avg. – Short Avg.) Coefficient (Effect / 2) Big Frame 6.05 1.513 -0.0925 -0.04625 26
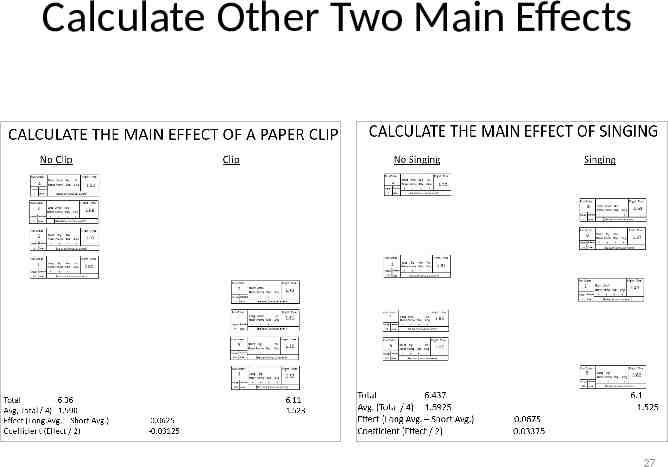
Calculate Other Two Main Effects 27
28
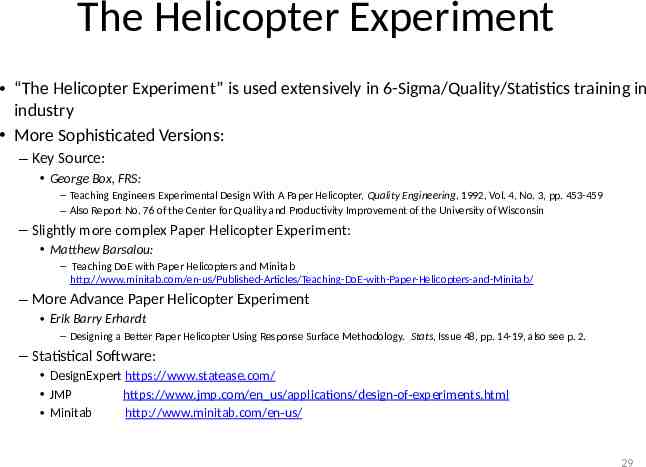
The Helicopter Experiment “The Helicopter Experiment” is used extensively in 6-Sigma/Quality/Statistics training in industry More Sophisticated Versions: – Key Source: George Box, FRS: – Teaching Engineers Experimental Design With A Paper Helicopter, Quality Engineering, 1992, Vol. 4, No. 3, pp. 453-459 – Also Report No. 76 of the Center for Quality and Productivity Improvement of the University of Wisconsin – Slightly more complex Paper Helicopter Experiment: Matthew Barsalou: – Teaching DoE with Paper Helicopters and Minitab http://www.minitab.com/en-us/Published-Articles/Teaching-DoE-with-Paper-Helicopters-and-Minitab/ – More Advance Paper Helicopter Experiment Erik Barry Erhardt – Designing a Better Paper Helicopter Using Response Surface Methodology. Stats, Issue 48, pp. 14-19, also see p. 2. – Statistical Software: DesignExpert https://www.statease.com/ JMP https://www.jmp.com/en us/applications/design-of-experiments.html Minitab http://www.minitab.com/en-us/ 29
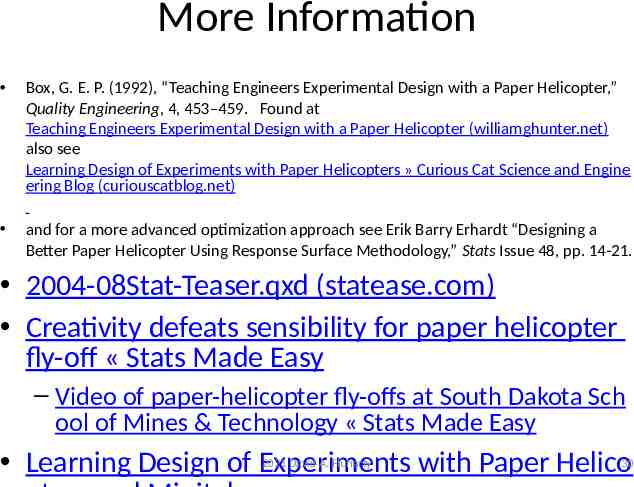
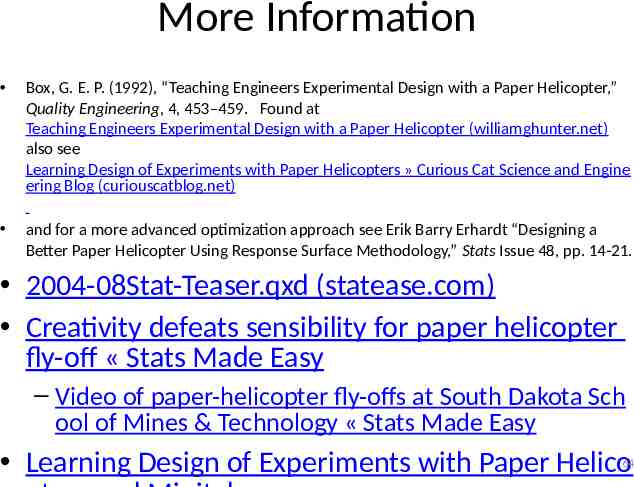
More Information Box, G. E. P. (1992), “Teaching Engineers Experimental Design with a Paper Helicopter,” Quality Engineering, 4, 453–459. Found at Teaching Engineers Experimental Design with a Paper Helicopter (williamghunter.net) also see Learning Design of Experiments with Paper Helicopters » Curious Cat Science and Engine ering Blog (curiouscatblog.net) and for a more advanced optimization approach see Erik Barry Erhardt “Designing a Better Paper Helicopter Using Response Surface Methodology,” Stats Issue 48, pp. 14-21. 2004-08Stat-Teaser.qxd (statease.com) Creativity defeats sensibility for paper helicopter fly-off « Stats Made Easy – Video of paper-helicopter fly-offs at South Dakota Sch ool of Mines & Technology « Stats Made Easy Learning Design of Experiments with Paper Helico 2021 David A. Fluharty 30
Discussion Should Introductory Statistics Students See a Demonstration—or Preferably Participate in the Planning, Execution, and Analysis—of a Simplified Multifactor Statistically Design of Experiments (DoE)? What About Students Who Do Not Take Stat 101? Is the Recipe Card Approach A Good Example of How To Introduce DoE? – How Can It Be Improved? Are You Interested In Continuing the Conversation? – [email protected] 31
Appendix I SOFTWARE IMPLEMENTATION 32
Using Software for DoE Software: Among the Statistical Software Programs With Extensive DoE Implementations Are the Following: – Minitab (Used In This Example, USCOTS 2021 Sponson) – JMP(USCOTS 2021 Sponson) – SAS (USCOTS 2021 Sponson) – StatEase Design Expert (Specialized DoE Software) This Example Is an Intermediate Model to Show Interaction – Most Experimenters Would Develop A Reduced Model Which Would Probably Not Include Interaction and Several Other Terms David A. Fluharty 33
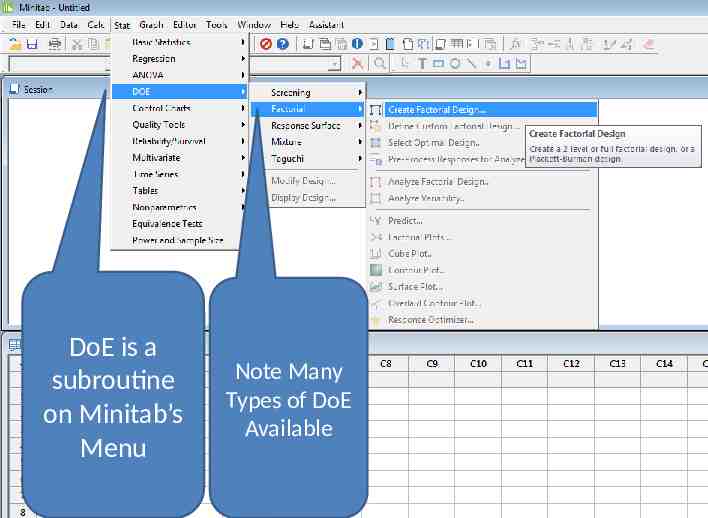
DoE is a subroutine on Minitab’s Menu Note Many Types of DoE Available 2021 David A. Fluharty 34
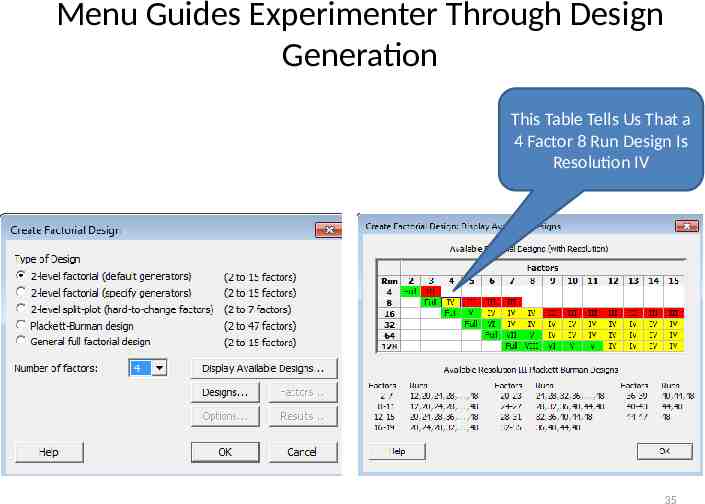
Menu Guides Experimenter Through Design Generation This Table Tells Us That a 4 Factor 8 Run Design Is Resolution IV 35
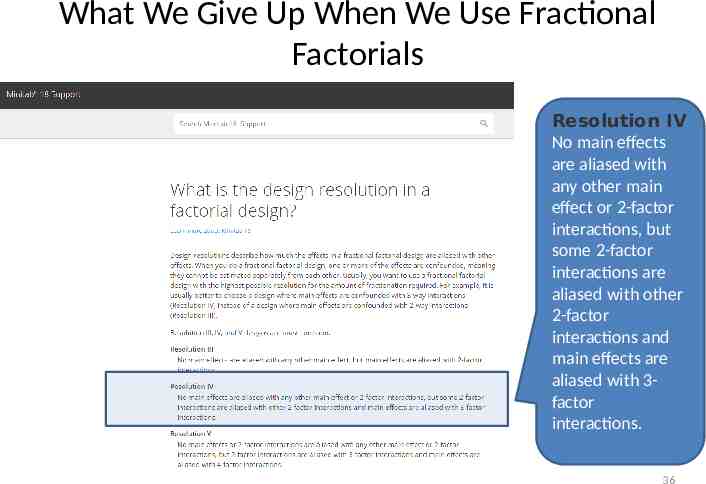
What We Give Up When We Use Fractional Factorials Resolution IV No main effects are aliased with any other main effect or 2-factor interactions, but some 2-factor interactions are aliased with other 2-factor interactions and main effects are aliased with 3factor interactions. 36
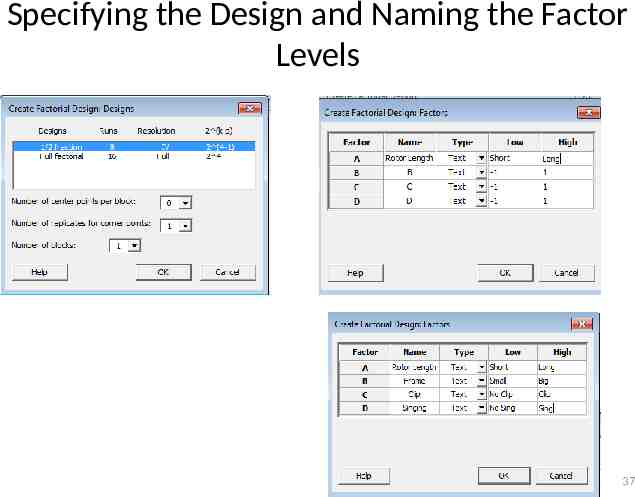
Specifying the Design and Naming the Factor Levels 37
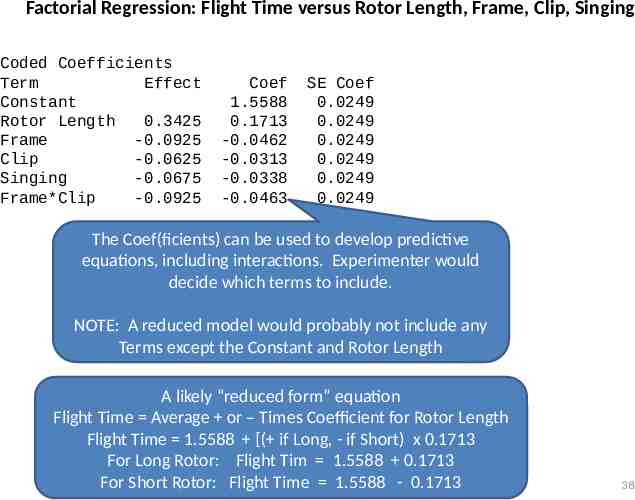
Factorial Regression: Flight Time versus Rotor Length, Frame, Clip, Singing Coded Coefficients Term Effect Constant Rotor Length 0.3425 Frame -0.0925 Clip -0.0625 Singing -0.0675 Frame*Clip -0.0925 Coef 1.5588 0.1713 -0.0462 -0.0313 -0.0338 -0.0463 SE Coef 0.0249 0.0249 0.0249 0.0249 0.0249 0.0249 The Coef(ficients) can be used to develop predictive equations, including interactions. Experimenter would decide which terms to include. NOTE: A reduced model would probably not include any Terms except the Constant and Rotor Length A likely “reduced form” equation Flight Time Average or – Times Coefficient for Rotor Length Flight Time 1.5588 [( if Long, - if Short) x 0.1713 For Long Rotor: Flight Tim 1.5588 0.1713 For Short Rotor: Flight Time 1.5588 - 0.1713 38
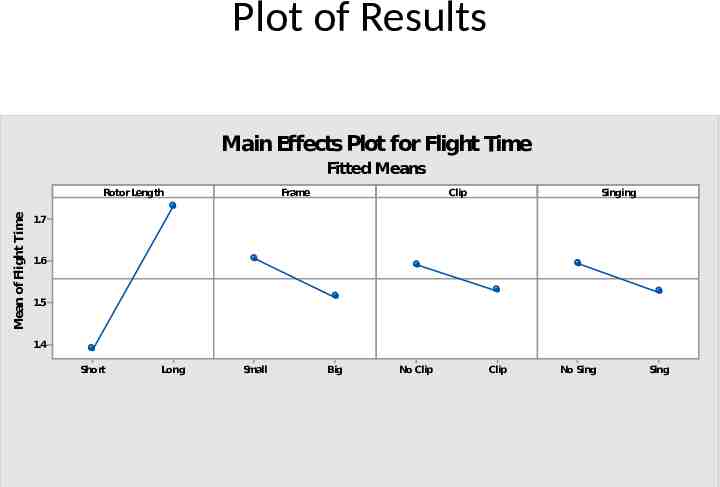
Plot of Results Main Effects Plot for Flight Time Fitted Means Mean of Flight Time Rotor Length Frame Clip Singing 1.7 1.6 1.5 1.4 Short Long Small Big No Clip Clip No Sing Sing 39
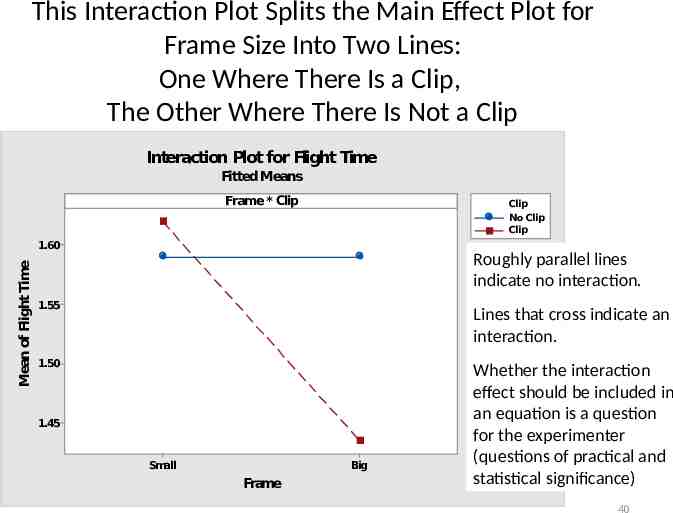
This Interaction Plot Splits the Main Effect Plot for Frame Size Into Two Lines: One Where There Is a Clip, The Other Where There Is Not a Clip Interaction Plot for Flight Time Fitted Means Frame * Clip Clip No Clip Clip Mean of Flight Time 1.60 Roughly parallel lines indicate no interaction. 1.55 Lines that cross indicate an interaction. 1.50 1.45 Small Big Frame Whether the interaction effect should be included in an equation is a question for the experimenter (questions of practical and statistical significance) 40
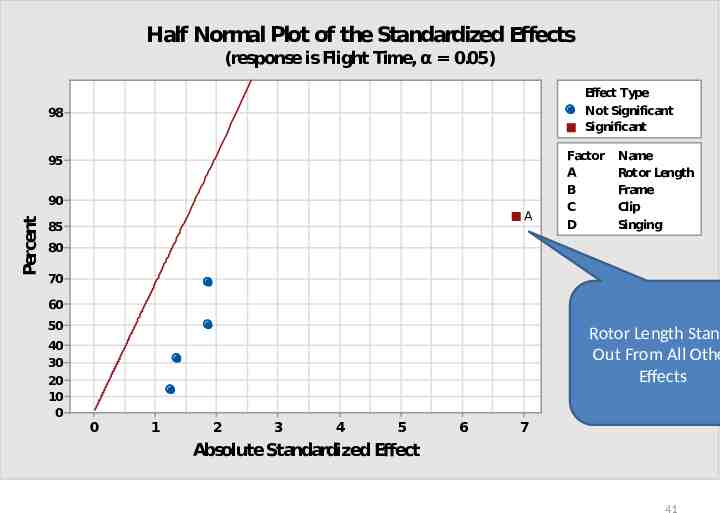
Half Normal Plot of the Standardized Effects (response is Flight Time, α 0.05) Effect Type Not Significant Significant 98 95 Percent 90 A 85 Factor A B C D Name Rotor Length Frame Clip Singing 80 70 60 50 40 30 20 10 0 Rotor Length Stand Out From All Othe Effects 0 1 2 3 4 5 6 7 Absolute Standardized Effect 41
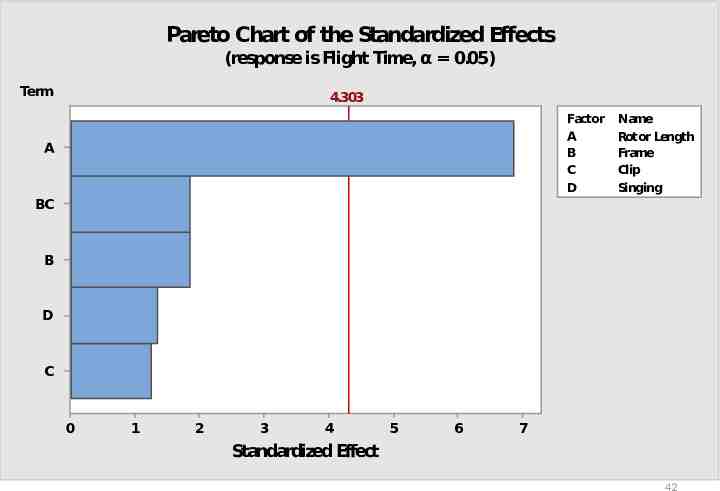
Pareto Chart of the Standardized Effects (response is Flight Time, α 0.05) Term 4.303 Factor A B C D A Name Rotor Length Frame Clip Singing BC B D C 0 1 2 3 4 5 6 7 Standardized Effect 42
Appendix II SHORT OUTLINE OF SELECTED STEPS IN A DOE 43
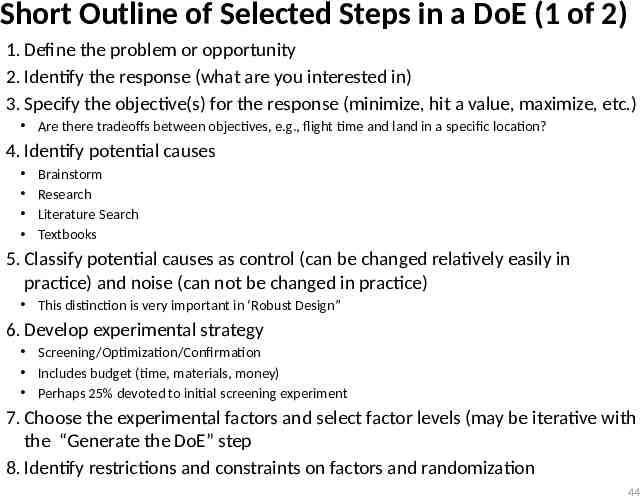
Short Outline of Selected Steps in a DoE (1 of 2) 1. Define the problem or opportunity 2. Identify the response (what are you interested in) 3. Specify the objective(s) for the response (minimize, hit a value, maximize, etc.) Are there tradeoffs between objectives, e.g., flight time and land in a specific location? 4. Identify potential causes Brainstorm Research Literature Search Textbooks 5. Classify potential causes as control (can be changed relatively easily in practice) and noise (can not be changed in practice) This distinction is very important in ‘Robust Design” 6. Develop experimental strategy Screening/Optimization/Confirmation Includes budget (time, materials, money) Perhaps 25% devoted to initial screening experiment 7. Choose the experimental factors and select factor levels (may be iterative with the “Generate the DoE” step 8. Identify restrictions and constraints on factors and randomization 44
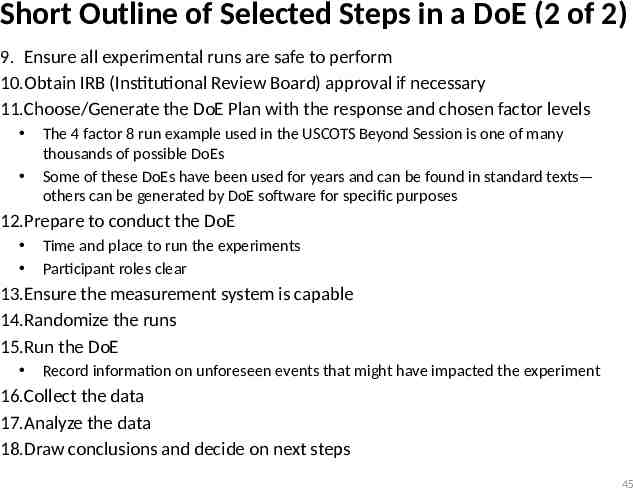
Short Outline of Selected Steps in a DoE (2 of 2) 9. Ensure all experimental runs are safe to perform 10.Obtain IRB (Institutional Review Board) approval if necessary 11.Choose/Generate the DoE Plan with the response and chosen factor levels The 4 factor 8 run example used in the USCOTS Beyond Session is one of many thousands of possible DoEs Some of these DoEs have been used for years and can be found in standard texts— others can be generated by DoE software for specific purposes 12.Prepare to conduct the DoE Time and place to run the experiments Participant roles clear 13.Ensure the measurement system is capable 14.Randomize the runs 15.Run the DoE Record information on unforeseen events that might have impacted the experiment 16.Collect the data 17.Analyze the data 18.Draw conclusions and decide on next steps 45
Subset of Slides 1-45 THE FOLLOWING SLIDES ARE PRESENTED AT THE USCOTS 2021 TUESDAY “BEYOND” SESSION TO START THE DISCUSSION 2021 David A. Fluharty 46
Should Introductory Statistics Classes Include Multifactor Statistical Design of Experiments (DoE)? USCOTS 2021 Tuesday, June 29th 3:00-3:45pm ET David Fluharty Adjunct Professor of Statistics and Economics Ivy Tech Community College—Columbus IN [email protected] 47
DoE Is an Art and Science that Helps Us Investigate the Effects of Multiple Factors (Including Interactions*) by SIMULTANEOUSLY Varying These Factors According to a Mathematically/Statistically FIXED Set of Recipes. Results Include Predictive Equations and Possibly Optimization. This Contrasts With One-Factor-At-A-Time Experimentation. IRB**? Safe? Subject Matter Expertise, Literature Search, Textbooks, Brainstorming Screen for Important Factors including Interactions—Separate Vital Few Factors From Trivial Many (The 4 Factor 8 Run Fractional Factorial in this presentation is an Example of One of the Thousands of Possible Screening Experiments) Optimize (Response Surface Methodology) Results Satisfactory? Yes Results Satisfactory? No Yes Confirmatory*** Experiment(s) Of “Optimal” Design No * Estimates of Interactions Depends on “Resolution” of Design ** Institutional (c) 2021 David A. Fluharty Review Board ***Ensure “Optimal Result” Works as 48 Expected ( very important in industry}
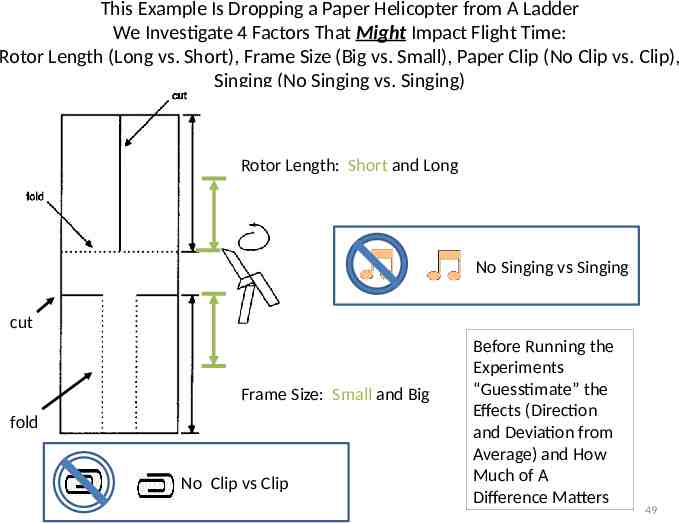
This Example Is Dropping a Paper Helicopter from A Ladder We Investigate 4 Factors That Might Impact Flight Time: Rotor Length (Long vs. Short), Frame Size (Big vs. Small), Paper Clip (No Clip vs. Clip), Singing (No Singing vs. Singing) Rotor Length: Short and Long No Singing vs Singing cut Frame Size: Small and Big fold No Clip vs Clip Before Running the Experiments “Guesstimate” the Effects (Direction and Deviation from Average) and How Much of A Difference Matters 49
4 Factors 8 Runs (Each Different) (Why This Works—Matrix Algebra) Model Rotor Frame Name Length Size Clip Singing "Standard Order" I Short Small No Clip No Sing -1 -1 -1 -1 II Long Small No Clip Sing 1 -1 -1 1 III Short Big No Clip Sing -1 1 -1 1 IV Long Big No Clip No Sing V Short Small Clip Sing -1 -1 1 1 VI Long Small Clip No Sing 1 -1 1 -1 VII Short Big Clip No Sing -1 1 1 -1 VIII Long Big Clip Sing 1 1 1 1 When Multiply the Rows, the Sum (Dot Product) is Zero These are Orthogonal Vectors 1 1 -1 -1 The “Singing” Column is the product of the other three columns. For example, for Model VIII: 1 x 1 x 1 1 50
There is One Recipe Card Corresponding to Each of the Helicopter Designs: Example of Design VIII This section contains the “recipe” for the helicopter design The flight time of this helicopter is recorded here The random run order is recorded here (can randomize by pulling out of a hat) The model number (design name called “standard order” by statisticians Good experimental practice is to record any unusual event during he experimental run for future analysis 51
One way to randomize (Accesses the Psychomotor Domain): Put Each Recipe Card in a Container Mix Draw a Card Establishing “Run Order” Repeat Mix and Draw v 52
Run #1 1.85 1.79 1.81 53
Run #2 1.43 0.00 1.78 54
Repeat for Runs 3-8 Remember: Each Is a Different Helicopter Design 55
Put “Recipe Cards” In Standard Order Calculate the Grand Average Total 12.47 Average (Total/8) 1.155875 56
Next, Group By Rotor Length 57
CALCULATE MAIN EFFECT OF DIFFERENT ROTOR LENGTHS Short Rotor Total 5.55 Avg. (Total / 4) 1.3875 Effect (Long – Short) Coefficient (Effect / 2) Long Rotor 6.92 1.730 0.3425 0.17125 58
Why We Divide The Effect by 2 (in this example) To Obtain Equation Coefficients 59
CALCULATE MAIN EFFECT OF DIFFERENT FRAME SIZES Small Frame Total 6.42 Avg. (Total / 4) 1.605 Effect (Long Avg. – Short Avg.) Coefficient (Effect / 2) Big Frame 6.05 1.513 -0.0925 -0.04625 60
Calculate Other Two Main Effects 61
62
The Helicopter Experiment “The Helicopter Experiment” is used extensively in 6-Sigma/Quality/Statistics training in industry More Sophisticated Versions: – Key Source: George Box, FRS: – Teaching Engineers Experimental Design With A Paper Helicopter, Quality Engineering, 1992, Vol. 4, No. 3, pp. 453-459 – Also Report No. 76 of the Center for Quality and Productivity Improvement of the University of Wisconsin – Slightly more complex Paper Helicopter Experiment: Matthew Barsalou: – Teaching DoE with Paper Helicopters and Minitab http://www.minitab.com/en-us/Published-Articles/Teaching-DoE-with-Paper-Helicopters-and-Minitab/ – More Advance Paper Helicopter Experiment Erik Barry Erhardt – Designing a Better Paper Helicopter Using Response Surface Methodology. Stats, Issue 48, pp. 14-19, also see p. 2. – Statistical Software: DesignExpert https://www.statease.com/ JMP https://www.jmp.com/en us/applications/design-of-experiments.html Minitab http://www.minitab.com/en-us/ 63
More Information Box, G. E. P. (1992), “Teaching Engineers Experimental Design with a Paper Helicopter,” Quality Engineering, 4, 453–459. Found at Teaching Engineers Experimental Design with a Paper Helicopter (williamghunter.net) also see Learning Design of Experiments with Paper Helicopters » Curious Cat Science and Engine ering Blog (curiouscatblog.net) and for a more advanced optimization approach see Erik Barry Erhardt “Designing a Better Paper Helicopter Using Response Surface Methodology,” Stats Issue 48, pp. 14-21. 2004-08Stat-Teaser.qxd (statease.com) Creativity defeats sensibility for paper helicopter fly-off « Stats Made Easy – Video of paper-helicopter fly-offs at South Dakota Sch ool of Mines & Technology « Stats Made Easy Learning Design of Experiments with Paper Helico 64
Discussion Are You Interested In Continuing the Conversation? – [email protected] Should Introductory Statistics Students See a Demonstration —or Preferably Participate in the Planning, Execution, and Analysis—of a Simplified Multifactor Statistically Design of Experiments (DoE)? What About Students Who Do Not Take Stat 101? Is the Recipe Card Approach A Good Example of How To Introduce DoE? – How Can It Be Improved? 65
Why Introduce DoE in Introductory Statistics? Why (Educational/Cognitive): – Multi Causal Systems (Understanding Needed in Science and Society) – Process of Scientific Discovery Iterative Discovery Vs. Demonstrative Discuss Engineering Trade-Offs – Omnipresence of Variation – Interactions, Predictive Equations, and Optimization – Randomization – Statistical vs. Practical Significance (if Use Software) – Efficiency vs. One-Factor-At-A Time – Use of Statistical Graphics – Used Business and Industry – Manufacturing (Six Sigma Programs) – Marketing Experiments Pedagogy/Andragogy – Cognitive Domain – Psychomotor Domain – Affective Domain For the Paper Helicopter Example, Model of Autorotation (Flight Time) if Engine Fails 66