Retirement Services University Transamerica Investment Management, LLC

24 Slides811.00 KB
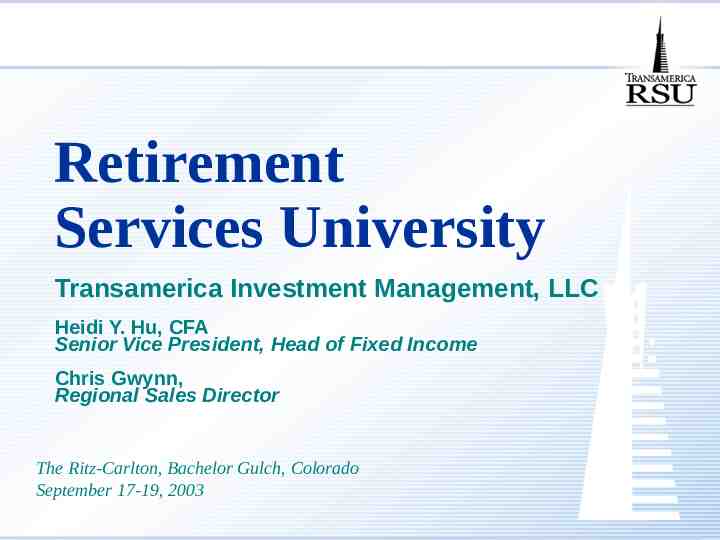
Retirement Services University Transamerica Investment Management, LLC Heidi Y. Hu, CFA Senior Vice President, Head of Fixed Income Chris Gwynn, Regional Sales Director The Ritz-Carlton, Bachelor Gulch, Colorado September 17-19, 2003
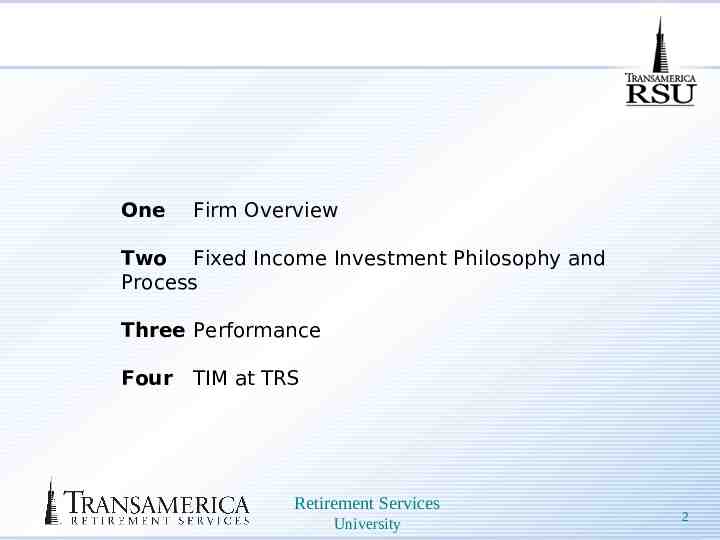
One Firm Overview Two Fixed Income Investment Philosophy and Process Three Performance Four TIM at TRS Retirement Services University 2
Firm Overview Retirement Services University 3
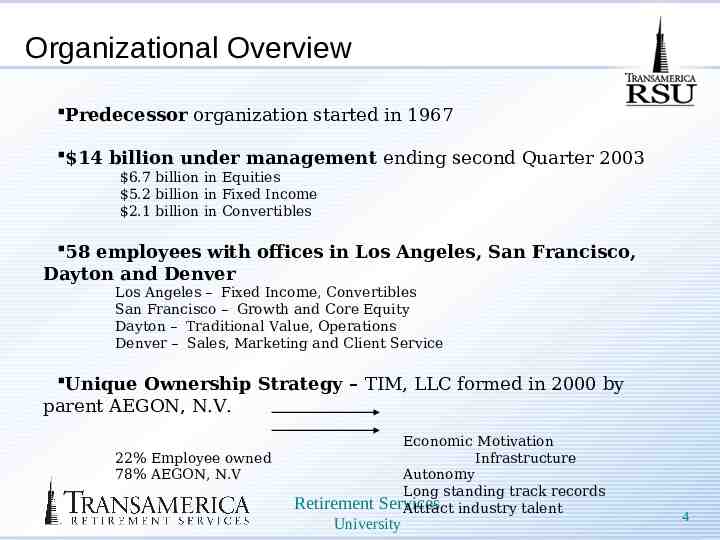
Organizational Overview Predecessor organization started in 1967 14 billion under management ending second Quarter 2003 6.7 billion in Equities 5.2 billion in Fixed Income 2.1 billion in Convertibles 58 employees with offices in Los Angeles, San Francisco, Dayton and Denver Los Angeles – Fixed Income, Convertibles San Francisco – Growth and Core Equity Dayton – Traditional Value, Operations Denver – Sales, Marketing and Client Service Unique Ownership Strategy – TIM, LLC formed in 2000 by parent AEGON, N.V. 22% Employee owned 78% AEGON, N.V Retirement Economic Motivation Infrastructure Autonomy Long standing track records Services Attract industry talent University 4
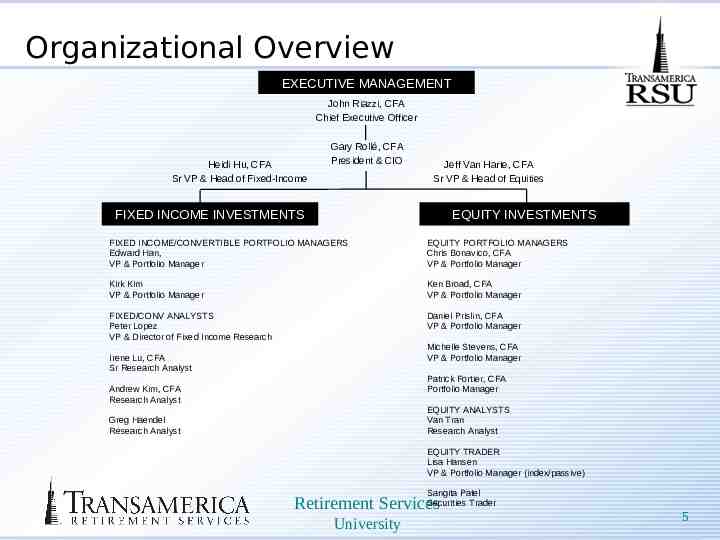
Organizational Overview EXECUTIVE MANAGEMENT John Riazzi, CFA Chief Executive Officer Heidi Hu, CFA Sr VP & Head of Fixed-Income Gary Rollé, CFA President & CIO Jeff Van Harte, CFA Sr VP & Head of Equities FIXED INCOME INVESTMENTS EQUITY INVESTMENTS FIXED INCOME/CONVERTIBLE PORTFOLIO MANAGERS Edward Han, VP & Portfolio Manager EQUITY PORTFOLIO MANAGERS Chris Bonavico, CFA VP & Portfolio Manager Kirk Kim VP & Portfolio Manager Ken Broad, CFA VP & Portfolio Manager FIXED/CONV ANALYSTS Peter Lopez VP & Director of Fixed Income Research Daniel Prislin, CFA VP & Portfolio Manager Michelle Stevens, CFA VP & Portfolio Manager Irene Lu, CFA Sr Research Analyst Patrick Fortier, CFA Portfolio Manager Andrew Kim, CFA Research Analyst EQUITY ANALYSTS Van Tran Research Analyst Greg Haendel Research Analyst EQUITY TRADER Lisa Hansen VP & Portfolio Manager (index/passive) Sangita Patel Securities Trader Retirement Services University 5
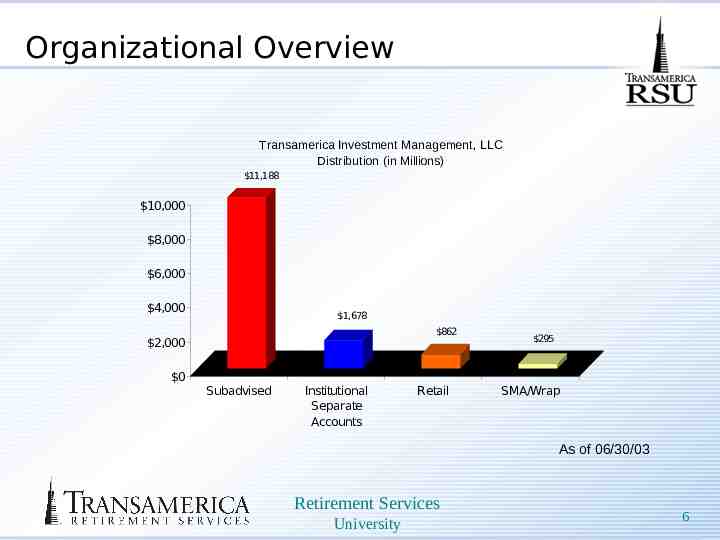
Organizational Overview Transamerica Investment Management, LLC Distribution (in Millions) 11,188 10,000 8,000 6,000 4,000 1,678 862 2,000 0 Subadvised Institutional Separate Accounts Retail 295 SMA/Wrap As of 06/30/03 Retirement Services University 6
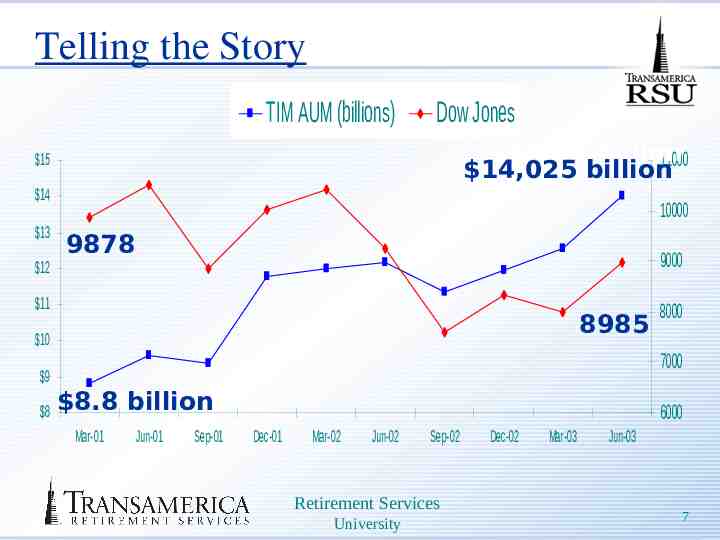
Telling the Story TIM AUM (billions) Dow Jones 14.03 billion 11000 14,025 billion 15 14 13 12 10000 9878 9000 11 8985 10 7000 9 8 8000 8.8 billion Mar-01 Jun-01 Sep-01 6000 Dec-01 Mar-02 Jun-02 Sep-02 Retirement Services University Dec-02 Mar-03 Jun-03 7
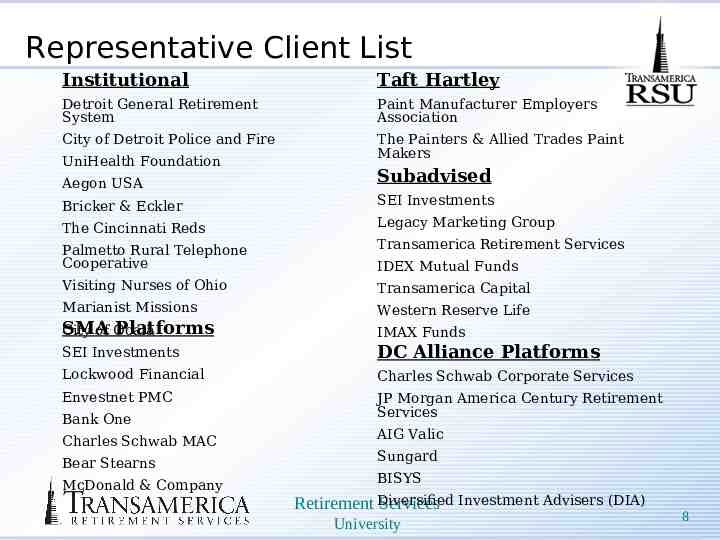
Representative Client List Institutional Taft Hartley Detroit General Retirement System Paint Manufacturer Employers Association City of Detroit Police and Fire The Painters & Allied Trades Paint Makers UniHealth Foundation Aegon USA Bricker & Eckler Subadvised SEI Investments The Cincinnati Reds Legacy Marketing Group Palmetto Rural Telephone Cooperative Transamerica Retirement Services IDEX Mutual Funds Visiting Nurses of Ohio Transamerica Capital Marianist Missions Western Reserve Life SMA Platforms City of Ocala IMAX Funds SEI Investments DC Alliance Platforms Lockwood Financial Charles Schwab Corporate Services Envestnet PMC JP Morgan America Century Retirement Services Bank One Charles Schwab MAC Bear Stearns McDonald & Company AIG Valic Sungard BISYS Retirement Diversified Services Investment Advisers (DIA) University 8
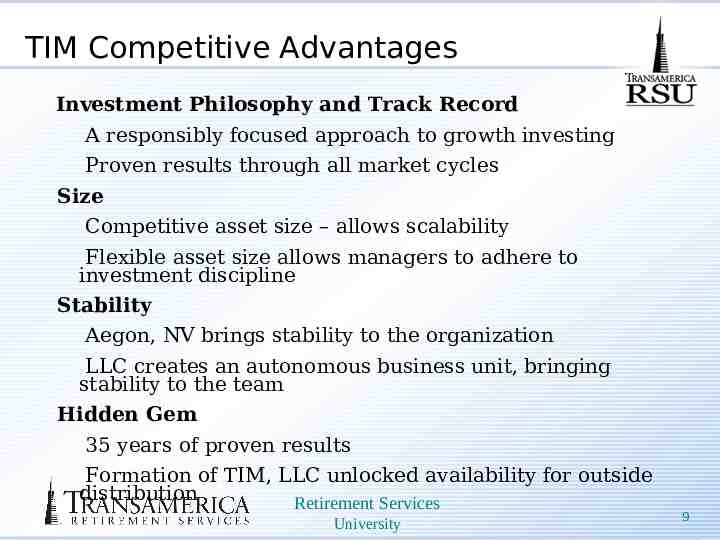
TIM Competitive Advantages Investment Philosophy and Track Record A responsibly focused approach to growth investing Proven results through all market cycles Size Competitive asset size – allows scalability Flexible asset size allows managers to adhere to investment discipline Stability Aegon, NV brings stability to the organization LLC creates an autonomous business unit, bringing stability to the team Hidden Gem 35 years of proven results Formation of TIM, LLC unlocked availability for outside distribution Retirement Services University 9
Fixed Income Investment Philosophy and Process Retirement Services University 10
Fixed Income Philosophy Generate consistent top quartile performance and excess returns primarily through credit selection and strategic sector weightings. Corporate credit markets are not efficient Our expertise is in corporate credit valuation We use an active management style to exploit inefficiencies in valuation Retirement Services University 11
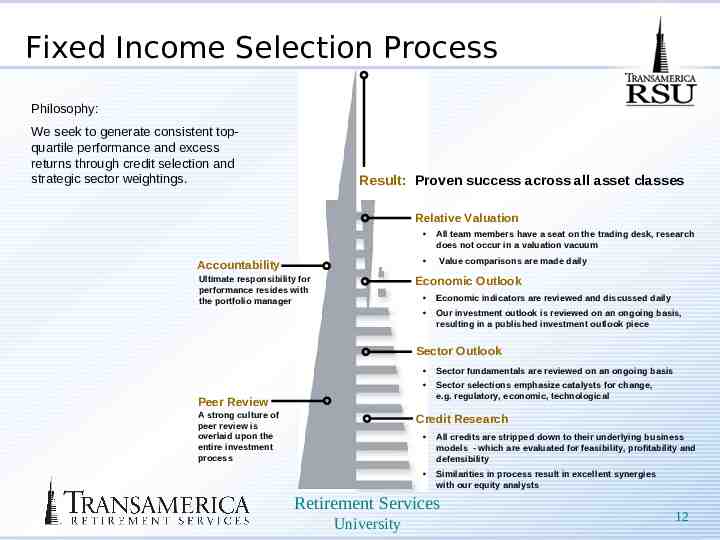
Fixed Income Selection Process Philosophy: We seek to generate consistent topquartile performance and excess returns through credit selection and strategic sector weightings. Result: Proven success across all asset classes Relative Valuation Accountability Ultimate responsibility for performance resides with the portfolio manager All team members have a seat on the trading desk, research does not occur in a valuation vacuum Value comparisons are made daily Economic Outlook Economic indicators are reviewed and discussed daily Our investment outlook is reviewed on an ongoing basis, resulting in a published investment outlook piece Sector Outlook Sector fundamentals are reviewed on an ongoing basis Sector selections emphasize catalysts for change, e.g. regulatory, economic, technological Peer Review A strong culture of peer review is overlaid upon the entire investment process Credit Research All credits are stripped down to their underlying business models - which are evaluated for feasibility, profitability and defensibility Similarities in process result in excellent synergies with our equity analysts Retirement Services University 12
Performance Retirement Services University 13
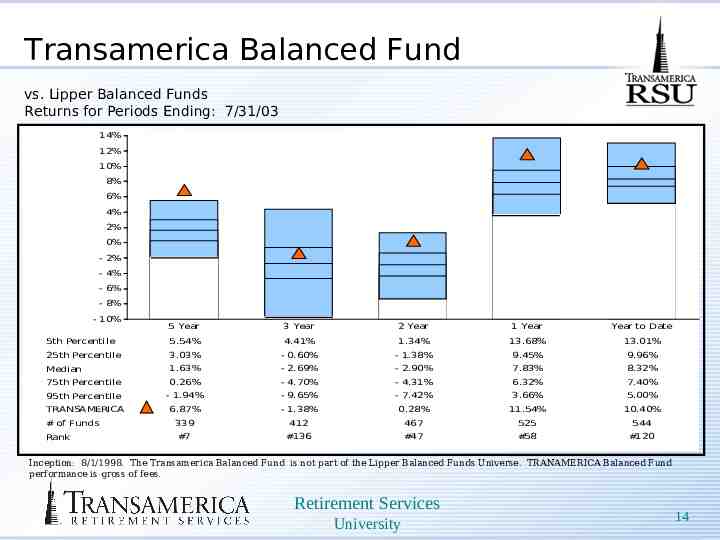
Transamerica Balanced Fund vs. Lipper Balanced Funds Returns for Periods Ending: 7/31/03 14% 12% 10% 8% 6% 4% 2% 0% - 2% - 4% - 6% - 8% - 10% 5 Year 3 Year 2 Year 1 Year Year to Date 5th Percentile 5.54% 4.41% 1.34% 13.68% 13.01% 25th Percentile 3.03% - 0.60% - 1.38% 9.45% 9.96% Median 1.63% - 2.69% - 2.90% 7.83% 8.32% 75th Percentile 0.26% - 4.70% - 4.31% 6.32% 7.40% 95th Percentile - 1.94% - 9.65% - 7.42% 3.66% 5.00% TRANSAMERICA 6.87% - 1.38% 0.28% 11.54% 10.40% 339 412 467 525 544 #7 #136 #47 #58 #120 # of Funds Rank Inception: 8/1/1998. The Transamerica Balanced Fund is not part of the Lipper Balanced Funds Universe. TRANAMERICA Balanced Fund performance is gross of fees. Retirement Services University 14
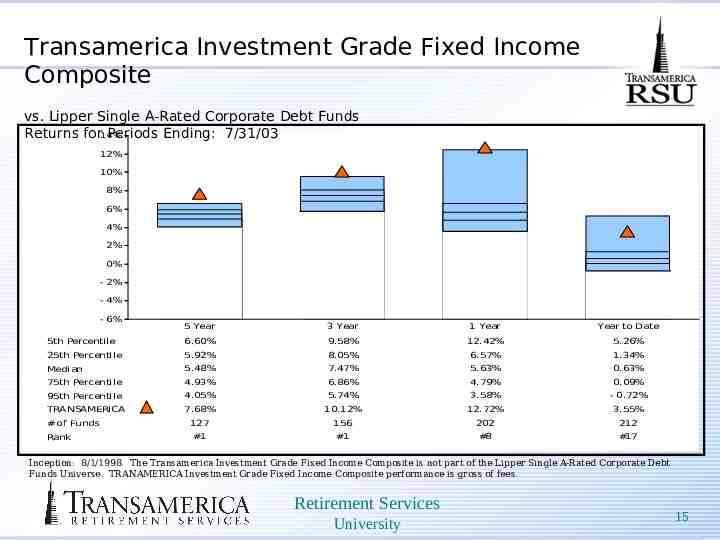
Transamerica Investment Grade Fixed Income Composite vs. Lipper Single A-Rated Corporate Debt Funds Returns for14% Periods Ending: 7/31/03 12% 10% 8% 6% 4% 2% 0% - 2% - 4% - 6% 5 Year 3 Year 1 Year Year to Date 5th Percentile 6.60% 9.58% 12.42% 5.26% 25th Percentile 5.92% 8.05% 6.57% 1.34% Median 5.48% 7.47% 5.63% 0.63% 75th Percentile 4.93% 6.86% 4.79% 0.09% 95th Percentile 4.05% 5.74% 3.58% - 0.72% TRANSAMERICA 7.68% 10.12% 12.72% 3.55% 127 156 202 212 #1 #1 #8 #17 # of Funds Rank Inception: 8/1/1998. The Transamerica Investment Grade Fixed Income Composite is not part of the Lipper Single A-Rated Corporate Debt Funds Universe. TRANAMERICA Investment Grade Fixed Income Composite performance is gross of fees. Retirement Services University 15
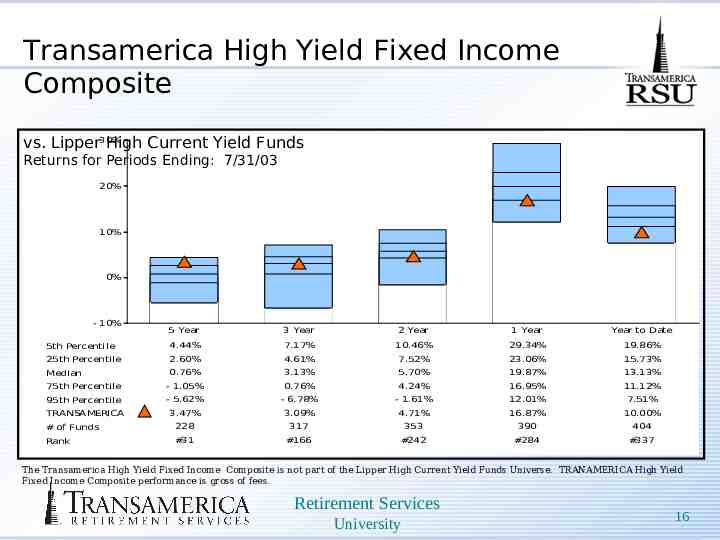
Transamerica High Yield Fixed Income Composite vs. Lipper30% High Current Yield Funds Returns for Periods Ending: 7/31/03 20% 10% 0% - 10% 5 Year 3 Year 2 Year 1 Year Year to Date 5th Percentile 4.44% 7.17% 10.46% 29.34% 19.86% 25th Percentile 2.60% 4.61% 7.52% 23.06% 15.73% Median 0.76% 3.13% 5.70% 19.87% 13.13% 11.12% 75th Percentile - 1.05% 0.76% 4.24% 16.95% 95th Percentile - 5.62% - 6.78% - 1.61% 12.01% 7.51% TRANSAMERICA 3.47% 3.09% 4.71% 16.87% 10.00% # of Funds 228 317 353 390 404 Rank #31 #166 #242 #284 #337 The Transamerica High Yield Fixed Income Composite is not part of the Lipper High Current Yield Funds Universe. TRANAMERICA High Yield Fixed Income Composite performance is gross of fees. Retirement Services University 16
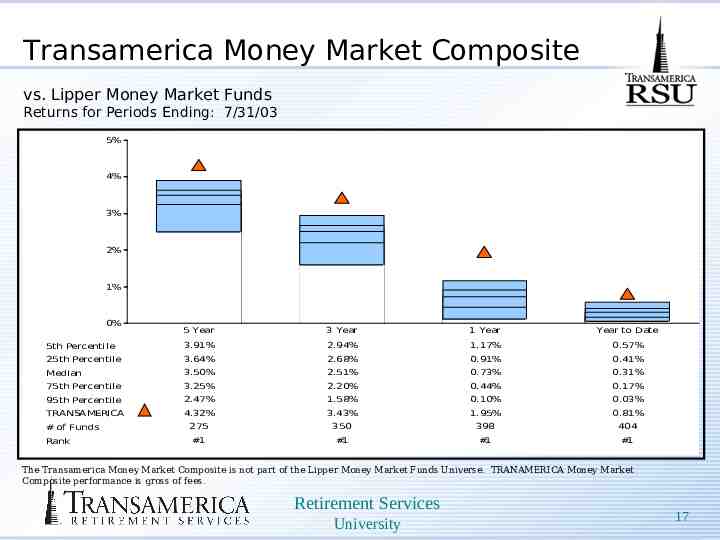
Transamerica Money Market Composite vs. Lipper Money Market Funds Returns for Periods Ending: 7/31/03 5% 4% 3% 2% 1% 0% 5 Year 3 Year 1 Year Year to Date 5th Percentile 3.91% 2.94% 1.17% 0.57% 25th Percentile 3.64% 2.68% 0.91% 0.41% Median 3.50% 2.51% 0.73% 0.31% 75th Percentile 3.25% 2.20% 0.44% 0.17% 95th Percentile 2.47% 1.58% 0.10% 0.03% TRANSAMERICA 4.32% 3.43% 1.95% 0.81% 275 350 398 404 #1 #1 #1 #1 # of Funds Rank The Transamerica Money Market Composite is not part of the Lipper Money Market Funds Universe. TRANAMERICA Money Market Composite performance is gross of fees. Retirement Services University 17
TIM at TRS Of the 22 “Transamerica” funds, 7 are managed by TIM Transamerica Transamerica Transamerica Transamerica Transamerica Transamerica Transamerica Cash Management Bond Fund Balanced Fund Core Equity Fund Equity Fund Focus Fund Growth Opportunities Fund Retirement Services University 18
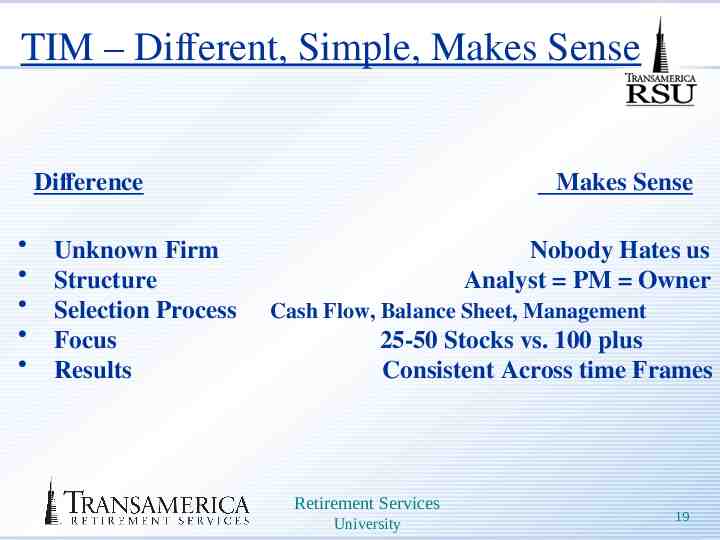
TIM – Different, Simple, Makes Sense Difference Unknown Firm Structure Selection Process Focus Results Makes Sense Nobody Hates us Analyst PM Owner Cash Flow, Balance Sheet, Management 25-50 Stocks vs. 100 plus Consistent Across time Frames Retirement Services University 19
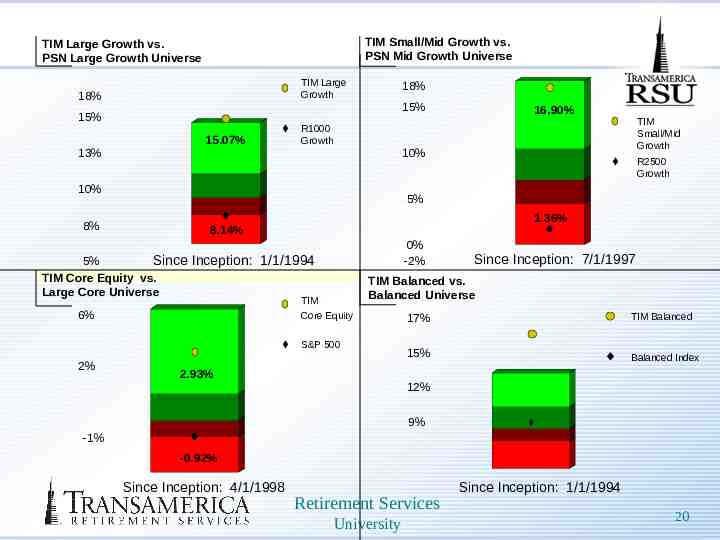
TIM Small/Mid Growth vs. PSN Mid Growth Universe TIM Large Growth vs. PSN Large Growth Universe TIM Large Growth 18% 18% 15% 15% 15.07% 10% 10% R2500 Growth 5% 1.36% 8.14% 0% -2% 5% Since Inception: 1/1/1994 TIM Core Equity vs. Large Core Universe TIM Core Equity 6% Since Inception: 7/1/1997 TIM Balanced vs. Balanced Universe S&P 500 2% TIM Small/Mid Growth R1000 Growth 13% 8% 16.90% 2.93% 17% TIM Balanced 15% Balanced Index 12% 9% -1% -0.92% Since Inception: 4/1/1998 Retirement Services University Since Inception: 1/1/1994 20
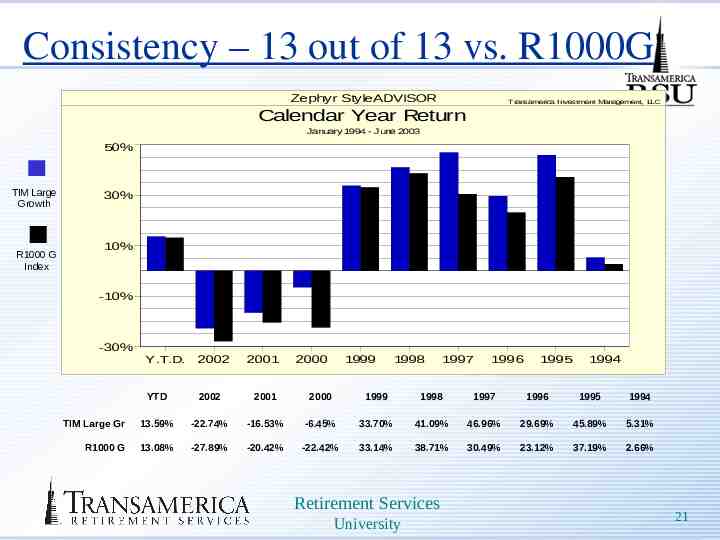
Consistency – 13 out of 13 vs. R1000G Zephyr StyleADVISOR Transamerica Investment Management, LLC Calendar Year Return January 1994 - June 2003 50% TIM Large Growth R1000 G Index 30% 10% -10% -30% Y.T.D. 2002 2001 2000 1999 1998 YTD 2002 2001 2000 1999 1998 1997 1996 1995 1994 TIM Large Gr 13.59% -22.74% -16.53% -6.45% 33.70% 41.09% 46.96% 29.69% 45.89% 5.31% R1000 G 13.08% -27.89% -20.42% -22.42% 33.14% 38.71% 30.49% 23.12% 37.19% 2.66% Retirement Services University 1997 1996 1995 1994 21
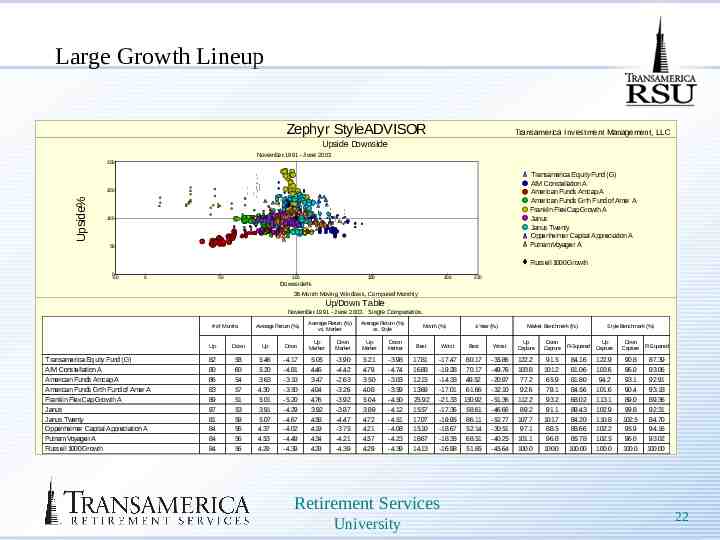
Large Growth Lineup Zephyr StyleADVISOR Transamerica Inv estment Management, LLC Upside Downside November 1991 - June 2003 200 Transamerica Equity Fund (G) AIM Constellation A American Funds Amcap A American Funds Grth Fund of Amer A Franklin Flex Cap Growth A Janus Janus Twenty Oppenheimer Capital Appreciation A Putnam Voyager A Upside% 150 100 50 Russell 1000 Growth 0 -20 0 50 100 150 200 220 Downside% 36-Month Moving Windows, Computed Monthly Up/Down Table November 1991 - June 2003. Single Computation. # of Months Transamerica Equity Fund (G) AIM Constellation A American Funds Amcap A American Funds Grth Fund of Amer A Franklin Flex Cap Growth A Janus Janus Twenty Oppenheimer Capital Appreciation A Putnam Voyager A Russell 1000 Growth Average Return (%) Average Return (%) vs. Market Average Return (%) vs. Style Month (%) 1-Year (%) Market Benchmark (%) Style Benchmark (%) Up Down Up Down Up Market Down Market Up Market Down Market Best Worst Best Worst Up Capture Down Capture R-Squared Up Capture Down Capture R-Squared 82 80 86 83 89 87 81 84 84 84 58 60 54 57 51 53 59 56 56 56 5.46 5.20 3.63 4.30 5.01 3.91 5.07 4.37 4.53 4.29 -4.17 -4.81 -3.10 -3.50 -5.20 -4.29 -4.67 -4.02 -4.49 -4.39 5.05 4.46 3.47 4.04 4.76 3.92 4.58 4.19 4.34 4.29 -3.90 -4.42 -2.63 -3.26 -3.92 -3.87 -4.47 -3.75 -4.21 -4.39 5.21 4.79 3.50 4.08 5.04 3.89 4.72 4.21 4.57 4.29 -3.98 -4.74 -3.03 -3.59 -4.50 -4.12 -4.51 -4.08 -4.23 -4.39 17.81 16.88 12.15 13.69 25.92 15.57 17.07 15.10 18.67 14.13 -17.47 -19.28 -14.33 -17.01 -21.33 -17.36 -19.95 -18.67 -18.35 -16.98 80.17 70.17 49.52 61.66 150.92 58.61 86.11 52.14 68.51 51.85 -35.86 -49.76 -20.97 -32.10 -51.36 -46.66 -52.77 -30.51 -40.25 -45.64 122.2 103.8 77.2 92.6 112.2 89.2 107.7 97.1 101.1 100.0 91.5 101.2 65.9 79.1 93.2 91.1 101.7 88.5 96.8 100.0 84.16 81.06 81.80 84.56 68.02 89.43 84.20 88.66 85.78 100.00 122.9 103.6 94.2 101.6 113.1 102.9 110.8 102.2 102.5 100.0 90.8 96.0 93.1 90.4 89.0 99.8 102.5 95.9 96.0 100.0 87.39 93.06 92.91 93.18 89.36 92.31 84.70 94.16 93.02 100.00 Retirement Services University 22
The Power of the Pyramid at work for You! 866-TIM-1800 Chris Gwynn (103) Toby Cromwell (102) Crissy Janzen (105) Retirement Services University 23
Retirement Services University 24