Data Sources and Conversion Feeding the GIS. Like a teenager,


41 Slides729.50 KB
Data Sources and Conversion Feeding the GIS. Like a teenager, a GIS can consume more than data you ever imagined! Discussion here focuses more on projects than organization-wide implementation. Often, data collection is an end in itself. Almost invariably, it’s the costliest element of any project and of most organizational implementations-- 80%. 08/07/23 Ron Briggs, UTDallas GISC 6383 GIS Management and Implementation 1
RECAP from Implementation Steps/db design 4. Design A Process for Obtaining and Converting Data from Source --identify source (document, map, digital file, etc) for each and every entity and its attributes --defining the procedures for converting data from source and into the database We will talk tonight primarily about sources 08/07/23 Ron Briggs, UTDallas GISC 6383 GIS Management and Implementation 2
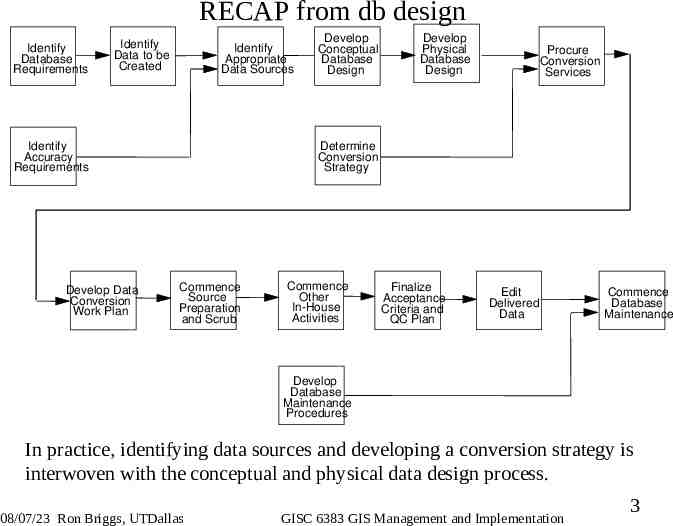
RECAP from db design Identify Database Requirements Identify Data to be Created Identify Appropriate Data Sources Identify Accuracy Requirements Develop Data Conversion Work Plan Develop Conceptual Database Design Develop Physical Database Design Procure Conversion Services Determine Conversion Strategy Commence Source Preparation and Scrub Commence Other In-House Activities Finalize Acceptance Criteria and QC Plan Edit Delivered Data Commence Database Maintenance Develop Database Maintenance Procedures In practice, identifying data sources and developing a conversion strategy is interwoven with the conceptual and physical data design process. 08/07/23 Ron Briggs, UTDallas GISC 6383 GIS Management and Implementation 3
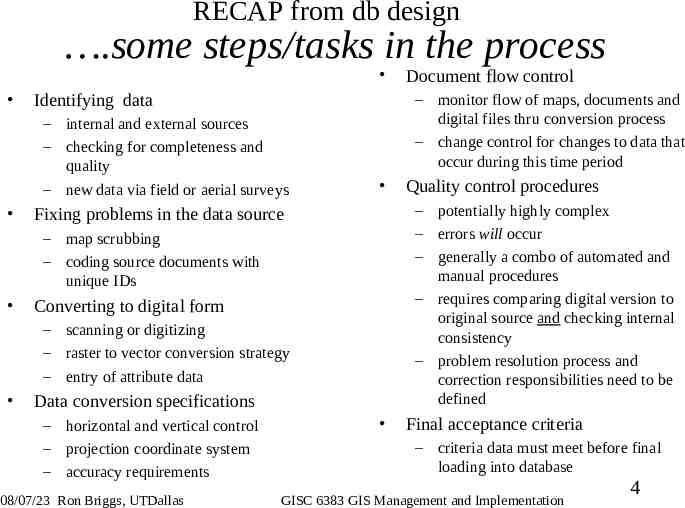
RECAP from db design .some steps/tasks in the process Identifying data – internal and external sources – checking for completeness and quality – new data via field or aerial surveys – monitor flow of maps, documents and digital files thru conversion process – change control for changes to data that occur during this time period Converting to digital form – scanning or digitizing – raster to vector conversion strategy – entry of attribute data Data conversion specifications – horizontal and vertical control – projection coordinate system – accuracy requirements 08/07/23 Ron Briggs, UTDallas Quality control procedures – potentially highly complex – errors will occur – generally a combo of automated and manual procedures – requires comparing digital version to original source and checking internal consistency – problem resolution process and correction responsibilities need to be defined Fixing problems in the data source – map scrubbing – coding source documents with unique IDs Document flow control Final acceptance criteria – criteria data must meet before final loading into database GISC 6383 GIS Management and Implementation 4
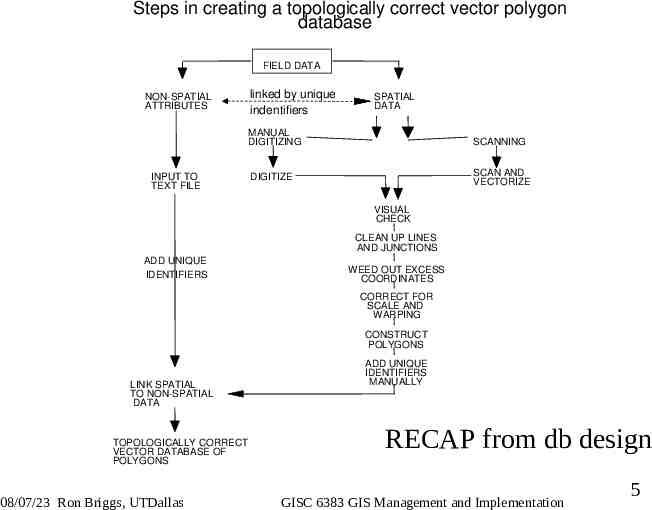
Steps in creating a topologically correct vector polygon database FIELD DATA linked by unique indentifiers NON-SPATIAL ATTRIBUTES SPATIAL DATA MANUAL DIGITIZING SCANNING DIGITIZE SCAN AND VECTORIZE INPUT TO TEXT FILE VISUAL CHECK CLEAN UP LINES AND JUNCTIONS ADD UNIQUE IDENTIFIERS WEED OUT EXCESS COORDINATES CORRECT FOR SCALE AND WARPING CONSTRUCT POLYGONS LINK SPATIAL TO NON-SPATIAL DATA TOPOLOGICALLY CORRECT VECTOR DATABASE OF POLYGONS 08/07/23 Ron Briggs, UTDallas ADD UNIQUE IDENTIFIERS MANUALLY RECAP from db design GISC 6383 GIS Management and Implementation 5
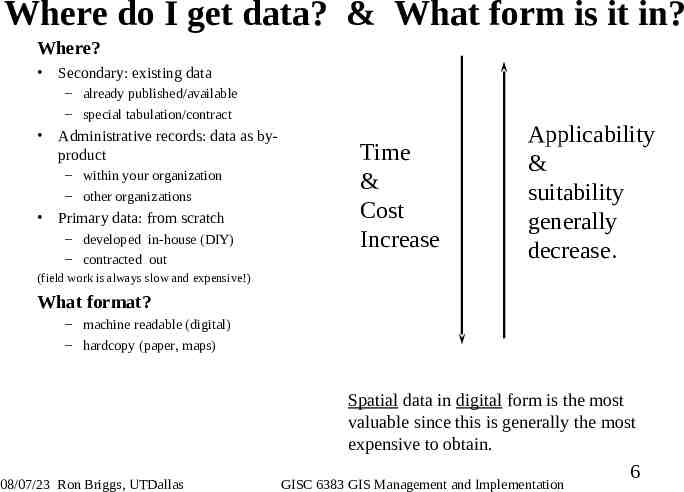
Where do I get data? & What form is it in? Where? Secondary: existing data – already published/available – special tabulation/contract Administrative records: data as byproduct – within your organization – other organizations Primary data: from scratch – developed in-house (DIY) – contracted out Time & Cost Increase Applicability & suitability generally decrease. (field work is always slow and expensive!) What format? – machine readable (digital) – hardcopy (paper, maps) Spatial data in digital form is the most valuable since this is generally the most expensive to obtain. 08/07/23 Ron Briggs, UTDallas GISC 6383 GIS Management and Implementation 6
Don’t forget to look in-house! collected by your organization as data by-product of normal agency operations acquired for some other project Don’t forget to look, especially if it’s a large organization. There may already be a GIS project in existence or about to be launched! 08/07/23 Ron Briggs, UTDallas GISC 6383 GIS Management and Implementation 7
Major GIS Data Sources Maps Drawings (sketch or engineering) Aerial (or other) Photographs Satellite Imagery CAD data bases Government & commercial spatial (GIS) data bases Government & commercial attribute data bases Paper records and documents 08/07/23 Ron Briggs, UTDallas GISC 6383 GIS Management and Implementation 8
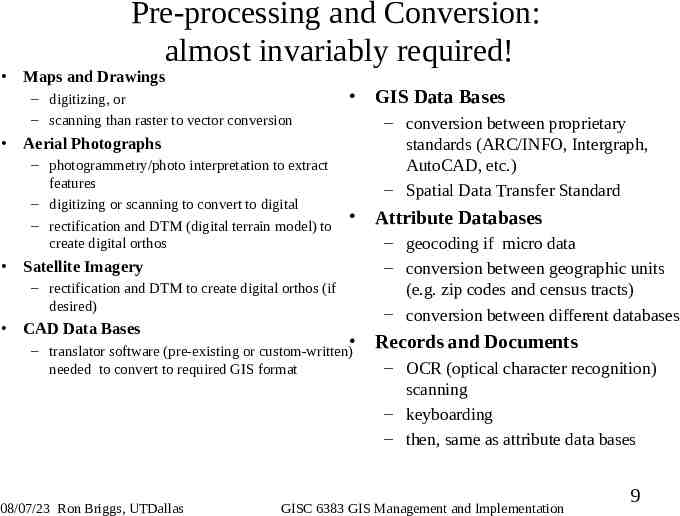
Pre-processing and Conversion: almost invariably required! Maps and Drawings – digitizing, or – scanning than raster to vector conversion Satellite Imagery CAD Data Bases – translator software (pre-existing or custom-written) needed to convert to required GIS format 08/07/23 Ron Briggs, UTDallas Attribute Databases – geocoding if micro data – conversion between geographic units (e.g. zip codes and census tracts) – conversion between different databases – rectification and DTM to create digital orthos (if desired) GIS Data Bases – conversion between proprietary standards (ARC/INFO, Intergraph, AutoCAD, etc.) – Spatial Data Transfer Standard Aerial Photographs – photogrammetry/photo interpretation to extract features – digitizing or scanning to convert to digital – rectification and DTM (digital terrain model) to create digital orthos Records and Documents – OCR (optical character recognition) scanning – keyboarding – then, same as attribute data bases GISC 6383 GIS Management and Implementation 9
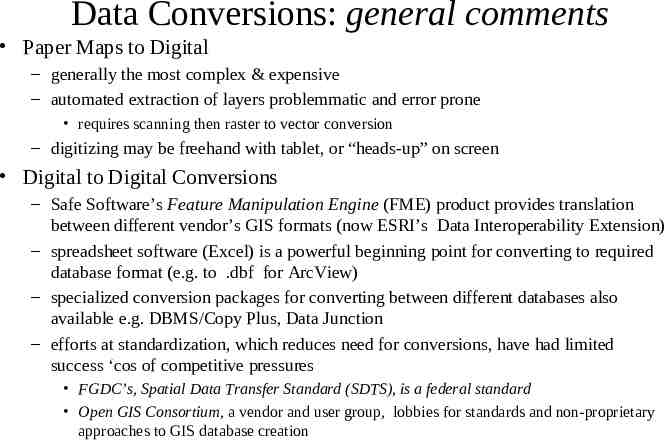
Data Conversions: general comments Paper Maps to Digital – generally the most complex & expensive – automated extraction of layers problemmatic and error prone requires scanning then raster to vector conversion – digitizing may be freehand with tablet, or “heads-up” on screen Digital to Digital Conversions – Safe Software’s Feature Manipulation Engine (FME) product provides translation between different vendor’s GIS formats (now ESRI’s Data Interoperability Extension) – spreadsheet software (Excel) is a powerful beginning point for converting to required database format (e.g. to .dbf for ArcView) – specialized conversion packages for converting between different databases also available e.g. DBMS/Copy Plus, Data Junction – efforts at standardization, which reduces need for conversions, have had limited success ‘cos of competitive pressures FGDC’s, Spatial Data Transfer Standard (SDTS), is a federal standard Open GIS Consortium, a vendor and user group, lobbies for standards and non-proprietary approaches to GIS database creation
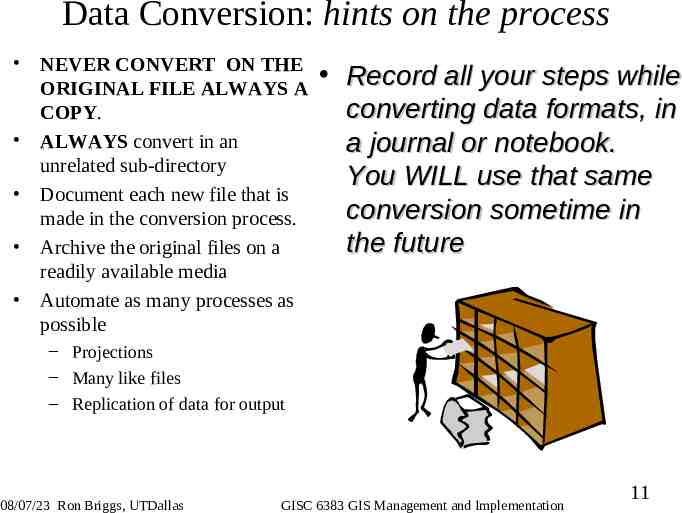
Data Conversion: hints on the process NEVER CONVERT ON THE ORIGINAL FILE ALWAYS A COPY. ALWAYS convert in an unrelated sub-directory Document each new file that is made in the conversion process. Archive the original files on a readily available media Automate as many processes as possible Record all your steps while converting data formats, in a journal or notebook. You WILL use that same conversion sometime in the future – Projections – Many like files – Replication of data for output 08/07/23 Ron Briggs, UTDallas GISC 6383 GIS Management and Implementation 11
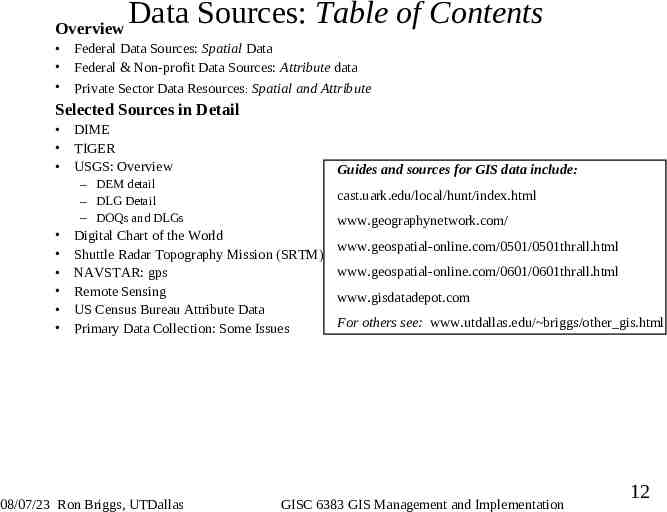
Overview Data Sources: Table of Contents Federal Data Sources: Spatial Data Federal & Non-profit Data Sources: Attribute data Private Sector Data Resources: Spatial and Attribute Selected Sources in Detail DIME TIGER USGS: Overview Guides and sources for GIS data include: – DEM detail – DLG Detail – DOQs and DLGs cast.uark.edu/local/hunt/index.html Digital Chart of the World Shuttle Radar Topography Mission (SRTM) NAVSTAR: gps Remote Sensing US Census Bureau Attribute Data Primary Data Collection: Some Issues 08/07/23 Ron Briggs, UTDallas www.geographynetwork.com/ www.geospatial-online.com/0501/0501thrall.html www.geospatial-online.com/0601/0601thrall.html www.gisdatadepot.com For others see: www.utdallas.edu/ briggs/other gis.html GISC 6383 GIS Management and Implementation 12
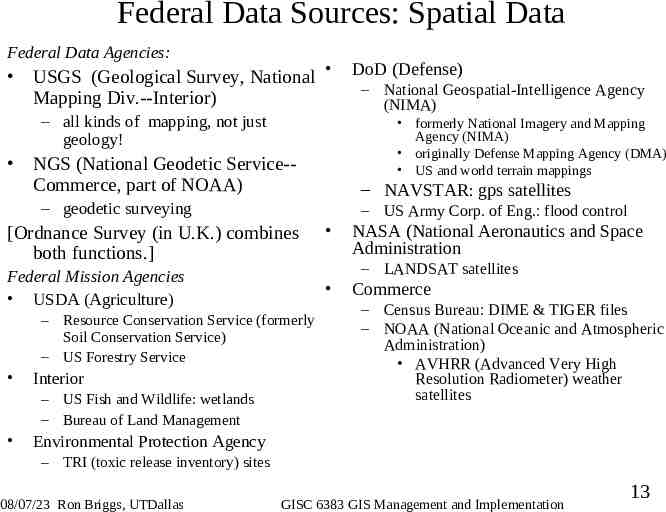
Federal Data Sources: Spatial Data Federal Data Agencies: USGS (Geological Survey, National Mapping Div.--Interior) – all kinds of mapping, not just geology! – NAVSTAR: gps satellites – geodetic surveying – US Army Corp. of Eng.: flood control [Ordnance Survey (in U.K.) combines both functions.] Federal Mission Agencies USDA (Agriculture) – US Fish and Wildlife: wetlands – Bureau of Land Management NASA (National Aeronautics and Space Administration – LANDSAT satellites – Resource Conservation Service (formerly Soil Conservation Service) – US Forestry Service Interior – National Geospatial-Intelligence Agency (NIMA) formerly National Imagery and Mapping Agency (NIMA) originally Defense Mapping Agency (DMA) US and world terrain mappings NGS (National Geodetic Service-Commerce, part of NOAA) DoD (Defense) Commerce – Census Bureau: DIME & TIGER files – NOAA (National Oceanic and Atmospheric Administration) AVHRR (Advanced Very High Resolution Radiometer) weather satellites Environmental Protection Agency – TRI (toxic release inventory) sites 08/07/23 Ron Briggs, UTDallas GISC 6383 GIS Management and Implementation 13
Federal & Non-profit Data Sources: Attribute data Federal Data Agencies CB (Census Bureau-- Dept of Commerce) – population and industry data from surveys BEA (Bureau of Economic Analysis-- Dept. of Commerce) – STAT-US: national accounts Federal Mission Agencies Most federal agencies now have a stat. dept – – – – Bureau of Labor Statistics National Center for Health Statistics National Center for Education Statistics National Center for Criminal Justice Statistics – National Center for Transportation Statistics – Interstate Commerce Commission – Internal Revenue Service 08/07/23 Ron Briggs, UTDallas Non-profit interest groups: – Urban and Regional Information Systems Association (URISA) – National League of Cities – Population Reference Bureau – Transportation Assoc. of America Trade Associations: – American Public Transit Assoc. – see Encyclopedia of Associations Trade Publications – Progressive Grocer – see Business Periodicals Index University Research Centers – University of Michigan, National Institute for Social Research GISC 6383 GIS Management and Implementation 14
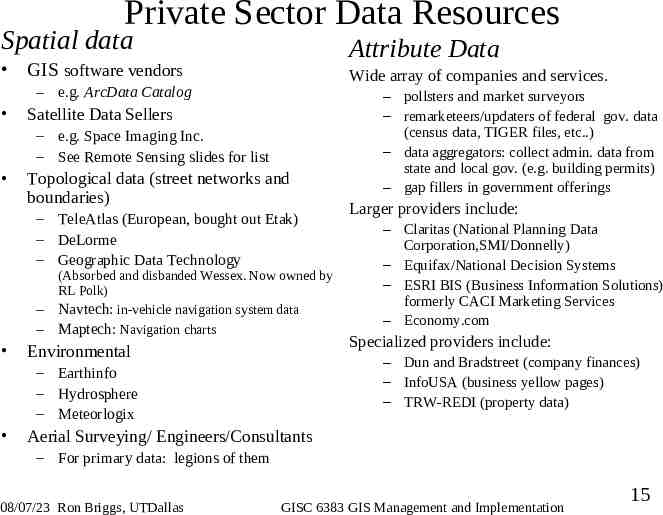
Private Sector Data Resources Spatial data Attribute Data GIS software vendors Wide array of companies and services. – e.g. ArcData Catalog Satellite Data Sellers – e.g. Space Imaging Inc. – See Remote Sensing slides for list Topological data (street networks and boundaries) – TeleAtlas (European, bought out Etak) – DeLorme – Geographic Data Technology – – (Absorbed and disbanded Wessex. Now owned by RL Polk) Navtech: in-vehicle navigation system data Maptech: Navigation charts Environmental Larger providers include: – Claritas (National Planning Data Corporation,SMI/Donnelly) – Equifax/National Decision Systems – ESRI BIS (Business Information Solutions) formerly CACI Marketing Services – Economy.com Specialized providers include: – Dun and Bradstreet (company finances) – InfoUSA (business yellow pages) – TRW-REDI (property data) – Earthinfo – Hydrosphere – Meteorlogix – pollsters and market surveyors – remarketeers/updaters of federal gov. data (census data, TIGER files, etc.) – data aggregators: collect admin. data from state and local gov. (e.g. building permits) – gap fillers in government offerings Aerial Surveying/ Engineers/Consultants – For primary data: legions of them 08/07/23 Ron Briggs, UTDallas GISC 6383 GIS Management and Implementation 15
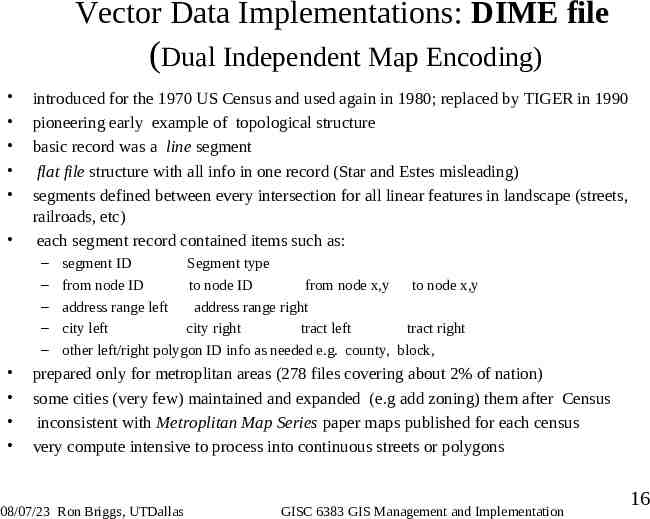
Vector Data Implementations: DIME file (Dual Independent Map Encoding) introduced for the 1970 US Census and used again in 1980; replaced by TIGER in 1990 pioneering early example of topological structure basic record was a line segment flat file structure with all info in one record (Star and Estes misleading) segments defined between every intersection for all linear features in landscape (streets, railroads, etc) each segment record contained items such as: – – – – – segment ID Segment type from node ID to node ID from node x,y to node x,y address range left address range right city left city right tract left tract right other left/right polygon ID info as needed e.g. county, block, prepared only for metroplitan areas (278 files covering about 2% of nation) some cities (very few) maintained and expanded (e.g add zoning) them after Census inconsistent with Metroplitan Map Series paper maps published for each census very compute intensive to process into continuous streets or polygons 08/07/23 Ron Briggs, UTDallas GISC 6383 GIS Management and Implementation 16
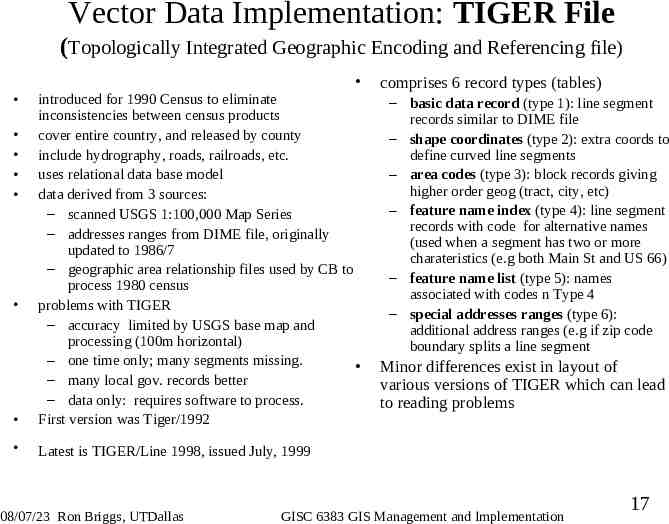
Vector Data Implementation: TIGER File (Topologically Integrated Geographic Encoding and Referencing file) introduced for 1990 Census to eliminate inconsistencies between census products cover entire country, and released by county include hydrography, roads, railroads, etc. uses relational data base model data derived from 3 sources: – scanned USGS 1:100,000 Map Series – addresses ranges from DIME file, originally updated to 1986/7 – geographic area relationship files used by CB to process 1980 census problems with TIGER – accuracy limited by USGS base map and processing (100m horizontal) – one time only; many segments missing. – many local gov. records better – data only: requires software to process. First version was Tiger/1992 Latest is TIGER/Line 1998, issued July, 1999 08/07/23 Ron Briggs, UTDallas comprises 6 record types (tables) – basic data record (type 1): line segment records similar to DIME file – shape coordinates (type 2): extra coords to define curved line segments – area codes (type 3): block records giving higher order geog (tract, city, etc) – feature name index (type 4): line segment records with code for alternative names (used when a segment has two or more charateristics (e.g both Main St and US 66) – feature name list (type 5): names associated with codes n Type 4 – special addresses ranges (type 6): additional address ranges (e.g if zip code boundary splits a line segment Minor differences exist in layout of various versions of TIGER which can lead to reading problems GISC 6383 GIS Management and Implementation 17
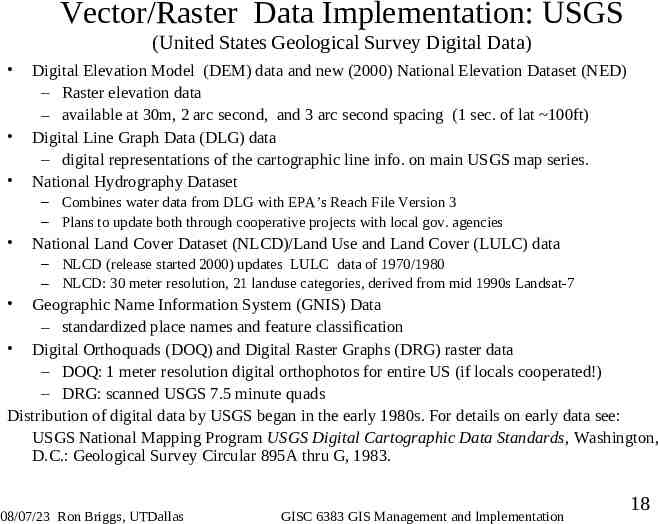
Vector/Raster Data Implementation: USGS (United States Geological Survey Digital Data) Digital Elevation Model (DEM) data and new (2000) National Elevation Dataset (NED) – Raster elevation data – available at 30m, 2 arc second, and 3 arc second spacing (1 sec. of lat 100ft) Digital Line Graph Data (DLG) data – digital representations of the cartographic line info. on main USGS map series. National Hydrography Dataset – Combines water data from DLG with EPA’s Reach File Version 3 – Plans to update both through cooperative projects with local gov. agencies National Land Cover Dataset (NLCD)/Land Use and Land Cover (LULC) data – NLCD (release started 2000) updates LULC data of 1970/1980 – NLCD: 30 meter resolution, 21 landuse categories, derived from mid 1990s Landsat-7 Geographic Name Information System (GNIS) Data – standardized place names and feature classification Digital Orthoquads (DOQ) and Digital Raster Graphs (DRG) raster data – DOQ: 1 meter resolution digital orthophotos for entire US (if locals cooperated!) – DRG: scanned USGS 7.5 minute quads Distribution of digital data by USGS began in the early 1980s. For details on early data see: USGS National Mapping Program USGS Digital Cartographic Data Standards, Washington, D.C.: Geological Survey Circular 895A thru G, 1983. 08/07/23 Ron Briggs, UTDallas GISC 6383 GIS Management and Implementation 18
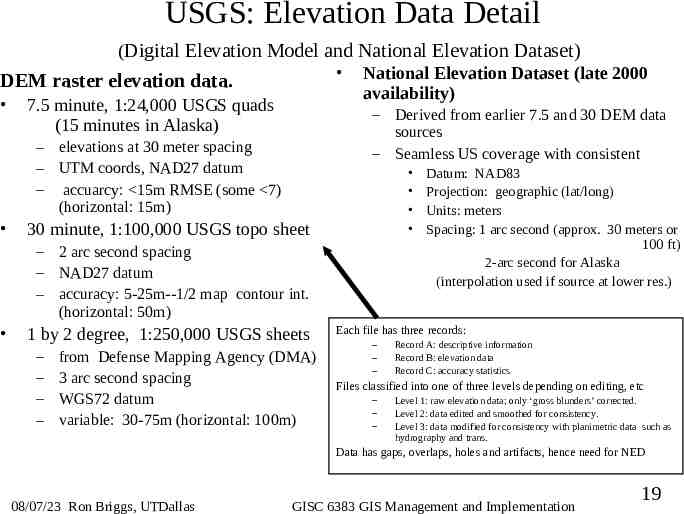
USGS: Elevation Data Detail (Digital Elevation Model and National Elevation Dataset) National Elevation Dataset (late 2000 DEM raster elevation data. availability) 7.5 minute, 1:24,000 USGS quads – Derived from earlier 7.5 and 30 DEM data (15 minutes in Alaska) sources – elevations at 30 meter spacing – UTM coords, NAD27 datum – accuarcy: 15m RMSE (some 7) (horizontal: 15m) – Seamless US coverage with consistent 30 minute, 1:100,000 USGS topo sheet – 2 arc second spacing – NAD27 datum – accuracy: 5-25m--1/2 map contour int. (horizontal: 50m) 1 by 2 degree, 1:250,000 USGS sheets – – – – from Defense Mapping Agency (DMA) 3 arc second spacing WGS72 datum variable: 30-75m (horizontal: 100m) Datum: NAD83 Projection: geographic (lat/long) Units: meters Spacing: 1 arc second (approx. 30 meters or 100 ft) 2-arc second for Alaska (interpolation used if source at lower res.) Each file has three records: – – – Record A: descriptive information Record B: elevation data Record C: accuracy statistics Files classified into one of three levels depending on editing, etc – – – Level 1: raw elevation data; only ‘gross blunders’ corrected. Level 2: data edited and smoothed for consistency. Level 3: data modified for consistency with planimetric data such as hydrography and trans. Data has gaps, overlaps, holes and artifacts, hence need for NED 08/07/23 Ron Briggs, UTDallas GISC 6383 GIS Management and Implementation 19
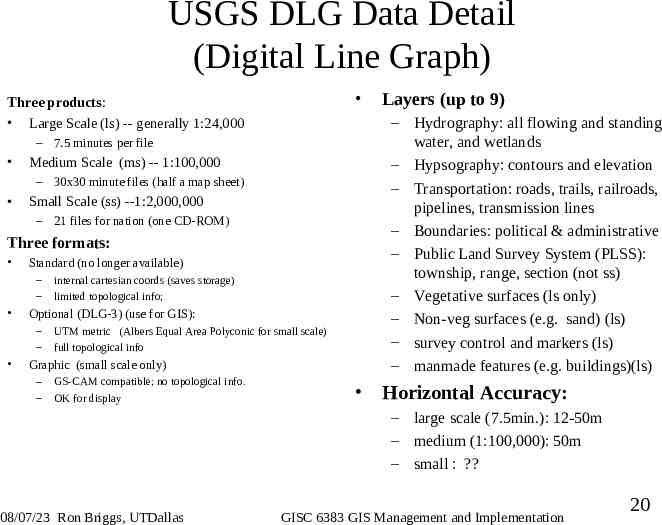
USGS DLG Data Detail (Digital Line Graph) Three products: Large Scale (ls) -- generally 1:24,000 – 7.5 minutes per file Medium Scale (ms) -- 1:100,000 – 30x30 minute files (half a map sheet) Small Scale (ss) --1:2,000,000 – 21 files for nation (one CD-ROM) Three formats: Standard (no longer available) – – Optional (DLG-3) (use for GIS): – – internal cartesian coords (saves storage) limited topological info; UTM metric (Albers Equal Area Polyconic for small scale) full topological info Graphic (small scale only) – – GS-CAM compatible; no topological info. OK for display Layers (up to 9) – Hydrography: all flowing and standing water, and wetlands – Hypsography: contours and elevation – Transportation: roads, trails, railroads, pipelines, transmission lines – Boundaries: political & administrative – Public Land Survey System (PLSS): township, range, section (not ss) – Vegetative surfaces (ls only) – Non-veg surfaces (e.g. sand) (ls) – survey control and markers (ls) – manmade features (e.g. buildings)(ls) Horizontal Accuracy: – large scale (7.5min.): 12-50m – medium (1:100,000): 50m – small : ? 08/07/23 Ron Briggs, UTDallas GISC 6383 GIS Management and Implementation 20
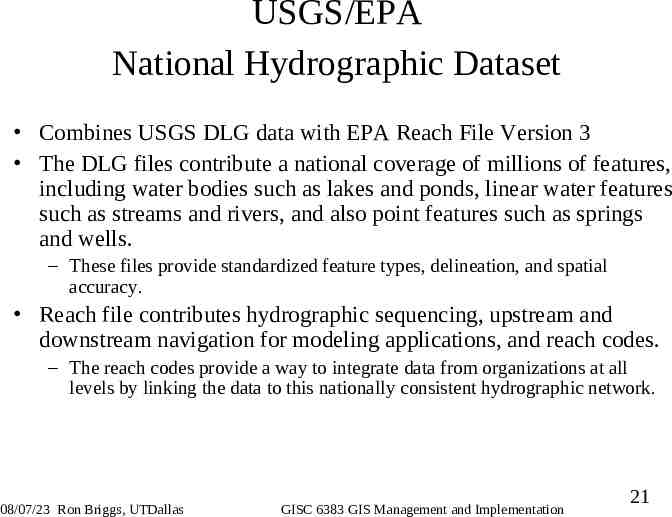
USGS/EPA National Hydrographic Dataset Combines USGS DLG data with EPA Reach File Version 3 The DLG files contribute a national coverage of millions of features, including water bodies such as lakes and ponds, linear water features such as streams and rivers, and also point features such as springs and wells. – These files provide standardized feature types, delineation, and spatial accuracy. Reach file contributes hydrographic sequencing, upstream and downstream navigation for modeling applications, and reach codes. – The reach codes provide a way to integrate data from organizations at all levels by linking the data to this nationally consistent hydrographic network. 08/07/23 Ron Briggs, UTDallas GISC 6383 GIS Management and Implementation 21
USGS: National Land Cover Dataset (NLCD) Land Use and Land Cover (LULC) data detail NLCD Part of Land Cover Characterization Program which also includes Global Land Cover Characterization program and Urban Dynamic program tracking change for selected US metro areas (not D/FW) Cooperate effort of USGS, EPA, NOAA, USFS Data release began in 2000 Derived from early to mid 1990s Landsat-7 Thematic Mapper 30 meter resolution, NAD 83, Albers Conic Equal area projection 21 categories of land use divided into 9 major groups Distributed by State but will mosaic to larger “regional” coverages Two release levels – – “accuracy assessed” states: GeoTIFF format “yet to be assessed” states: 8-bit binary with values 0-255 Uses unsupervised clustering on multi-band TM data supplemented with ground observation, aerial photos, census data, wetland data, land use maps, etc. Designed to be compatible with earlier LULC data of 1970’s and 1980s. LULC Based on 1970s and 1980s information derived from aerial photographs and based on 1:100,000 and 1:250,000 map sheets Available as both vector polygons and grid cell rasters with 4 hectare (10 acre, approx. 200m) resolution 08/07/23 Ron Briggs, UTDallas GISC 6383 GIS Management and Implementation 22
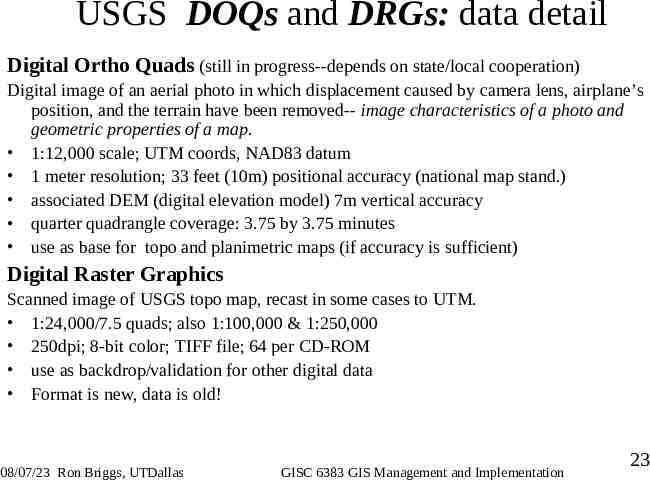
USGS DOQs and DRGs: data detail Digital Ortho Quads (still in progress--depends on state/local cooperation) Digital image of an aerial photo in which displacement caused by camera lens, airplane’s position, and the terrain have been removed-- image characteristics of a photo and geometric properties of a map. 1:12,000 scale; UTM coords, NAD83 datum 1 meter resolution; 33 feet (10m) positional accuracy (national map stand.) associated DEM (digital elevation model) 7m vertical accuracy quarter quadrangle coverage: 3.75 by 3.75 minutes use as base for topo and planimetric maps (if accuracy is sufficient) Digital Raster Graphics Scanned image of USGS topo map, recast in some cases to UTM. 1:24,000/7.5 quads; also 1:100,000 & 1:250,000 250dpi; 8-bit color; TIFF file; 64 per CD-ROM use as backdrop/validation for other digital data Format is new, data is old! 08/07/23 Ron Briggs, UTDallas GISC 6383 GIS Management and Implementation 23
National Spatial Data Infrastructure Concept: local, tribal, regional, state and federal agencies, the private sector, non-profit organizations, professional societies, academia, and others cooperating to provide spatial data (rather than the feds doing it all). “Framework”: focus on seven themes of commonly used digital geographic data – – – – – – – Geodetic control Digital orthoimagery Elevation data Transportation Hydrography Governmental Units Cadastral (reference system and public parcels) plus standardized metadata (data describing data) for each Federal Geographic Data Committee (FGDC): assigned Federal leadership responsibilities for developing the NSDI by Executive Order 12906 (April 11, 1994) Examples: Transportation: integration of Census Bureau’s TIGER file DOT’s National Transportation Atlas Data Base USGS’s Digital Line Graph data Hydrography: integration of EPA’s REACH USGS’s Digital Line Graph 24 08/07/23 Ron Briggs, UTDallas GISC 6383 GIS Management and Implementation 24
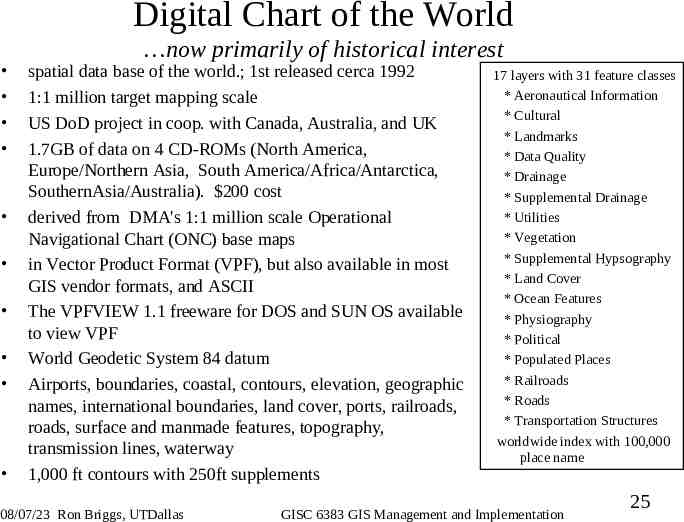
Digital Chart of the World now primarily of historical interest spatial data base of the world.; 1st released cerca 1992 1:1 million target mapping scale US DoD project in coop. with Canada, Australia, and UK 1.7GB of data on 4 CD-ROMs (North America, Europe/Northern Asia, South America/Africa/Antarctica, SouthernAsia/Australia). 200 cost derived from DMA's 1:1 million scale Operational Navigational Chart (ONC) base maps in Vector Product Format (VPF), but also available in most GIS vendor formats, and ASCII The VPFVIEW 1.1 freeware for DOS and SUN OS available to view VPF World Geodetic System 84 datum Airports, boundaries, coastal, contours, elevation, geographic names, international boundaries, land cover, ports, railroads, roads, surface and manmade features, topography, transmission lines, waterway 1,000 ft contours with 250ft supplements 08/07/23 Ron Briggs, UTDallas 17 layers with 31 feature classes * Aeronautical Information * Cultural * Landmarks * Data Quality * Drainage * Supplemental Drainage * Utilities * Vegetation * Supplemental Hypsography * Land Cover * Ocean Features * Physiography * Political * Populated Places * Railroads * Roads * Transportation Structures worldwide index with 100,000 place name GISC 6383 GIS Management and Implementation 25
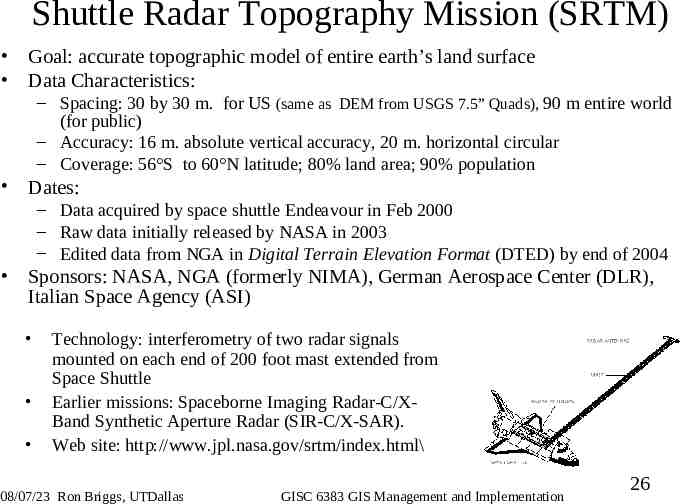
Shuttle Radar Topography Mission (SRTM) Goal: accurate topographic model of entire earth’s land surface Data Characteristics: – Spacing: 30 by 30 m. for US (same as DEM from USGS 7.5” Quads), 90 m entire world (for public) – Accuracy: 16 m. absolute vertical accuracy, 20 m. horizontal circular – Coverage: 56 S to 60 N latitude; 80% land area; 90% population Dates: – Data acquired by space shuttle Endeavour in Feb 2000 – Raw data initially released by NASA in 2003 – Edited data from NGA in Digital Terrain Elevation Format (DTED) by end of 2004 Sponsors: NASA, NGA (formerly NIMA), German Aerospace Center (DLR), Italian Space Agency (ASI) Technology: interferometry of two radar signals mounted on each end of 200 foot mast extended from Space Shuttle Earlier missions: Spaceborne Imaging Radar-C/XBand Synthetic Aperture Radar (SIR-C/X-SAR). Web site: http://www.jpl.nasa.gov/srtm/index.html\ 08/07/23 Ron Briggs, UTDallas GISC 6383 GIS Management and Implementation 26
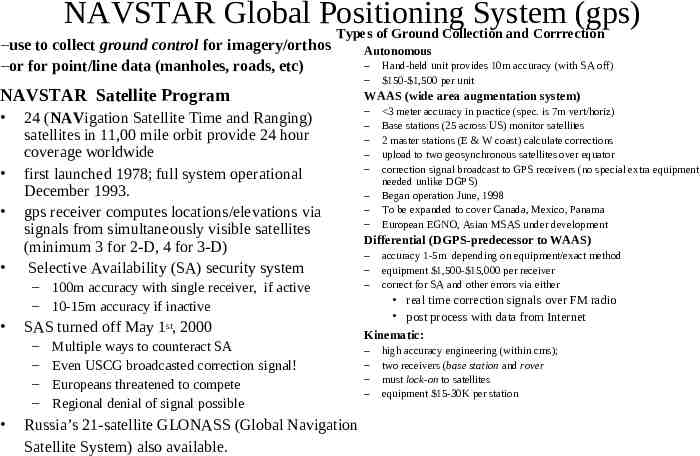
NAVSTAR Global Positioning System (gps) Types of Ground Collection and Corrrection –use to collect ground control for imagery/orthos –or for point/line data (manholes, roads, etc) Autonomous NAVSTAR Satellite Program WAAS (wide area augmentation system) 24 (NAVigation Satellite Time and Ranging) satellites in 11,00 mile orbit provide 24 hour coverage worldwide first launched 1978; full system operational December 1993. gps receiver computes locations/elevations via signals from simultaneously visible satellites (minimum 3 for 2-D, 4 for 3-D) Selective Availability (SA) security system – 100m accuracy with single receiver, if active – 10-15m accuracy if inactive SAS turned off May 1st, 2000 – – – – Multiple ways to counteract SA Even USCG broadcasted correction signal! Europeans threatened to compete Regional denial of signal possible Russia’s 21-satellite GLONASS (Global Navigation Satellite System) also available. – – – – – – – – – – Hand-held unit provides 10m accuracy (with SA off) 150- 1,500 per unit 3 meter accuracy in practice (spec. is 7m vert/horiz) Base stations (25 across US) monitor satellites 2 master stations (E & W coast) calculate corrections upload to two geosynchronous satellites over equator correction signal broadcast to GPS receivers (no special extra equipment needed unlike DGPS) Began operation June, 1998 To be expanded to cover Canada, Mexico, Panama European EGNO, Asian MSAS under development Differential (DGPS-predecessor to WAAS) – – – accuracy 1-5m depending on equipment/exact method equipment 1,500- 15,000 per receiver correct for SA and other errors via either real time correction signals over FM radio post process with data from Internet Kinematic: – – – – high accuracy engineering (within cms); two receivers (base station and rover must lock-on to satellites equipment 15-30K per station
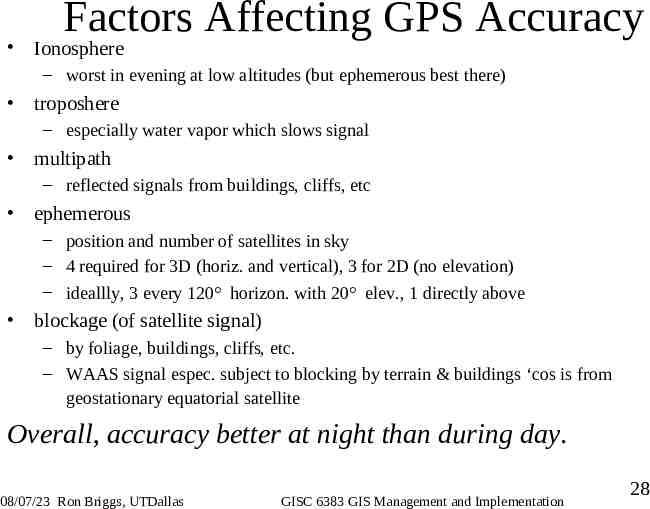
Factors Affecting GPS Accuracy Ionosphere – worst in evening at low altitudes (but ephemerous best there) troposhere – especially water vapor which slows signal multipath – reflected signals from buildings, cliffs, etc ephemerous – position and number of satellites in sky – 4 required for 3D (horiz. and vertical), 3 for 2D (no elevation) – ideallly, 3 every 120 horizon. with 20 elev., 1 directly above blockage (of satellite signal) – by foliage, buildings, cliffs, etc. – WAAS signal espec. subject to blocking by terrain & buildings ‘cos is from geostationary equatorial satellite Overall, accuracy better at night than during day. 08/07/23 Ron Briggs, UTDallas GISC 6383 GIS Management and Implementation 28
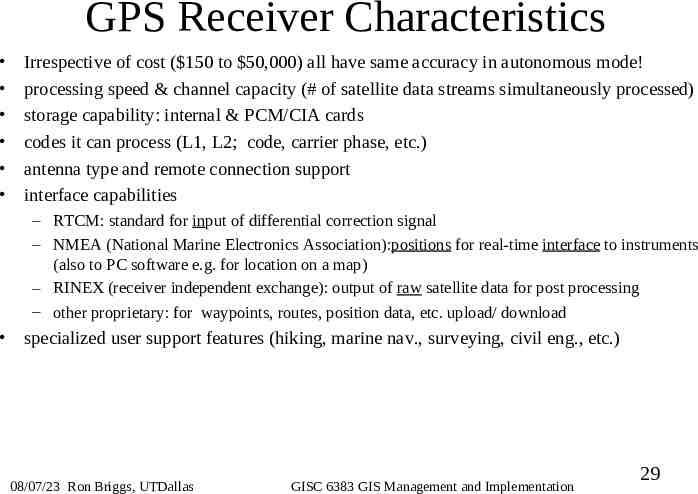
GPS Receiver Characteristics Irrespective of cost ( 150 to 50,000) all have same accuracy in autonomous mode! processing speed & channel capacity (# of satellite data streams simultaneously processed) storage capability: internal & PCM/CIA cards codes it can process (L1, L2; code, carrier phase, etc.) antenna type and remote connection support interface capabilities – RTCM: standard for input of differential correction signal – NMEA (National Marine Electronics Association):positions for real-time interface to instruments (also to PC software e.g. for location on a map) – RINEX (receiver independent exchange): output of raw satellite data for post processing – other proprietary: for waypoints, routes, position data, etc. upload/ download specialized user support features (hiking, marine nav., surveying, civil eng., etc.) 08/07/23 Ron Briggs, UTDallas GISC 6383 GIS Management and Implementation 29
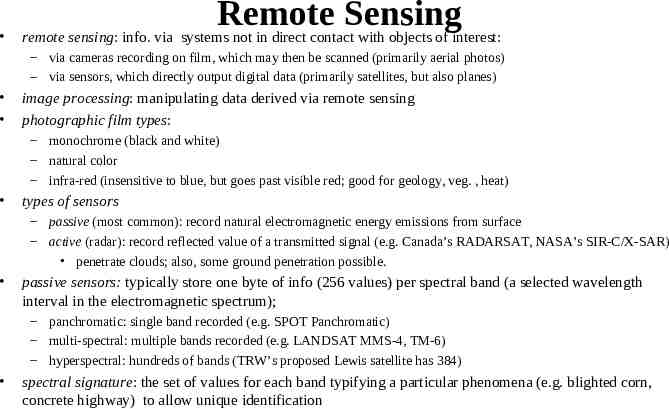
Remote Sensing remote sensing: info. via systems not in direct contact with objects of interest: – via cameras recording on film, which may then be scanned (primarily aerial photos) – via sensors, which directly output digital data (primarily satellites, but also planes) image processing: manipulating data derived via remote sensing photographic film types: – monochrome (black and white) – natural color – infra-red (insensitive to blue, but goes past visible red; good for geology, veg. , heat) types of sensors – passive (most common): record natural electromagnetic energy emissions from surface – active (radar): record reflected value of a transmitted signal (e.g. Canada’s RADARSAT, NASA’s SIR-C/X-SAR) penetrate clouds; also, some ground penetration possible. passive sensors: typically store one byte of info (256 values) per spectral band (a selected wavelength interval in the electromagnetic spectrum); – panchromatic: single band recorded (e.g. SPOT Panchromatic) – multi-spectral: multiple bands recorded (e.g. LANDSAT MMS-4, TM-6) – hyperspectral: hundreds of bands (TRW’s proposed Lewis satellite has 384) spectral signature: the set of values for each band typifying a particular phenomena (e.g. blighted corn, concrete highway) to allow unique identification
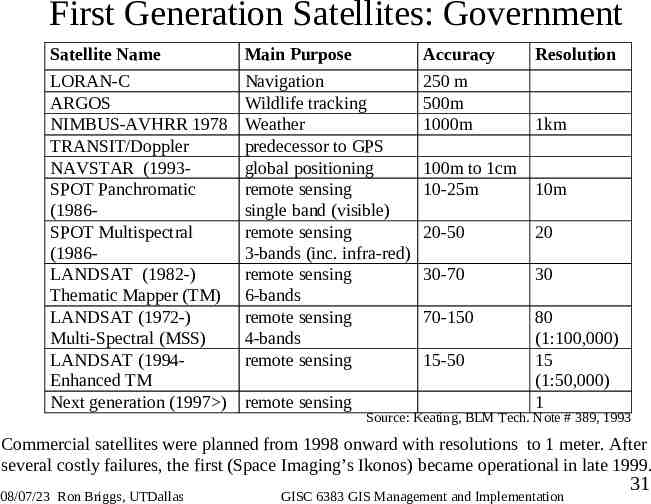
First Generation Satellites: Government Satellite Name Main Purpose Accuracy Resolution LORAN-C ARGOS NIMBUS-AVHRR 1978 TRANSIT/Doppler NAVSTAR (1993SPOT Panchromatic (1986SPOT Multispectral (1986LANDSAT (1982-) Thematic Mapper (TM) LANDSAT (1972-) Multi-Spectral (MSS) LANDSAT (1994Enhanced TM Next generation (1997 ) Navigation Wildlife tracking Weather predecessor to GPS global positioning remote sensing single band (visible) remote sensing 3-bands (inc. infra-red) remote sensing 6-bands remote sensing 4-bands remote sensing 250 m 500m 1000m 1km 100m to 1cm 10-25m 10m 20-50 20 30-70 30 70-150 80 (1:100,000) 15 (1:50,000) 1 remote sensing 15-50 Source: Keating, BLM Tech. Note # 389, 1993 Commercial satellites were planned from 1998 onward with resolutions to 1 meter. After several costly failures, the first (Space Imaging’s Ikonos) became operational in late 1999. 08/07/23 Ron Briggs, UTDallas GISC 6383 GIS Management and Implementation 31
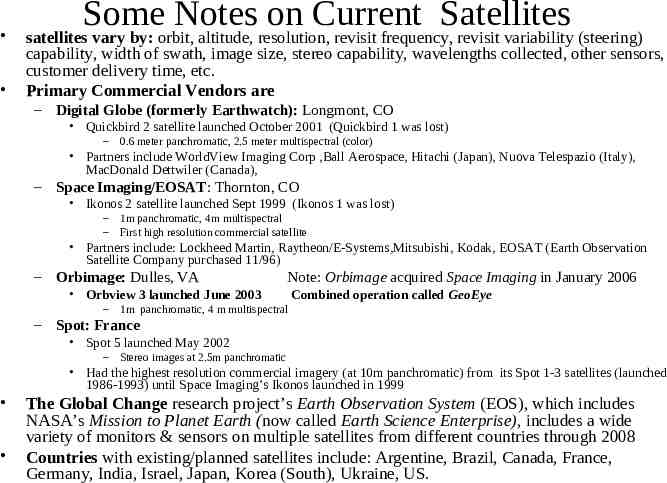
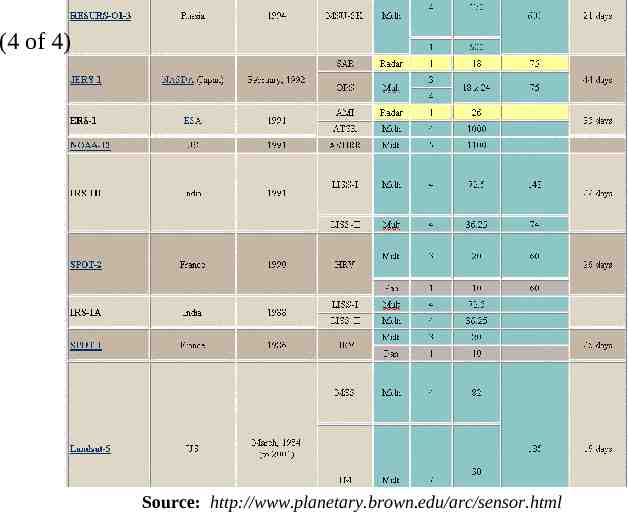
Some Notes on Current Satellites satellites vary by: orbit, altitude, resolution, revisit frequency, revisit variability (steering) capability, width of swath, image size, stereo capability, wavelengths collected, other sensors, customer delivery time, etc. Primary Commercial Vendors are – Digital Globe (formerly Earthwatch): Longmont, CO Quickbird 2 satellite launched October 2001 (Quickbird 1 was lost) – 0.6 meter panchromatic, 2.5 meter multispectral (color) Partners include WorldView Imaging Corp ,Ball Aerospace, Hitachi (Japan), Nuova Telespazio (Italy), MacDonald Dettwiler (Canada), – Space Imaging/EOSAT: Thornton, CO Ikonos 2 satellite launched Sept 1999 (Ikonos 1 was lost) – – 1m panchromatic, 4m multispectral First high resolution commercial satellite Partners include: Lockheed Martin, Raytheon/E-Systems,Mitsubishi, Kodak, EOSAT (Earth Observation Satellite Company purchased 11/96) – Orbimage: Dulles, VA Note: Orbimage acquired Space Imaging in January 2006 Orbview 3 launched June 2003 – Combined operation called GeoEye 1m panchromatic, 4 m multispectral – Spot: France Spot 5 launched May 2002 – Stereo images at 2.5m panchromatic Had the highest resolution commercial imagery (at 10m panchromatic) from its Spot 1-3 satellites (launched 1986-1993) until Space Imaging’s Ikonos launched in 1999 The Global Change research project’s Earth Observation System (EOS), which includes NASA’s Mission to Planet Earth (now called Earth Science Enterprise), includes a wide variety of monitors & sensors on multiple satellites from different countries through 2008 Countries with existing/planned satellites include: Argentine, Brazil, Canada, France, Germany, India, Israel, Japan, Korea (South), Ukraine, US.
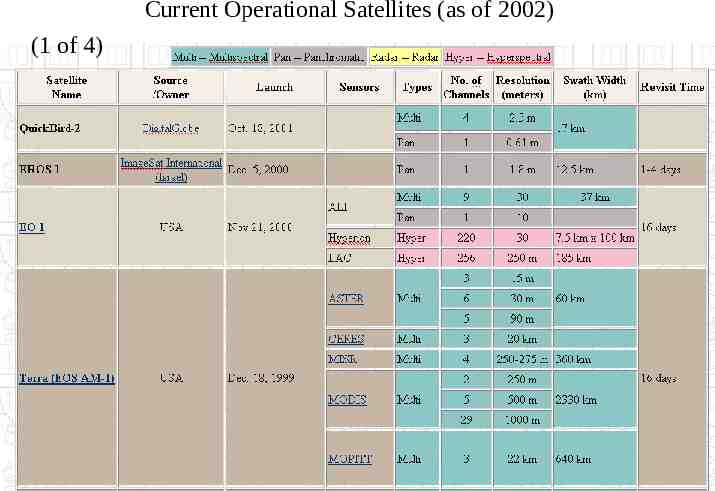
Current Operational Satellites (as of 2002) (1 of 4)
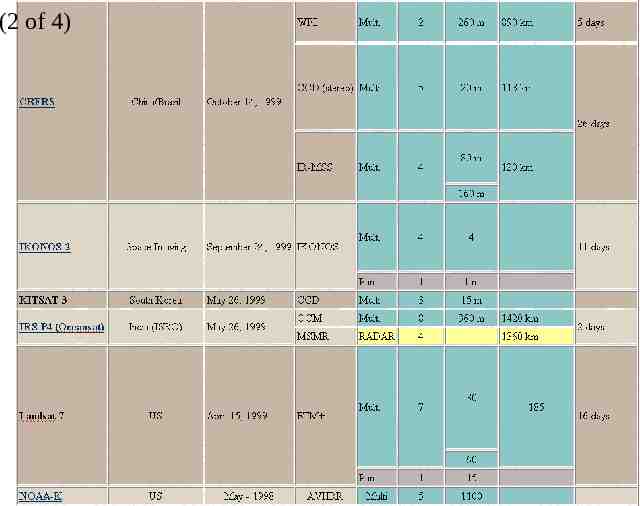
(2 of 4)
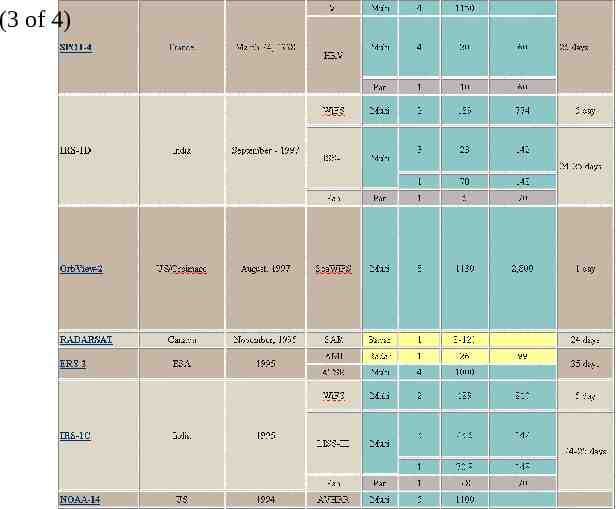
(3 of 4)
(4 of 4) Source: http://www.planetary.brown.edu/arc/sensor.html
Next Generation Satellites NGA (National Geospatial-Intelligence Agency) has signed NextView contracts for development of next generation of commercial satellites, with DOD being given priority access in times of need Digitalglobe contract in fall 2003, focused on – Higher resolution (perhaps to .25 m by 2008) – Delivery time to customer 3 hours now (Iraq war) Future: 90 minutes standard, 20 minutes “rush jobs” Orbimage contract in fall 2004 – For OrbView 5 satellite to launch early 2007 – 0.41 m panchromatic, 1.64 m multispectral – 3 m. position accuracy Note: the award of this contract to Orbimage resulted in their acquisition of Space Imaging (which failed to get the contract) in January 2006 and renaming of the combined entities as GeoEye. OrbView 5 now called GeoEye-1 08/07/23 Ron Briggs, UTDallas GISC 6383 GIS Management and Implementation 37
U.S. Census Bureau: Attribute Data (see: Census Catalog and Guide published annually) Census of Population and Housing – 10 year cycle (1990) – two main tabulations Census – mandatory, entire population – regular but infrequent, as benchmark Full count (STF1 & 2) – geog. detail – down to block Update surveys – not mandatory, update censuses – limited geog detail, usually annual (some weekly) Sample (STF3 & 4) – 20% stratified sample – ‘long form’ – attribute detail Special Surveys – not mandatory; cover data not in census – often on contract with other agency (e.g National Health Survey) Economic Census – 5 year cycle (1993) – agriculture, retail, manufacturing, service, transportation, government, construction 08/07/23 Ron Briggs, UTDallas Data Collection Methodologies Non-Survey – admin records from other agencies – update census (e.g. Current Poplation Reports) – provide additional info (e.g. County Business Patterns) GISC 6383 GIS Management and Implementation 38
Aggregation Issues in Attribute Data Aggregate data Disaggregate (micro) data individuals or individual entities – by geographic area--block, tract – by time: rainfall/sales by day, month, year – by characteristic: age group, race, species – persons, households, firms, – parcels, housing units, establishments – trees, poles, wells geocoding required confidentiality/disclosure a critical issue suppresion may be imposed on aggregate data 08/07/23 Ron Briggs, UTDallas groups of individuals or entities polygons required for mapping Cross-sectional: different spatial units at one point in time Longitudinal: one spatial unit at different points in time Dynamic: continuously produced over time and space (some satellites; CORS program) GISC 6383 GIS Management and Implementation 39
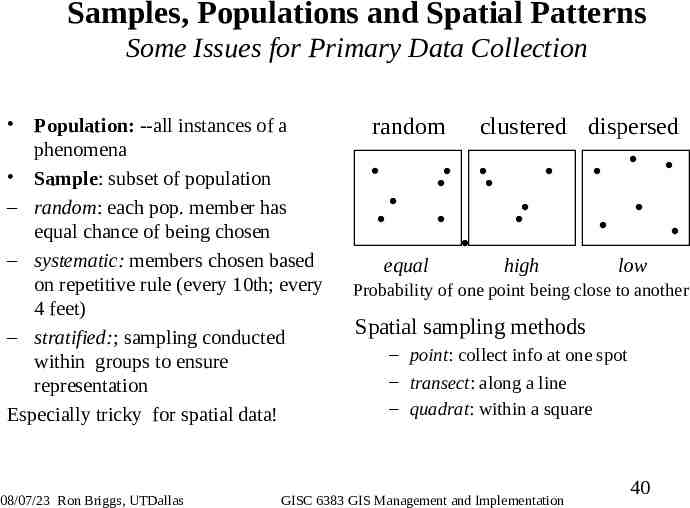
Samples, Populations and Spatial Patterns Some Issues for Primary Data Collection Population: --all instances of a phenomena Sample: subset of population – random: each pop. member has equal chance of being chosen – systematic: members chosen based on repetitive rule (every 10th; every 4 feet) – stratified:; sampling conducted within groups to ensure representation Especially tricky for spatial data! 08/07/23 Ron Briggs, UTDallas random equal clustered dispersed high low Probability of one point being close to another Spatial sampling methods – point: collect info at one spot – transect: along a line – quadrat: within a square GISC 6383 GIS Management and Implementation 40
Summary of Data Collection Issues Suitability/Appropriateness for the Task horizontal (and vertical) accuracy: – 33 feet USGS DOQ, versus 3 feet for urban needs documentation – often bad for administrative records currency and frequency of update – is date and/or update cycle appropriate? completeness – is undercount/omission a serious problem? – e.g. most ‘lists’ miss the poor (census undercounts); TIGER file once per decade aggregation and sampling – are they appropriate? cost -- highly associated with accuracy – is cost within budget? – is benefit greater than cost? 08/07/23 Ron Briggs, UTDallas GISC 6383 GIS Management and Implementation 41