Prioritizing Agency Needs Lakewood Resource & Referral Center 212
39 Slides2.56 MB
Prioritizing Agency Needs Lakewood Resource & Referral Center 212 Second Street, Suite 204 Lakewood, New Jersey 08701
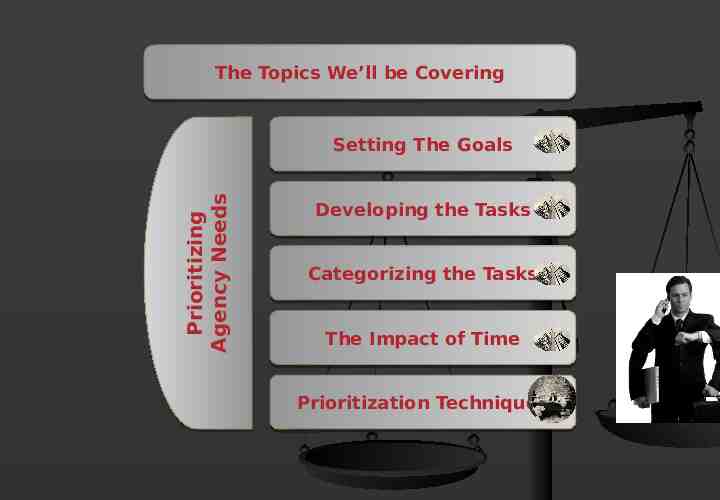
The Topics We’ll be Covering Prioritizing Prioritizing Agency Agency Needs Needs Setting The Goals Developing the Tasks Categorizing the Tasks The Impact of Time Prioritization Techniques
The Framework
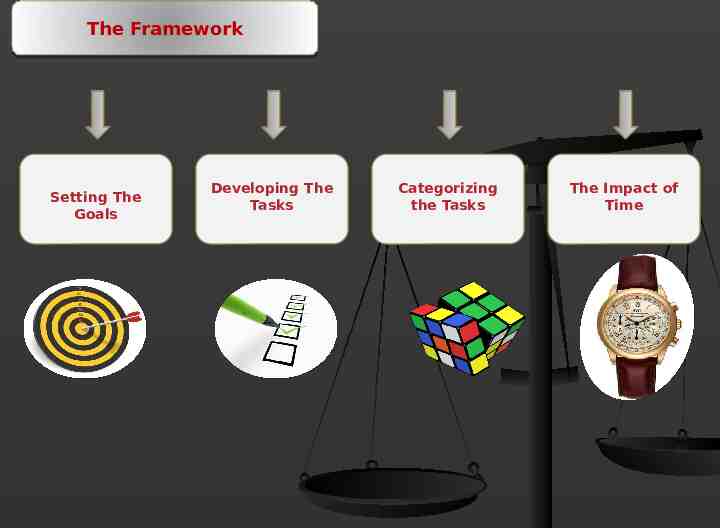
The Framework Setting The Goals Developing The Tasks Categorizing the Tasks The Impact of Time
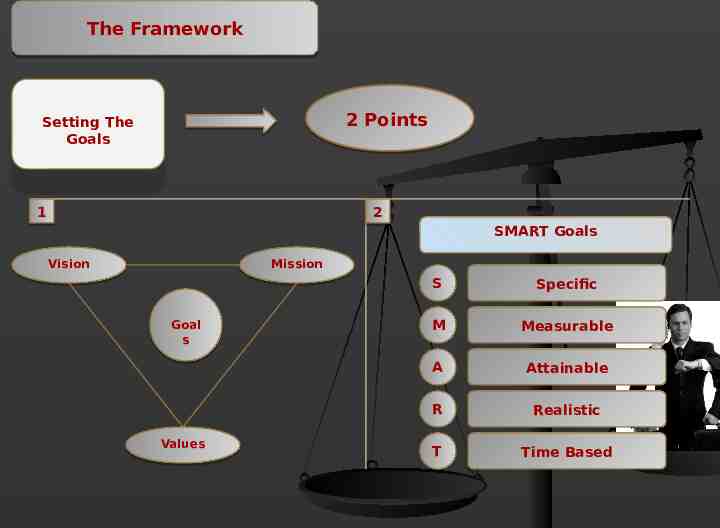
The Framework 2 Points Setting The Goals Setting The Goals 1 2 SMART Goals Vision Mission Goal s Values S Specific M Measurable A Attainable R Realistic T Time Based
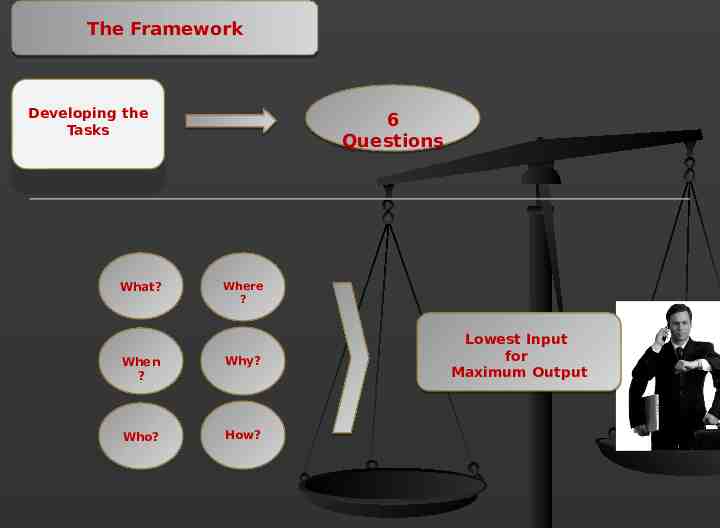
The Framework Developing the Tasks Developing the Tasks What? 6 Questions Where ? When ? Why? Who? How? Lowest Input for Maximum Output
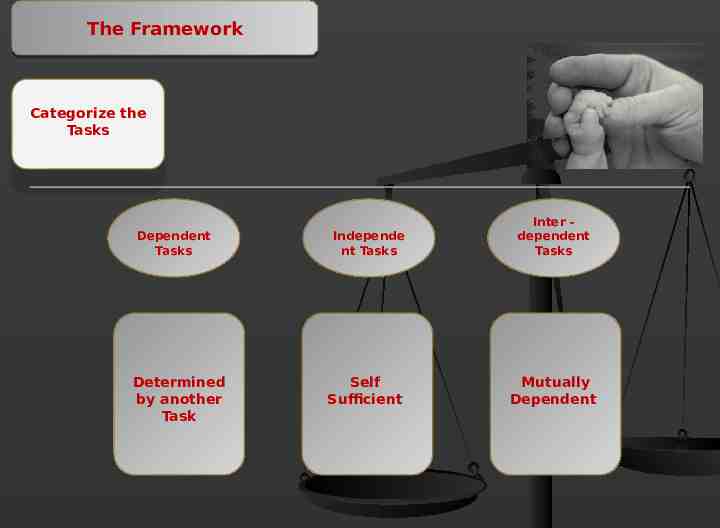
The Framework Categorize the Tasks Categorize the Tasks Dependent Tasks Determined by another Task Independe nt Tasks Self Sufficient Inter dependent Tasks Mutually Dependent
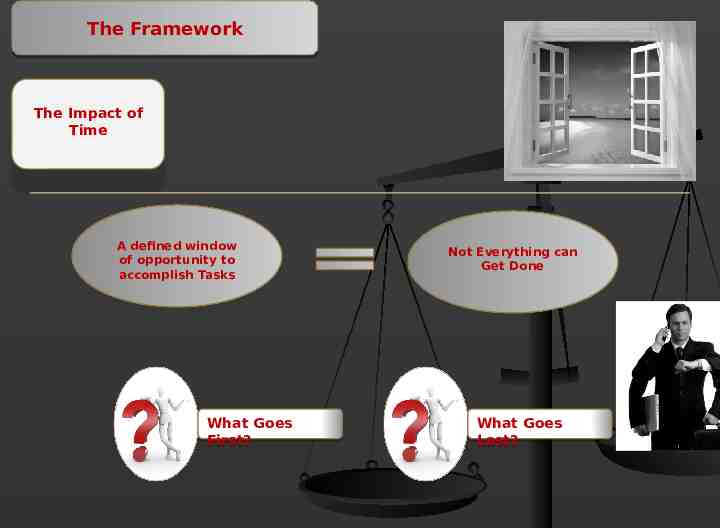
The Framework The Impact of Time The Impact of Time A defined window of opportunity to accomplish Tasks What Goes First? Not Everything can Get Done What Goes Last?
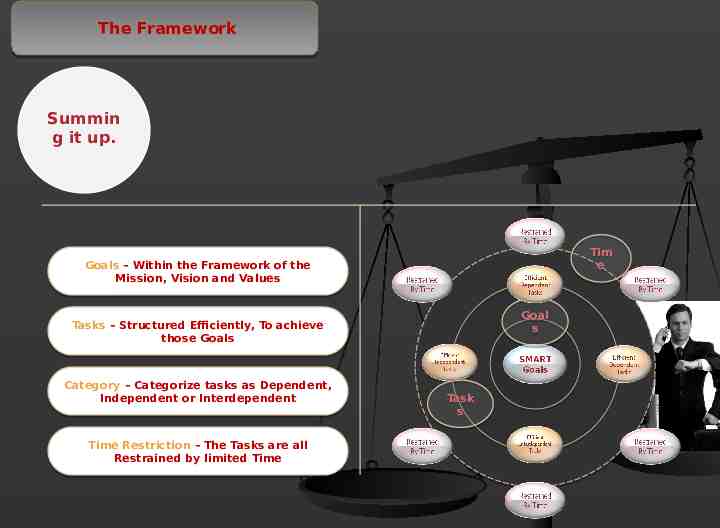
The Framework Summin g it up. Tim Tim e e Goals – Within the Framework of the Mission, Mission, Vision Vision and and Values Values Goal Goal s s Tasks Tasks –– Structured Structured Efficiently, Efficiently, To To achieve achieve those those Goals Goals Category Category – – Categorize Categorize tasks tasks as as Dependent, Dependent, Independent or Interdependent Time Restriction – The Tasks are all Restrained Restrained by by limited limited Time Time Task s s
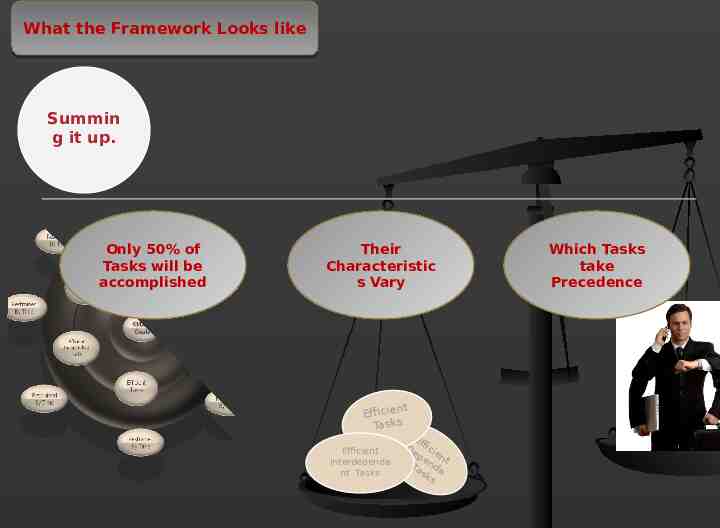
What the Framework Looks like Summin g it up. Only 50% of Tasks will be accomplished Their Characteristic s Vary nt Efficie Tasks Efficient Interdepende nt Tasks E De ffici e nt pen nt Ta de sk s Which Tasks take Precedence
Techniques for Prioritizing
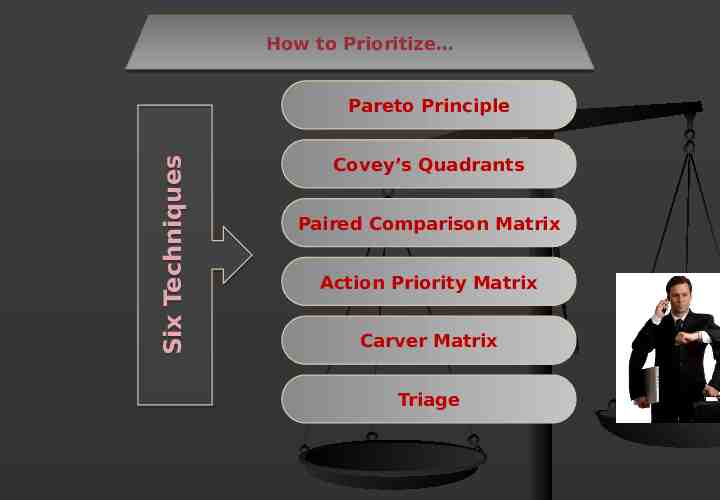
How to Prioritize Six Techniques Pareto Principle Covey’s Quadrants Paired Comparison Matrix Action Priority Matrix Carver Matrix Triage
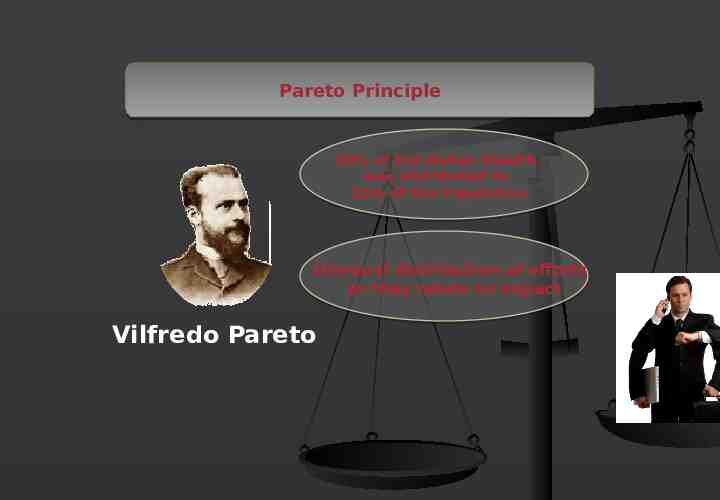
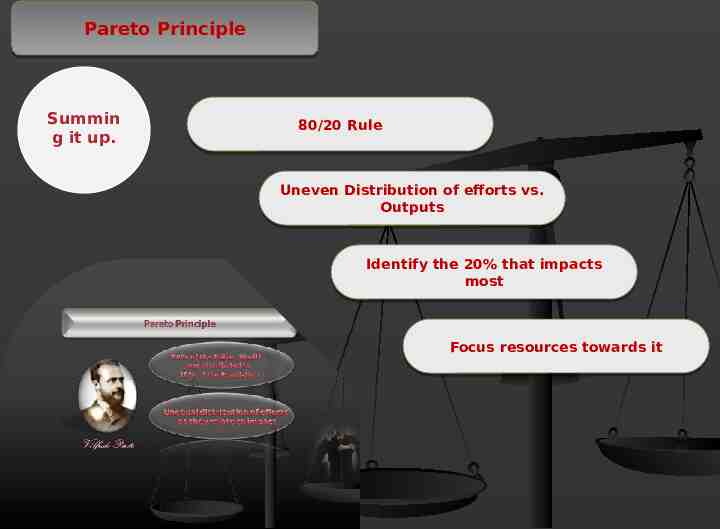
Pareto Principle 80% of the Italian Wealth was distributed to 20% of the Population Unequal distribution of efforts as they relate to impact Vilfredo Pareto
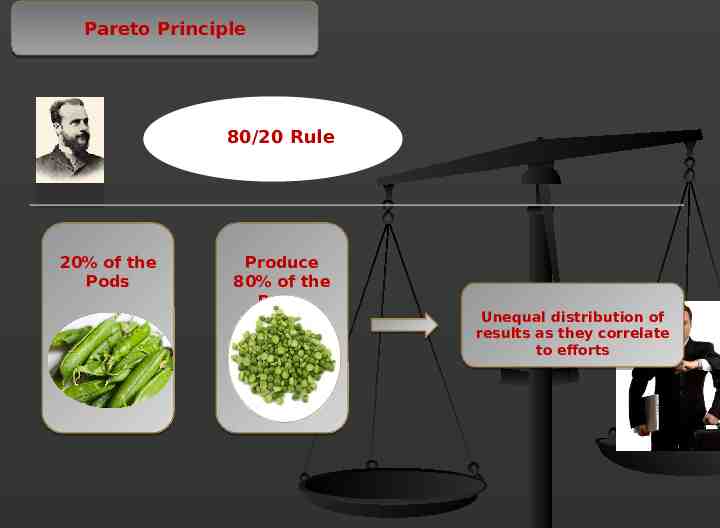
Pareto Principle 80/20 Rule 20% of the Pods Produce 80% of the Peas Unequal distribution of results as they correlate to efforts
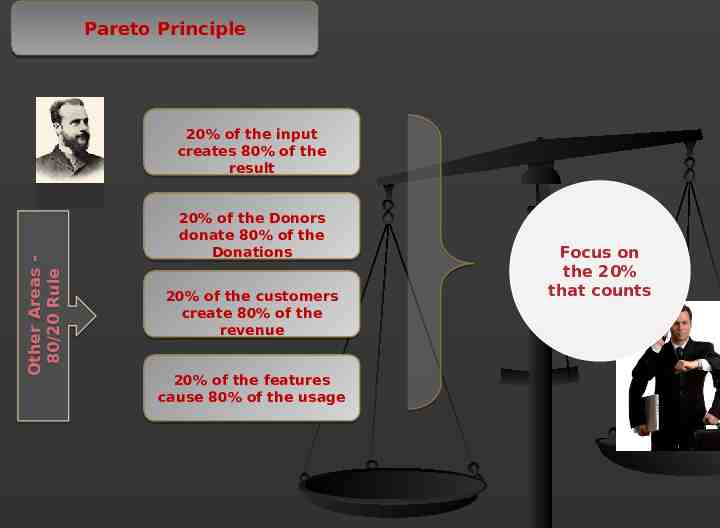
Pareto Principle Other Other Areas Areas -80/20 80/20 Rule Rule 20% of the input creates 80% of the result 20% of the Donors donate 80% of the Donations 20% of the customers create 80% of the revenue 20% of the features cause 80% of the usage Focus on the 20% that counts
Pareto Principle Summin g it up. 80/20 80/20 Rule Rule Uneven Uneven Distribution Distribution of of efforts efforts vs. vs. Outputs Outputs Identify 20% that Identify the the 20% that impacts impacts most most Focus Focus resources resources towards towards it it
Covey’s Quadrant’s Organize and Execute around Priorities The Four quadrants that all tasks fit into Stephen R. Covey
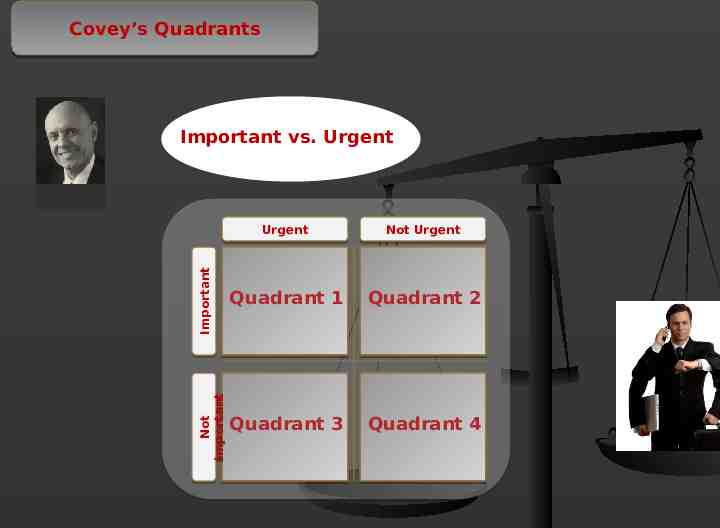
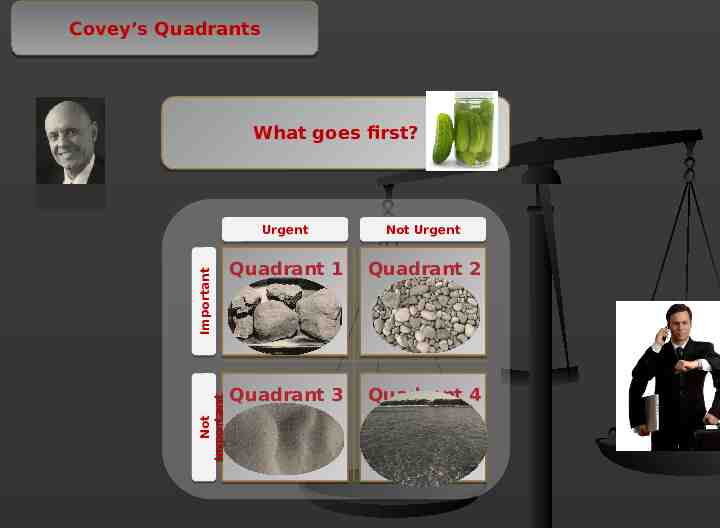
Covey’s Quadrants Urgent Not Urgent Important Important Quadrant 1 Quadrant 2 Not Not Important Important Important vs. Urgent Quadrant 3 Quadrant 4
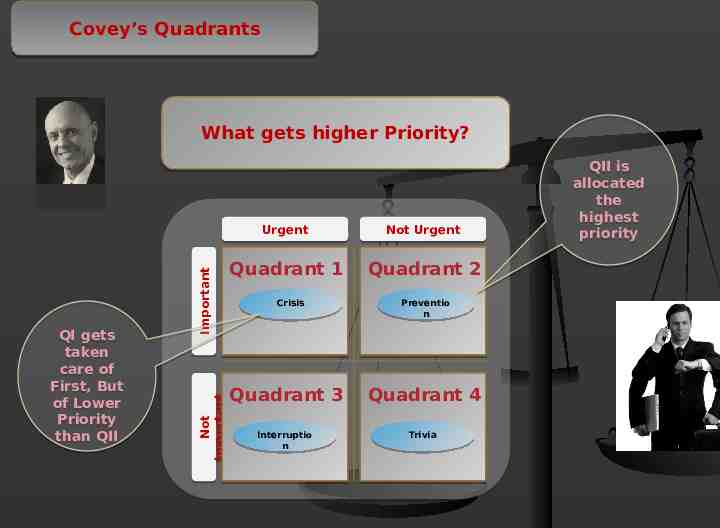
Covey’s Quadrants Not Not Important Important QI gets taken care of First, But of Lower Priority than QII Important Important What gets higher Priority? Urgent Not Urgent Quadrant 1 Quadrant 2 Crisis Crisis Preventio Preventio n n Quadrant 3 Quadrant 4 Interruptio Interruptio n n Trivia Trivia QII is allocated the highest priority
Covey’s Quadrants Not Not Important Important Important Important What goes first? Urgent Not Urgent Quadrant 1 Quadrant 2 Quadrant 3 Quadrant 4
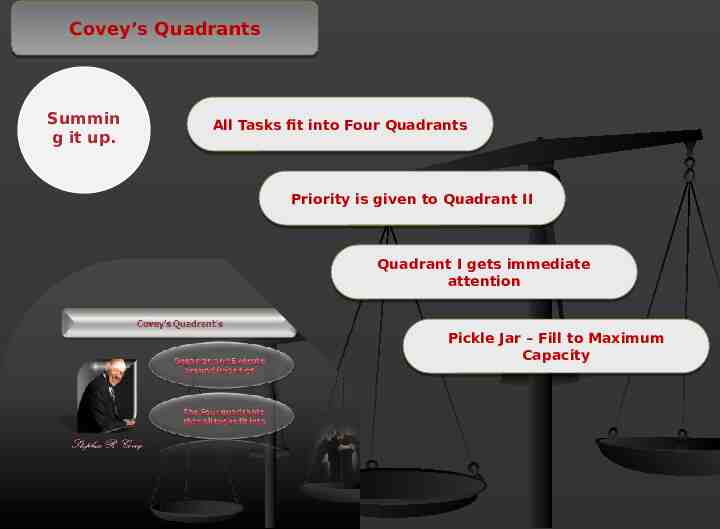
Covey’s Quadrants Summin g it up. All All Tasks Tasks fit fit into into Four Four Quadrants Quadrants Priority Priority is is given given to to Quadrant Quadrant II II Quadrant Quadrant II gets gets immediate immediate attention attention Pickle Pickle Jar Jar –– Fill Fill to to Maximum Maximum Capacity Capacity
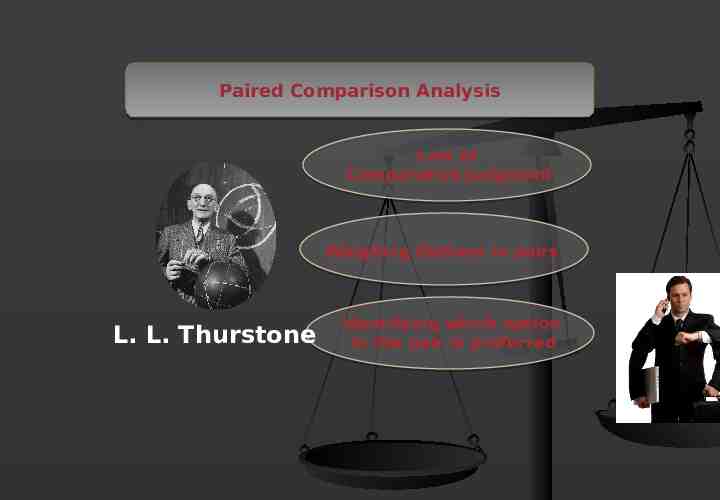
Paired Comparison Analysis Law of Comparative Judgment Weighing Options in pairs L. L. Thurstone Identifying which option in the pair is preferred
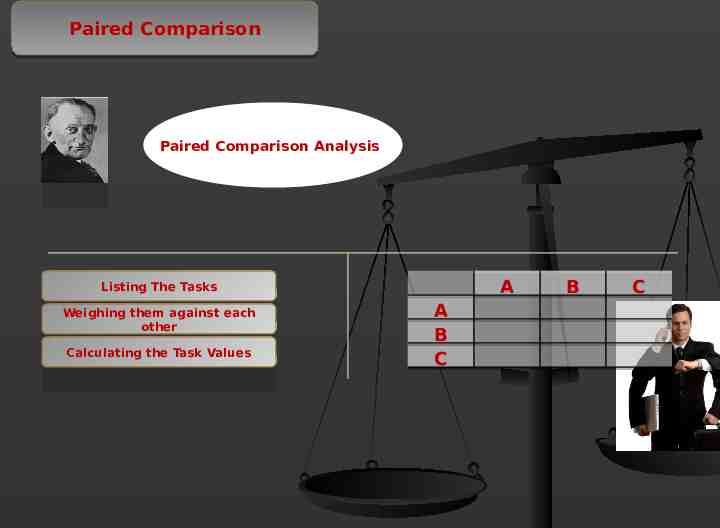
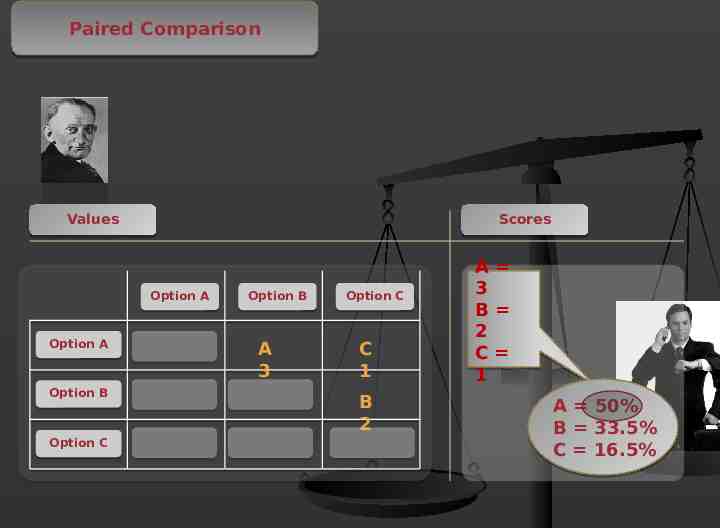
Paired Comparison Paired Comparison Analysis A Listing The Tasks Listing The Tasks each Weighing them against other Weighing them against each Calculatingother the Task Values Calculating the Task Values A B C B C
Paired Comparison Values Scores Option A Option A Option B Option C Option B A 3 Option C C 1 B 2 A 3 B 2 C 1 A 50% B 33.5% C 16.5%
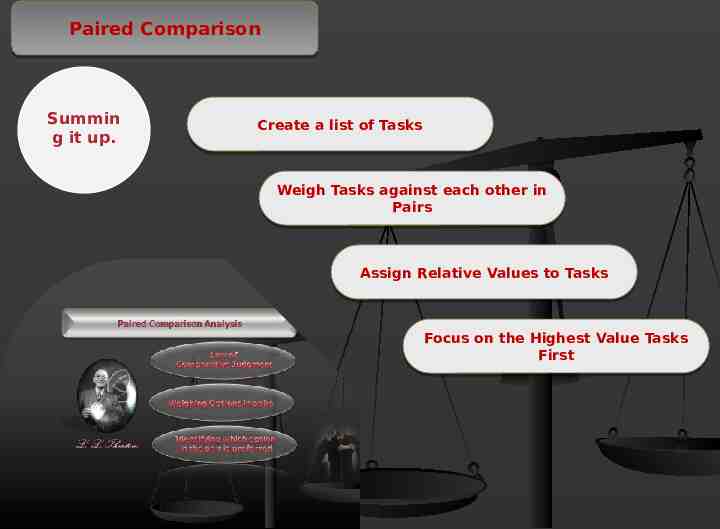
Paired Comparison Summin g it up. Create Create a a list list of of Tasks Tasks Weigh Weigh Tasks Tasks against against each each other other in in Pairs Pairs Assign Assign Relative Relative Values Values to to Tasks Tasks Focus Focus on on the the Highest Highest Value Value Tasks Tasks First First
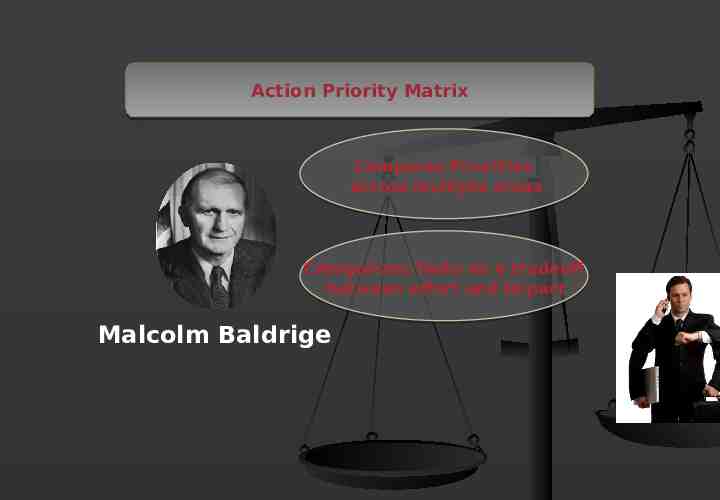
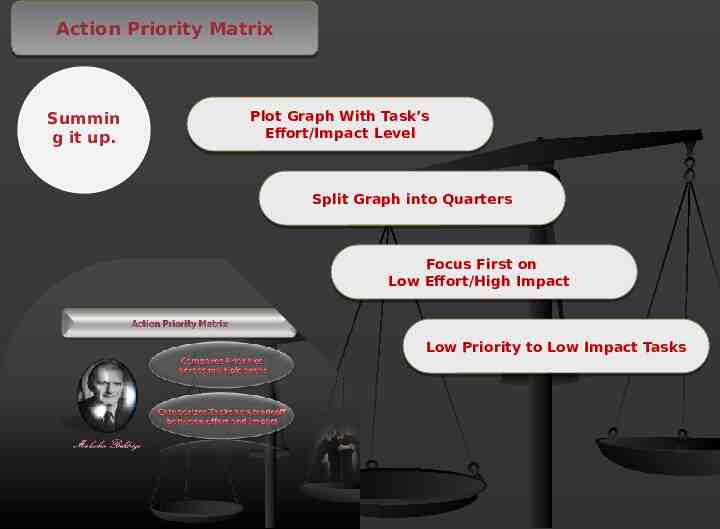
Action Priority Matrix Compares Priorities across multiple areas Categorizes Tasks as a tradeoff between effort and Impact Malcolm Baldrige
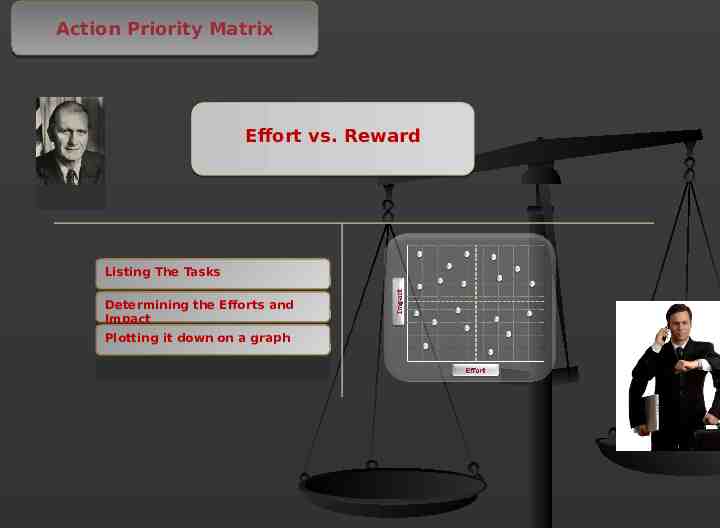
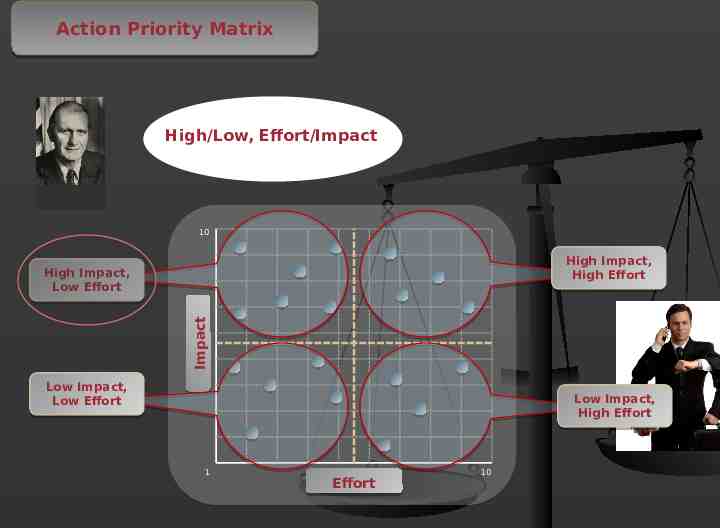
Action Priority Matrix Effort vs. Reward Listing The Tasks Listing The Tasks Determining the Efforts and Impact Determining the Efforts and Plotting it down on a graph Impact Plotting it down on a graph
Action Priority Matrix High/Low, Effort/Impact 10 High Impact, High Effort Impact Impact High Impact, Low Effort Low Impact, Low Effort Low Impact, High Effort 1 Effort 10
Action Priority Matrix Summin g it up. Plot Plot Graph Graph With With Task’s Task’s Effort/Impact Effort/Impact Level Level Split Split Graph Graph into into Quarters Quarters Focus Focus First First on on Low Low Effort/High Effort/High Impact Impact Low Low Priority Priority to to Low Low Impact Impact Tasks Tasks
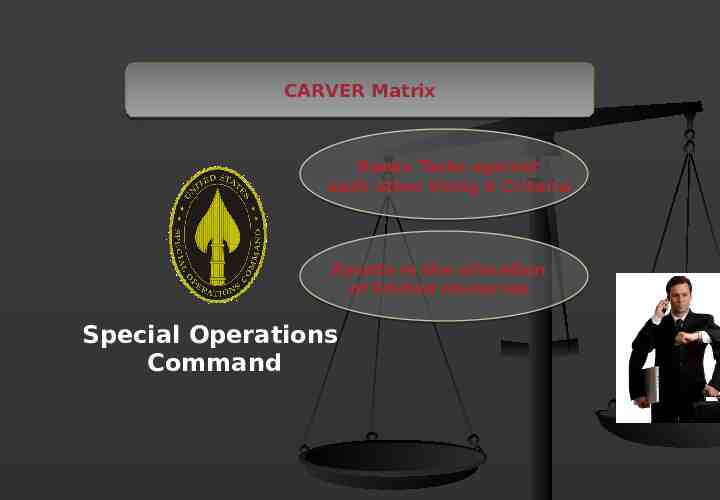
CARVER Matrix Ranks Tasks against each other Using 6 Criteria Assists in the allocation of limited resources Special Operations Command
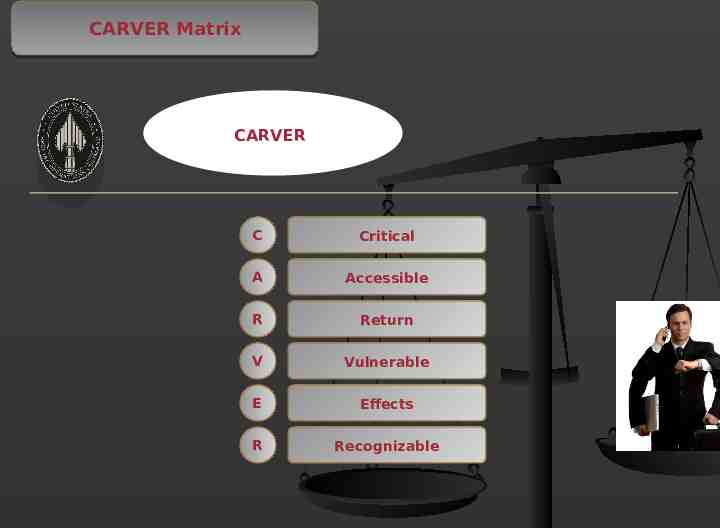
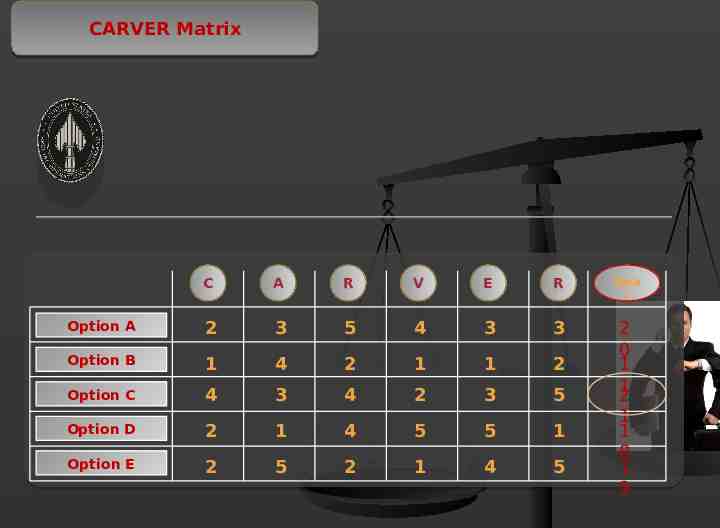
CARVER Matrix CARVER C Critical A Accessible R Return V Vulnerable E Effects R Recognizable
CARVER Matrix C A R V E R Tota l Option A 2 3 5 4 3 3 Option B 1 4 2 1 1 2 Option C 4 3 4 2 3 5 2 0 1 1 2 Option D 2 1 4 5 5 1 Option E 2 5 2 1 4 5 1 1 8 1 9
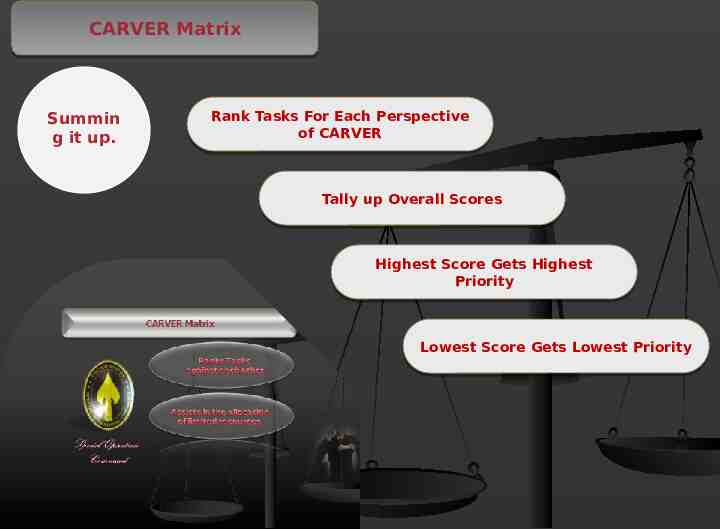
CARVER Matrix Summin g it up. Rank Tasks For Rank Tasks For Each Each Perspective Perspective of of CARVER CARVER Tally Tally up up Overall Overall Scores Scores Highest Score Gets Highest Score Gets Highest Highest Priority Priority Lowest Lowest Score Score Gets Gets Lowest Lowest Priority Priority
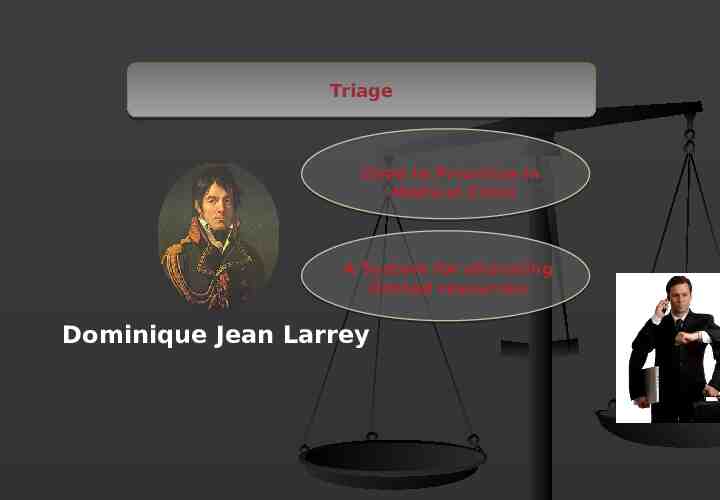
Triage Used to Prioritize in Medical Crisis A System for allocating limited resources Dominique Jean Larrey
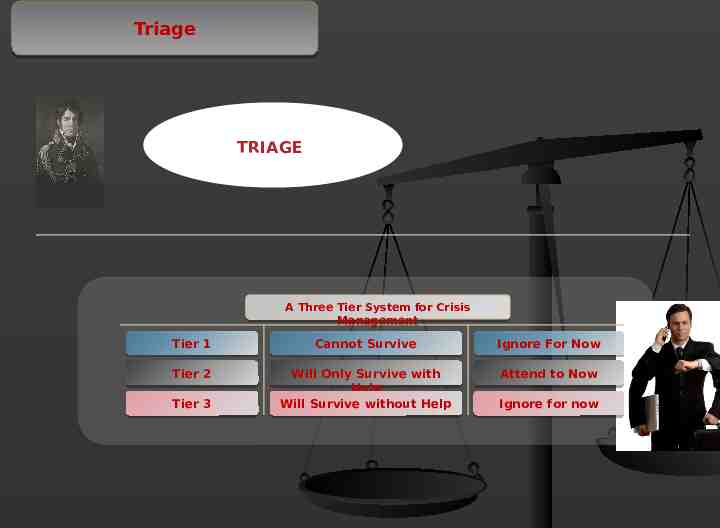
Triage TRIAGE A A Three Three Tier Tier System System for for Crisis Crisis Management Management Tier 1 Cannot Survive Ignore For Now Tier 2 Will Only Survive with Help Will Survive without Help Attend to Now Tier 3 Ignore for now
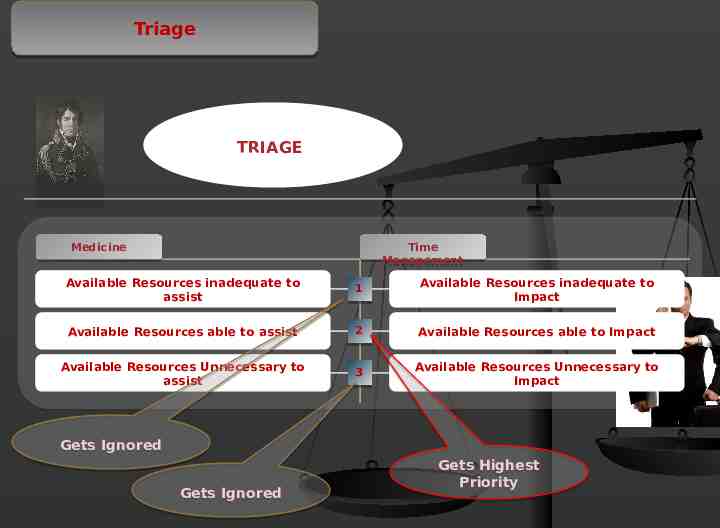
Triage TRIAGE Medicine Time Management Available Resources inadequate to assist 1 1 Available Resources inadequate to Impact Available Resources able to assist 2 Available Resources able to Impact Available Resources Unnecessary to assist 3 3 Available Resources Unnecessary to Impact Gets Ignored Gets Ignored Gets Highest Priority
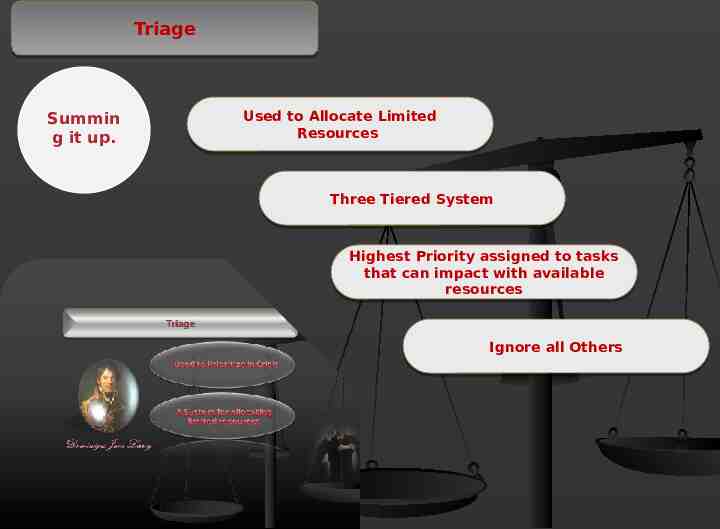
Triage Summin g it up. Used to Allocate Used to Allocate Limited Limited Resources Resources Three Three Tiered Tiered System System Highest Highest Priority Priority assigned assigned to to tasks tasks that that can can impact impact with with available available resources resources Ignore Ignore all all Others Others
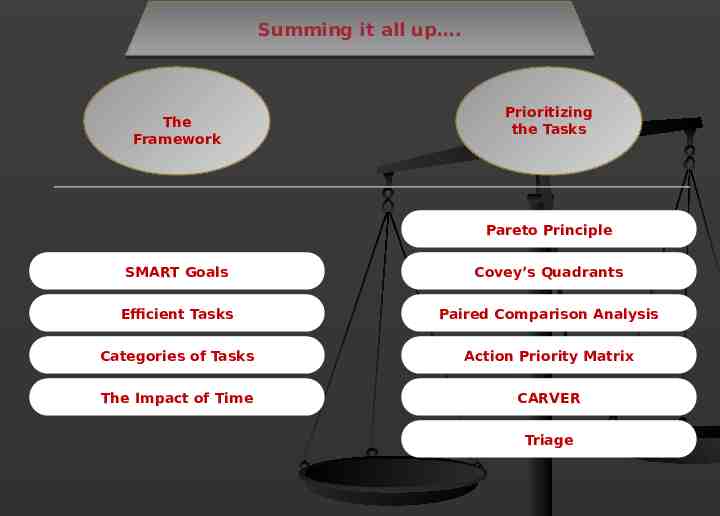
Summing it all up . The Framework Prioritizing the Tasks Pareto Principle SMART Goals Covey’s Quadrants Efficient Tasks Paired Comparison Analysis Categories of Tasks Action Priority Matrix The Impact of Time CARVER Triage
Thank You. Q&A