Global Asset Allocation and Stock Selection Global Asset Allocation:


55 Slides502.00 KB
Global Asset Allocation and Stock Selection Global Asset Allocation: The Case For International Investment Campbell R. Harvey, Ph.D., Professor, Duke University http://www.duke.edu/ charvey 1
The Plan International track record Returns and diversification Long horizon vs. short horizon What can we expect from U.S. equities? What to expect from international? Alternative views: dynamic strategies, hedge funds Research frontier – changing views of diversification Importance of GPR 2
The International Track Record U.S. Investments Versus Non-U.S. Equities 13.0% Wilshire Mid Cap 12.0% Thirty Year Treasury STRIP Return (May 1986 to June 2002) Twenty Year Treasury STRIP Wilshire Large Cap 11.0% Wilshire 5000 Ten Year Treasury STRIP 10.0% EAFE X-Japan 9.0% Seven Year Treasury STRIP Credit MBS Five Year Treasury STRIP Aggregate Government Three Year Treasury STRIP Two Year STRIP 8.0% 7.0% Wilshire Small Cap EAFE One Year Treasury STRIP 6.0% 0% 5% Source: Erb and Harvey (2002) 10% 15% Volatility (M ay 1986 to June 2002) 20% 25% 3
us tr A alia u Be stri lg a Ca ium D na en da m Fi ark nl Fr and G an H erm ce on a g ny K Ire ong la n Ita d N J ly e N the apa ew rl n Ze and a s N lan o d Po rwa rtu y g Sp al Sw Swe ain itz de er n la n Ud K U W or W S ld or ex ld -U EA S FE A Returns and Diversification Average Annual Returns During U.S. Business Cycle Phases 30 20 10 0 -10 -20 -30 Expansion geometric mean Data from MSCI Recession geometric mean 4
Returns and Diversification Average Returns During U.S. Business Cycle Phases 30 Annual Return U.S. 20 10 0 -10 -20 -30 a n i l le a i a ic t e y i a a l n a a o o i a n n u s d a a ia a a n d y a e e in hrai razCh i h in mb ubl gy p eec gar Ind esi srae rda ore ysi x ic cc ger ma ista Per inelan ssi abi ak fric ankiwa ilan rke uel bwosit t e o u a p n B C lo ep E Gr un on I Jo K ala M or Ni O ak lip Po R i Ar lovh A ri L Ta ha Tu n ezmb mp o g e Ba d r P S i e R H T t S C h M M d A In V Zi Co Ph c au So u e S Cz Expansion geometric mean Data from IFC Recession geometric mean 5
Returns and Diversification Average Annual Volatility During U.S. Business Cycle Phases 60 50 40 30 20 10 0 l lia tria ium ada ark land nce any ong and taly pan nds and ay ga pain den and UK US orld US FE a tr us lg n m n a K el I Ja rla eal orw rtu S we erl W ex EA o e z us A Be Ca en Fi Fr erm ng Ir t S h Z N P i A D G o rld et e w w o S H N N W Expansion std.dev. Data from MSCI Recession std.dev. 6
Returns and Diversification Correlations During U.S. Business Cycle Phases 1 0.8 0.6 0.4 0.2 0 -0.2 l lia stria ium ada ark land nce any ong and taly pan nds and ay ga pain den land UK US orld US FE a l w r u t u lg n m n a K e I Ja rla eal or rt S we er W ex EA o e z us A Be Ca en Fi Fr erm ng Ir S it A th w Z N P ld D G o e or Sw H N Ne W Expansion correlation with US Data from MSCI Recession correlation with US 7
us tr A alia u Be stri lg a Ca ium D na en da m Fi ark nl Fr and G an c H erm e on a g ny K Ire ong la n Ita d N J ly e N the apa ew rl n Ze and a s N lan or d Po wa rtu y g Sp al Sw Swe ain itz de er n la nd U K U W or W S ld or e x ld -U EA S FE A Returns and Diversification Covariances During U.S. Business Cycle Phases 45 40 35 30 25 20 15 10 5 0 Expansion covariance with US Data from MSCI Recession covariance with US 8
us t A ralia u Be stri lg a Ca ium D na en d a m Fi ark nl Fr and G an H e rm c e on a g ny K Ire ong la n Ita d N J ly e N the apa ew rl n Ze and a s N lan or d Po wa rtu y g Sp al Sw Swe ain itz de er n la nd U K U W or W S ld or ex ld EAUS FE A Returns and Diversification Average Returns During U.S. Up and Down Markets 60 40 20 0 -20 -40 -60 US geometric mean Data from MSCI US- geometric mean 9
Returns and Diversification Average Returns During U.S. Up and Down Markets 60 Annual Return U.S. 40 20 0 -20 -40 -60 a n i l l e a i a i c t e y ia a l n a a o o i a n n u s d a a i a a a n d y a e e in rai razChi hin mb ubl g yp eec gar Ind esi srae rd a ore ysi xi c cc ger ma ista Per inelan ssi abi ak fric ankiwa ilan rke uel bwosit t a e o u p n h B C lo ep E Gr un on I Jo K ala M or Ni O ak lip Po R i Ar lovh A ri L Ta h a Tu n ezmb mp o g e Ba d r P S i e H In T t S C hR M M d A V Zi C o Ph c au Sou e S Cz US geometric mean Data from IFC US- geometric mean 10
us tr A alia u Be stri lg a Ca ium D na en da m Fi ark nl Fr and G an H erm ce on a g ny K Ire ong la n Ita d N J ly e N the apa ew rl n Ze and a s N lan or d Po wa rtu y g Sp al Sw Swe ain itz de er n la nd U K U W or W S ld or ex ld -U EA S FE A Returns and Diversification Correlations with U.S. Conditional on U.S. Returns 1 0.8 0.6 0.4 0.2 0 -0.2 Correlation with US when US Data from MSCI Correlation with US when US11
Returns and Diversification Correlations with U.S. Conditional on U.S. Returns 0.7 0.6 0.5 0.4 0.3 0.2 0.1 0 -0.1 -0.2 a n i l l e a ia i c t e y ia a l n a a o i a n n u s d a a ia a a n d y a e e in rai razChi hin mb u bl gy p eec g ar In d esi srae rd a ore y si xi c ccoger ma ista Per in elan ssi ab i ak fric ankiwa ilan rk e u el b wo sit t e h r u a o n a i B C l o ep E G u n on I Jo K al M or N O ak lip p Po R i Ar lo vh A ri L Ta h a Tu n ez mb mp o g e Ba d r P S i e R H T i t C h M M A In V Z Co ud ou S Ph ec S Sa z C Correlation with US when US Data from IFC Correlation with US when US12
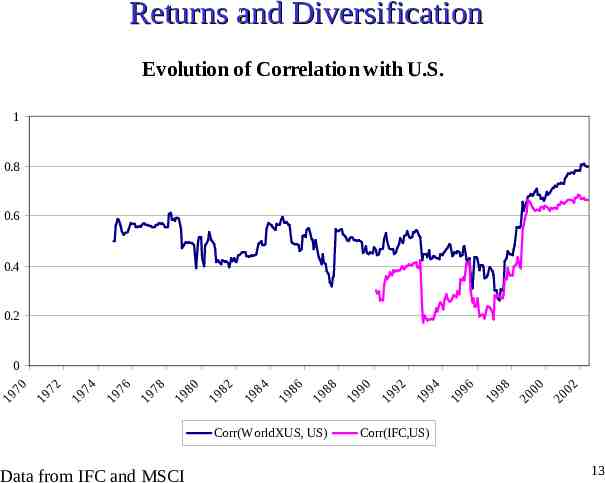
Returns and Diversification Evolution of Correlation with U.S. 1 0.8 0.6 0.4 0.2 Corr(WorldXUS, US) Data from IFC and MSCI 02 20 00 20 98 19 96 19 94 19 92 19 90 19 88 19 86 19 84 19 82 19 80 19 78 19 76 19 74 19 72 19 19 70 0 Corr(IFC,US) 13
The Long Horizon 100 Years of Real Equity Returns 9 8 7 6 5 4 3 2 1 0 Au al st r ia B el u gi m Ca d na k an an d ce ar n m l nm Fra Ger Ire e D a Ita ly pa Ja n th Ne l er d an s u So Data from Dimson, Marsh and Stauton (2002) th ric Af a a Sp in e ed w S n UK S. U. ld US or X W ld r o W 14
The Long Horizon 100 Years of Real Equity Returns 20 15 10 5 0 1910 1920 1930 1940 1950 1960 1970 1980 1990 2000 -5 U.S. equity World X-US equity Data from Dimson, Marsh and Stauton (2002) 15
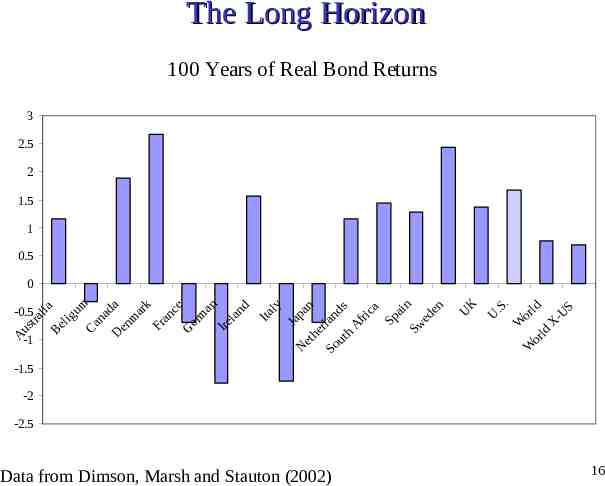
The Long Horizon 100 Years of Real Bond Returns 3 2.5 2 1.5 1 0.5 0 a k an a n d ce -0.5 alia ig um ad ar n m l a r n r m st el Fr Ire Ca Den Ge u B A-1 Ita ly pa Ja n Ne e th rl d an s ut o S h ric f A a a Sp in de e Sw n UK S. U. ld US or X W ld r o W -1.5 -2 -2.5 Data from Dimson, Marsh and Stauton (2002) 16
The Long Horizon 100 Years of Real Bond Returns 10 5 0 1910 1920 1930 1940 1950 1960 1970 1980 1990 2000 -5 -10 U.S. World X-US Data from Dimson, Marsh and Stauton (2002) 17
What to Expect Dividend Yields Correlated With Future Returns Dividend Yield 8 7 6 5 4 3 2 1 0 1900 Yield Data from Dimson, Marsh and Stauton (2002) 2000 Yield 18
What to Expect Price to Trailing Peak Earnings Vs 5 Year Average CPI (overlapping annual data) (1920- August 2002) 35 Price to Trailing Peak Earnings 30 1996-2001 25 20 Current environment: Inflation: 2.3% P/E: 17.0x 15 . 10 5 Source: Bloomberg, Standard & Poor’s 0 -10.0% -5.0% Source: Goldman Sachs (2002) 0.0% 5.0% 5 yr Average CPI 10.0% 15.0% 20.0% 19
What to Expect Ten-year risk premium around 3.5% and stable whereas one-year risk premium quite variable 6 6 5 5 4 4 3 3 2 2 1 1 0 0 6-Jun-00 7-Jun-01 4-Jun-02 7-Sep-00 10-Sep-01 16-Sep-02 4-Dec-00 4-Dec-01 2-Dec-02 12-Mar-01 11-Mar-02 10-year premium Source: Graham and Harvey (2002) 6-Jun-00 7-Jun-01 4-Jun-02 7-Sep-00 10-Sep-01 16-Sep-02 4-Dec-00 4-Dec-01 2-Dec-02 12-Mar-01 11-Mar-02 1-year premium 20
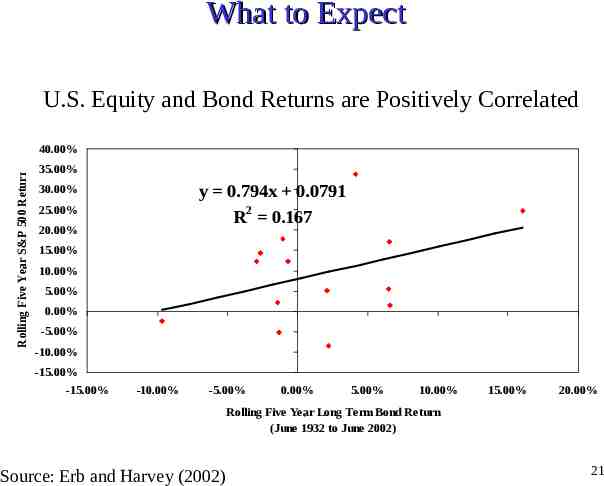
What to Expect U.S. Equity and Bond Returns are Positively Correlated Rolling Five Year S&P 500 Return 40.00% 35.00% y 0.794x 0.0791 2 R 0.167 30.00% 25.00% 20.00% 15.00% 10.00% 5.00% 0.00% -5.00% -10.00% -15.00% -15.00% -10.00% -5.00% 0.00% 5.00% 10.00% 15.00% 20.00% Rolling Five Year Long Term Bond Return (June 1932 to June 2002) Source: Erb and Harvey (2002) 21
What to Expect World Real Equity and Real Bond Returns are Positively Correlated 40 Ten Year Real Stock Return 30 y 0.6783x 4.815 20 2 R 0.3984 10 0 -10 -20 -30 -40 -30 -20 -10 0 10 20 Ten Year Real Bond Return Source: Erb and Harvey (2002) 22
What to Expect Inflation Negatively Related to Real Bill Returns 15.0% T-Bill Real Return 10.0% 5.0% 0.0% -5.0% -10.0% y -0.7078x 0.0294 2 -15.0% R 0.5373 -20.0% -15.0% -10.0% -5.0% 0.0% 5.0% 10.0% 15.0% 20.0% Inflation Source: Erb and Harvey (2002) 23
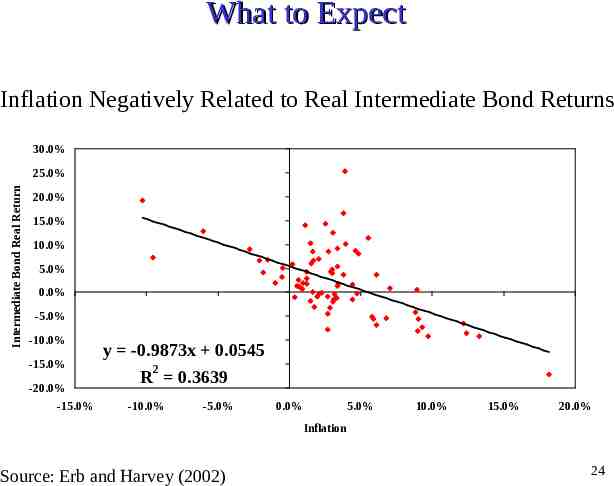
What to Expect Inflation Negatively Related to Real Intermediate Bond Returns 30.0% Intermediate Bond Real Return 25.0% 20.0% 15.0% 10.0% 5.0% 0.0% -5.0% -10.0% -15.0% -20.0% -15.0% y -0.9873x 0.0545 2 R 0.3639 -10.0% -5.0% 0.0% 5.0% 10.0% 15.0% 20.0% Inflation Source: Erb and Harvey (2002) 24
What to Expect Inflation Negatively Related to Real Bond Returns 40.0% Long Bond Real Return 30.0% 20.0% 10.0% 0.0% -10.0% -20.0% y -1.3027x 0.0664 2 R 0.2767 -30.0% -15.0% -10.0% -5.0% 0.0% 5.0% 10.0% 15.0% 20.0% Inflation Source: Erb and Harvey (2002) 25
What to Expect Inflation Negatively Related to Real Equity Returns 60.0% S&P Real Return 40.0% 20.0% 0.0% -20.0% y -1.1054x 0.1299 2 R 0.0546 -40.0% -60.0% -15.0% -10.0% -5.0% 0.0% 5.0% 10.0% 15.0% 20.0% Inflation Source: Erb and Harvey (2002) 26
What to Expect Inflation Negatively Related to Real International Bill Returns 4 100 Year Real Bill Return 3 2 1 0 -1 y -0.9226x 4.7819 2 R 0.8021 -2 -3 -4 -5 0 1 2 3 4 5 6 7 8 9 10 100 Year Inflation Rate Source: Erb and Harvey (2002) 27
What to Expect Inflation Negatively Related to Real International Bill Returns 100 Year Real Bond Return 3 2 1 0 y -0.6731x 3.9725 -1 2 R 0.6097 -2 -3 0 1 2 3 4 5 6 7 8 9 10 100 Year Inflation Rate Source: Erb and Harvey (2002) 28
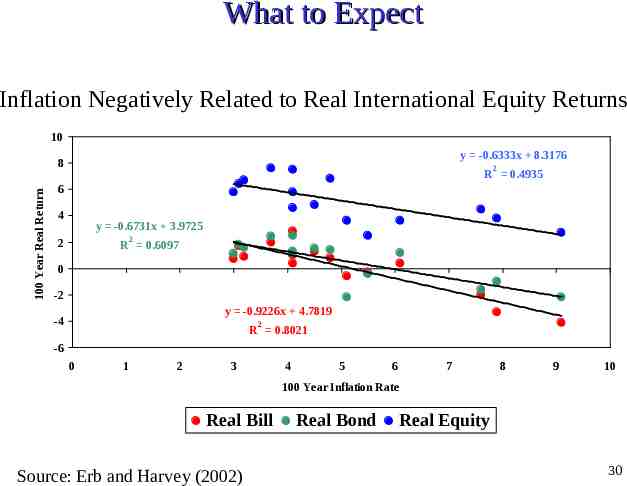
What to Expect Inflation Negatively Related to Real International Equity Returns 8 100 Year Real Equity Return 7 6 5 4 y -0.6333x 8.3176 3 R 0.4935 2 2 1 0 0 1 2 3 4 5 6 7 8 9 10 100 Year Inflation Rate Source: Erb and Harvey (2002) 29
What to Expect Inflation Negatively Related to Real International Equity Returns 10 y -0.6333x 8.3176 100 Year Real Return 8 2 R 0.4935 6 4 y -0.6731x 3.9725 2 2 R 0.6097 0 -2 y -0.9226x 4.7819 -4 2 R 0.8021 -6 0 1 2 3 4 5 6 7 8 9 10 100 Year Inflation Rate Real Bill Source: Erb and Harvey (2002) Real Bond Real Equity 30
Alternative Vehicles Alternate Asset Classes Often Involve Implicit or Explicit Options 7 6 5 4 3 2 1 0 -1 -2 -3 -4 S&P 500 Global Macro 1 Source: Naik (2002) 2 3 4 5 31
Alternative Vehicles Alternate Asset Classes Often Involve Implicit or Explicit Options 8 6 4 2 S&P 500 Trend Followers 0 -2 -4 -6 -8 1 Source: Naik (2002) 2 3 4 5 32
Alternative Vehicles Alternate Asset Classes Often Involve Implicit or Explicit Options 7 6 5 4 3 2 1 0 -1 -2 -3 -4 S&P 500 FI Arb 1 Source: Naik (2002) 2 3 4 5 33
Alternative Vehicles Alternate Asset Classes Often Involve Implicit or Explicit Options 2 1.5 1 0.5 Delta(BAA-10yTBond) x10 FI Arb 0 -0.5 -1 -1.5 -2 1 2 Source: Naik (2002) 3 4 5 34
Alternative Vehicles Alternate Asset Classes Often Involve Implicit or Explicit Options .1 Panel B: PRAM Returns, 1990 - 1998 Risk Arb Return - Risk-free Rate .08 .06 9002 9811 9602 9504 9706 9011 9410 9704 9107 9010 9411 9004 9304 9607 9710 9407 9712 9310 9311 9312 9308 9402 9801 9804 9610 9006 9606 9105 9101 9508 92019301 9207 9604 9408 9611 9005 9208 9306 9106 9807 9608 9701 9303 9409 9702 9605 9507 9404 9509 9505 9812 9203 9412 9405 9506 9502 9806 9112 9802 9210 9307 9708 9206 9501 9603 9512 9510 9205 9209 9202 9511 9612 9109 9705 9108 9805 9104 9810 9003 9609 9711 9110 9302 9103 9211 9305 9707 9403 9406 9309 9212 9401 9204 9503 9709 9102 9001 9703 9007 9601 9803 9111 .04 .02 0 -.02 9008 9012 9808 -.04 9809 -.06 9009 -.08 -.1 -.2 -.16 -.12 -.08 -.04 0 .04 .08 .12 .16 .2 Market Return minus Risk-free Rate 35 Source: Figure 5 from Mitchell & Pulvino (2000)
Alternative Vehicles Alternate Asset Classes Often Involve Implicit or Explicit Options 6 Event Driven Index Returns 4 2 0 -15 -10 -5 0 5 10 -2 -4 LOWESS fit -6 -8 Source: Naik (2002) Russell 3000 Index Returns 36
Rethinking Risk Traditional models maximize expected returns for some level of volatility Is volatility a complete measure of risk? 37
Rethinking Risk Much interest in downside risk, asymmetric volatility, semi-variance, extreme value analysis, regime-switching, jump processes, . 38
Rethinking Risk . These are just terms that describe the skewness in returns distributions. Most asset allocation work operates in two dimensions: mean and variance -- but skew is important for investors. Examples: 39
Rethinking Risk 1. The 1 lottery ticket. The expected value is 0.45 (hence a -55%) expected return. – Why is price so high? – Lottery delivers positive skew, people like positive skew and are willing to pay a premium 40
Rethinking Risk 2. High implied vol in out of the money OEX put options. – Why is price so high? – Option limits downside (reduces negative skew). – Investors are willing to pay a premium for assets that reduce negative skew 41
Rethinking Risk 3. Some stocks that trade with seemingly “too high” P/E multiples – Why is price so high? – Enormous upside potential (some of which is not well understood) – Investors are willing to pay a premium for assets that produce positive skew – [Note: Expected returns could be small or negative!] 42
Rethinking Risk 12.5 2 Expected Return 10 7.5 5 1 0 0 5 Variance - 1 10 15 Source: Harvey and Siddique (2000) Skewness - 2 43
Rethinking Risk Average Skewness in Developed Markets 1 0.5 0 -0.5 -1 -1.5 -2 l lia stria ium ada ark land nce any ong and taly pan nds and ay ga pain den land UK a l w u r I t u lg n m n a K e Ja erla eal or ort S we zer us A Be Ca en Fi Fr ermng Ir S it A th w Z N P D G o e Sw H N Ne Data from MSCI S d U o rl -US FE W ex EA ld or W 44
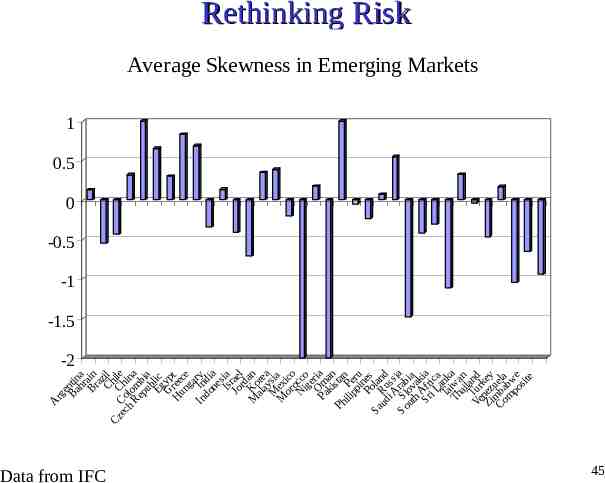
rg e Bantin hr a Br ain a Chzil Cz i ec Co Chi le h lo na Re m pu bia b Eg lic G yp H ree t un ce ga In In ry do d i ne a Is sia Jo rae rd l M Ko an ala re a M ysia M ex or ico o N cco ig er PaOm ia ki an Ph stan ili Pe p p ru i Po nes Sa la ud Ru nd i A ss So Sl rab ia ut ov ia h ak Sr Afr ia i L ica Ta ank Th iwa a ail n a Ve Tur nd k n Zi ez ey ue m Co ba la m bw po e sit e A Rethinking Risk Average Skewness in Emerging Markets 1 0.5 0 -0.5 -1 -1.5 -2 Data from IFC 45
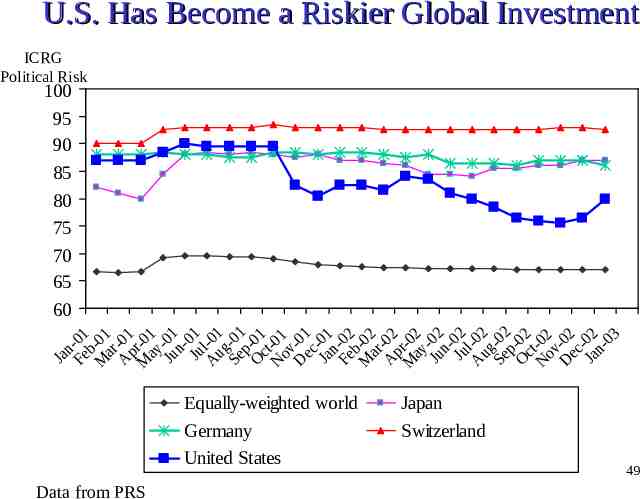
U.S. Has Become a Riskier Global Investment The U.S. has become much more risky – High sensitivity to some GPRs – Disagreement on strength of economy – Financial information less credible These factors suggest shifting exposures from equity to safer fixed income 46
Ja n Fe -01 b M -01 ar A -01 p M r-01 ay Ju - 01 nJu 01 A l-01 ug Se -01 p O -01 c N t-01 ov D -01 ec Ja -01 n Fe -02 b M -02 ar A -02 p M r-02 ay Ju - 02 nJu 02 A l-02 ug Se -02 p O -02 c N t-02 ov D -02 ec Ja -02 n03 U.S. Has Become a Riskier Global Investment ICRG Political Risk 100 95 90 85 80 75 70 65 60 Equally-weighted world Data from PRS G-7xUS Switzerland United States 47
Ja n Fe -01 b M -01 ar A -01 p M r-01 ay Ju - 01 nJu 01 A l-01 ug Se -01 p O -01 c N t-01 ov D -01 ec Ja -01 n Fe -02 b M -02 ar A -02 p M r-02 ay Ju - 02 nJu 02 A l-02 ug Se -02 p O -02 c N t-02 ov D -02 ec Ja -02 n03 U.S. Has Become a Riskier Global Investment ICRG Political Risk 100 95 90 85 80 75 70 65 60 Equally-weighted world Data from PRS Japan Switzerland United States 48
Ja n Fe -01 b M -01 ar A -01 p M r-01 ay Ju - 01 nJu 01 A l-01 ug Se -01 p O -01 c N t-01 ov D -01 ec Ja -01 n Fe -02 b M -02 ar A -02 p M r-02 ay Ju - 02 nJu 02 A l-02 ug Se -02 p O -02 c N t-02 ov D -02 ec Ja -02 n03 U.S. Has Become a Riskier Global Investment ICRG Political Risk 100 95 90 85 80 75 70 65 60 Equally-weighted world Germany United States Data from PRS Japan Switzerland 49
U.S. Has Become a Riskier Global Investment Risk Ratings December 2002 Luxembourg Finland Ireland Switzerland Iceland Sweden Denmark New Zealand Austria Norway 94.5 94.0 92.5 92.5 92.0 91.5 91.0 91.0 90.5 90.0 Netherlands Singapore Portugal Australia Belgium Japan United Kingdom Malta Canada Germany 88.5 88.5 87.5 87.0 87.0 87.0 87.0 86.5 86.0 86.0 Bahamas Spain Hungary France Italy Slovenia Brunei United States Bahrain Poland 84.5 83.0 82.5 81.0 81.0 81.0 80.5 80.0 79.5 79.5 50 Data from PRS
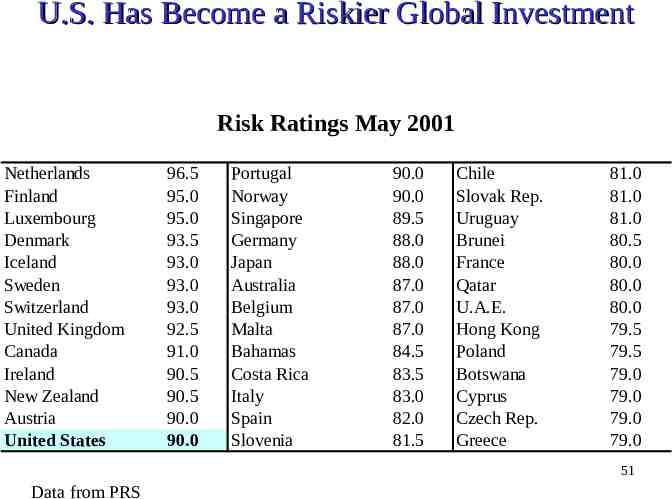
U.S. Has Become a Riskier Global Investment Risk Ratings May 2001 Netherlands Finland Luxembourg Denmark Iceland Sweden Switzerland United Kingdom Canada Ireland New Zealand Austria United States 96.5 95.0 95.0 93.5 93.0 93.0 93.0 92.5 91.0 90.5 90.5 90.0 90.0 Portugal Norway Singapore Germany Japan Australia Belgium Malta Bahamas Costa Rica Italy Spain Slovenia 90.0 90.0 89.5 88.0 88.0 87.0 87.0 87.0 84.5 83.5 83.0 82.0 81.5 Chile Slovak Rep. Uruguay Brunei France Qatar U.A.E. Hong Kong Poland Botswana Cyprus Czech Rep. Greece 81.0 81.0 81.0 80.5 80.0 80.0 80.0 79.5 79.5 79.0 79.0 79.0 79.0 51 Data from PRS
U.S. Has Become a Riskier Global Investment Higher risk means equity investors require a higher rate of return 50% Average returns 40% 2 30% R 0.2976 20% 10% 0% -10% 0 10 20 30 40 50 60 70 80 90 100 II Rating 52 Risk Ratings from Institutional Investor
U.S. Has Become a Riskier Global Investment Equation implies an increase in the medium-term risk premium of 240bp – This helps explain the recent decline in the equity market – This helps explain the recent behavior of the U.S. dollar – This helps explain the slow down in real investment (hurdle rates are up) 53
Conclusions International investment is mainly about returns – diversification, while important, is often “oversold” Expected returns depend on fundamental values today – not just historical return performance. U.S. risk has increased suggesting a reallocation from equity to fixed income 54
Readings All articles on www.duke.edu/ charvey – The Drivers of Expected Returns in International Markets (2000) – Global Tactical Asset Allocation (2001) with Magnus Dahlquist – The Term Structure of Equity Risk Premia (2002) with Claude Erb 55