Prevalence of Self-Reported Obesity Among U.S. Adults by State and
23 Slides6.38 MB
Prevalence of Self-Reported Obesity Among U.S. Adults by State and Territory Definitions Obesity: Body Mass Index (BMI) of 30 kg/m2 or higher. Body Mass Index (BMI): A measure of an adult’s weight in relation to his or her height, calculated by using the adult’s weight in kilograms divided by the square of his or her height in meters.
Prevalence of Self-Reported Obesity Among U.S. Adults by State and Territory Source of the Data The data were collected through the Behavioral Risk Factor Surveillance System (BRFSS), an ongoing, state-based, telephone interview survey conducted by state health departments with assistance from CDC. Height and weight data used in the BMI calculations were self-reported.
Prevalence of Self-Reported Obesity Among U.S. Adults by State and Territory BRFSS Methodological Changes Started in 2011 New sampling frame that included both landline and cell phone households. New weighting methodology used to provide a closer match between the sample and the population.
Prevalence of Self-Reported Obesity Among U.S. Adults by State and Territory Exclusion Criteria Used Beginning with 2011 BRFSS Data Records with the following were excluded: Height: 3 feet or 8 feet Weight: 50 pounds or 650 pounds BMI: 12 kg/m2 or 100 kg/m2 Pregnant women
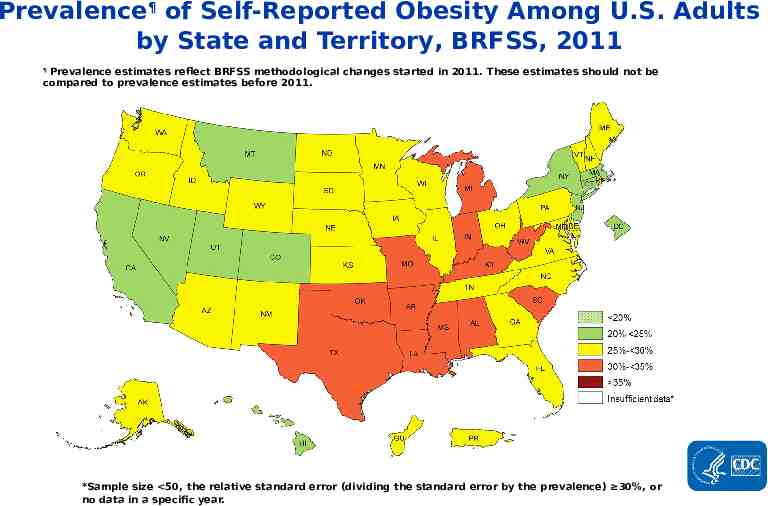
Prevalence¶ of Self-Reported Obesity Among U.S. Adults by State and Territory, BRFSS, 2011 Prevalence estimates reflect BRFSS methodological changes started in 2011. These estimates should not be compared to prevalence estimates before 2011. ¶ *Sample size 50, the relative standard error (dividing the standard error by the prevalence) 30%, or no data in a specific year.
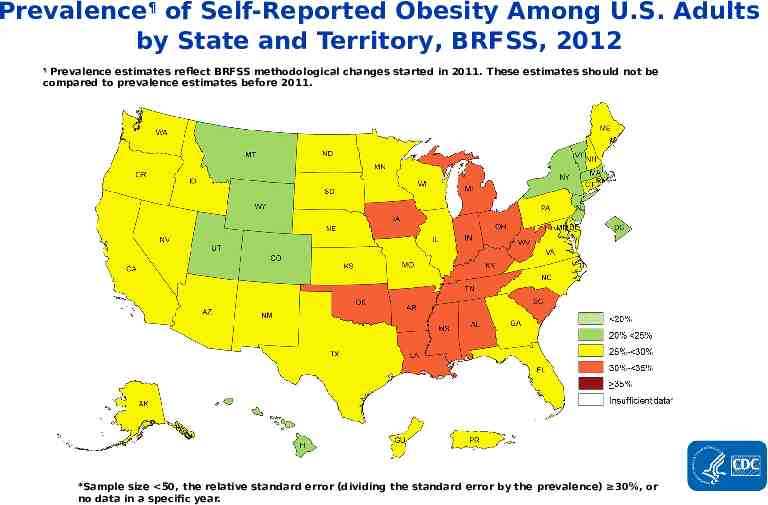
Prevalence¶ of Self-Reported Obesity Among U.S. Adults by State and Territory, BRFSS, 2012 Prevalence estimates reflect BRFSS methodological changes started in 2011. These estimates should not be compared to prevalence estimates before 2011. ¶ *Sample size 50, the relative standard error (dividing the standard error by the prevalence) 30%, or no data in a specific year.
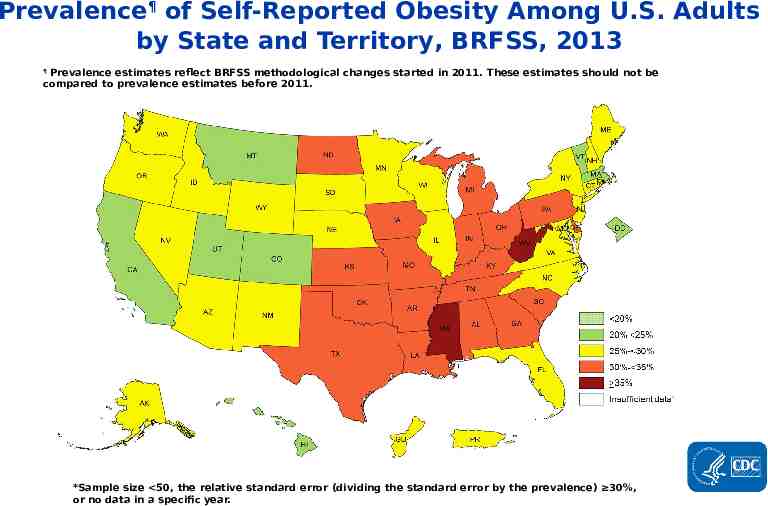
Prevalence¶ of Self-Reported Obesity Among U.S. Adults by State and Territory, BRFSS, 2013 Prevalence estimates reflect BRFSS methodological changes started in 2011. These estimates should not be compared to prevalence estimates before 2011. ¶ *Sample size 50, the relative standard error (dividing the standard error by the prevalence) 30%, or no data in a specific year.
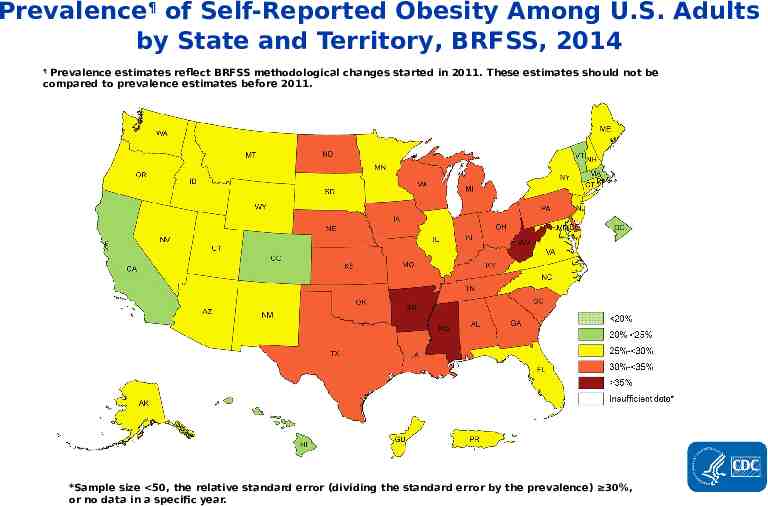
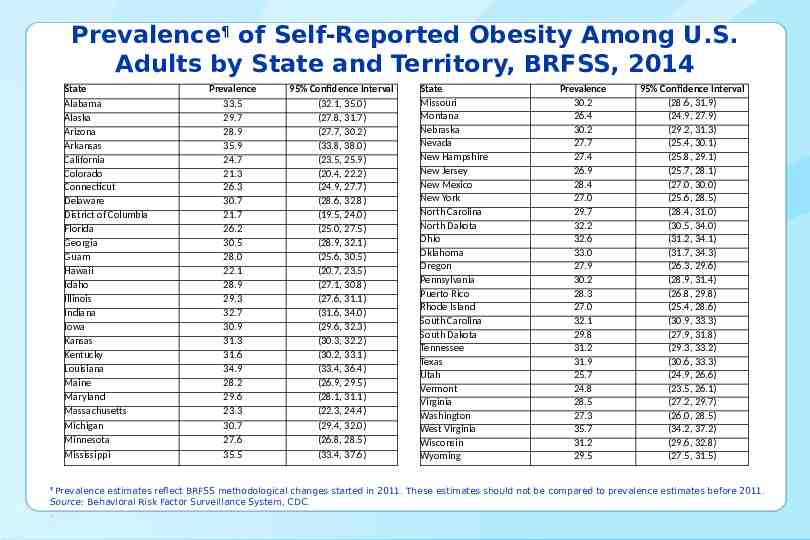
Prevalence¶ of Self-Reported Obesity Among U.S. Adults by State and Territory, BRFSS, 2014 Prevalence estimates reflect BRFSS methodological changes started in 2011. These estimates should not be compared to prevalence estimates before 2011. ¶ *Sample size 50, the relative standard error (dividing the standard error by the prevalence) 30%, or no data in a specific year.
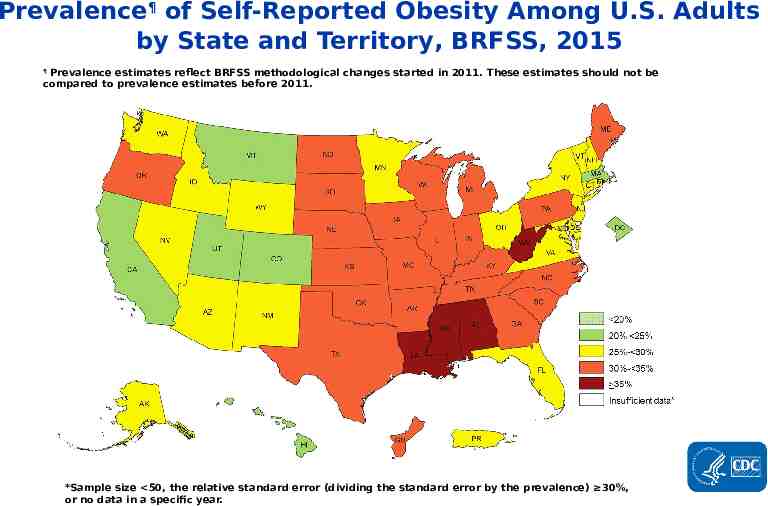
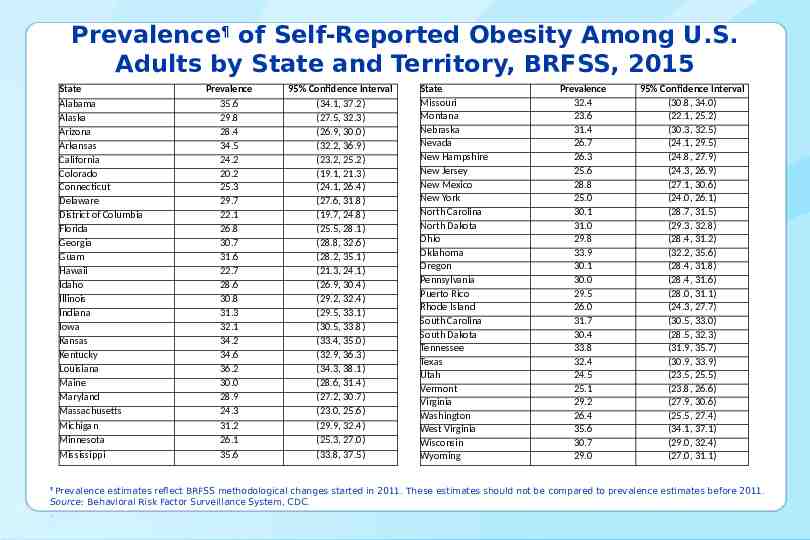
Prevalence¶ of Self-Reported Obesity Among U.S. Adults by State and Territory, BRFSS, 2015 Prevalence estimates reflect BRFSS methodological changes started in 2011. These estimates should not be compared to prevalence estimates before 2011. ¶ *Sample size 50, the relative standard error (dividing the standard error by the prevalence) 30%, or no data in a specific year.
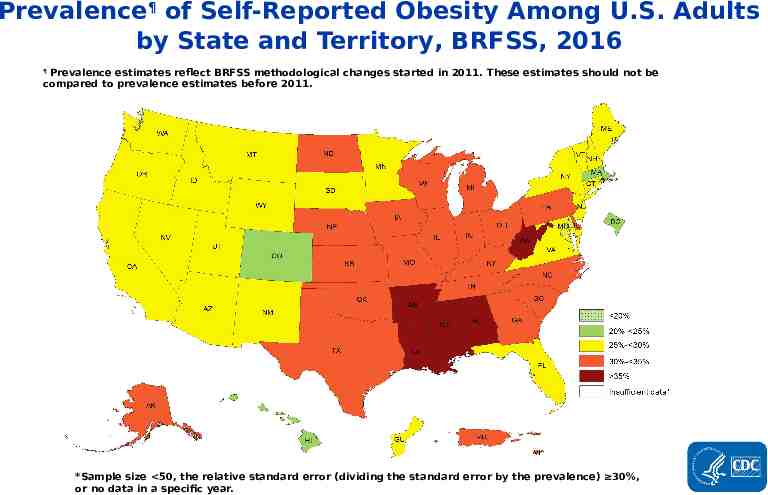
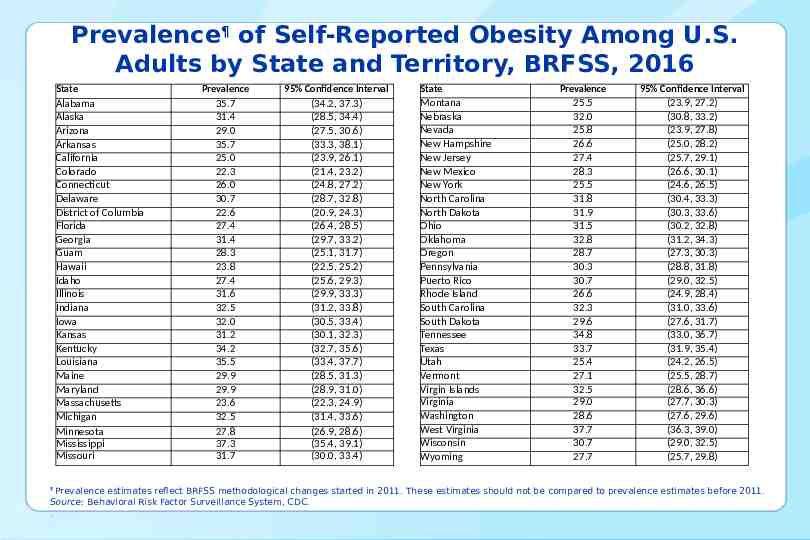
Prevalence¶ of Self-Reported Obesity Among U.S. Adults by State and Territory, BRFSS, 2016 Prevalence estimates reflect BRFSS methodological changes started in 2011. These estimates should not be compared to prevalence estimates before 2011. ¶ *Sample size 50, the relative standard error (dividing the standard error by the prevalence) 30%, or no data in a specific year.
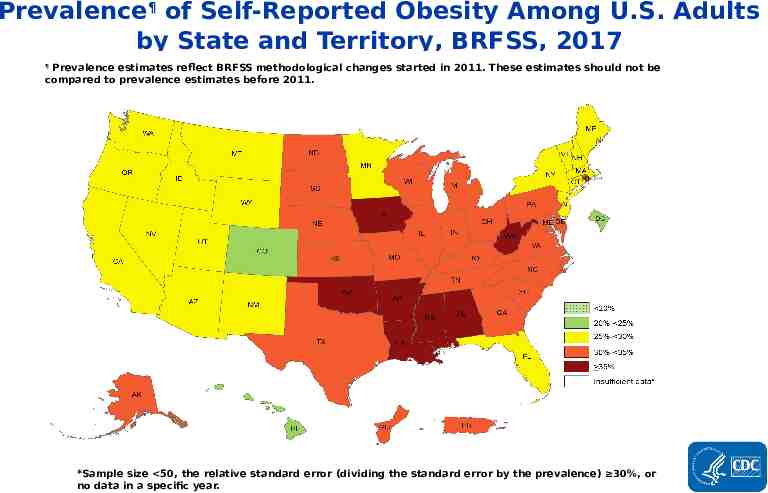
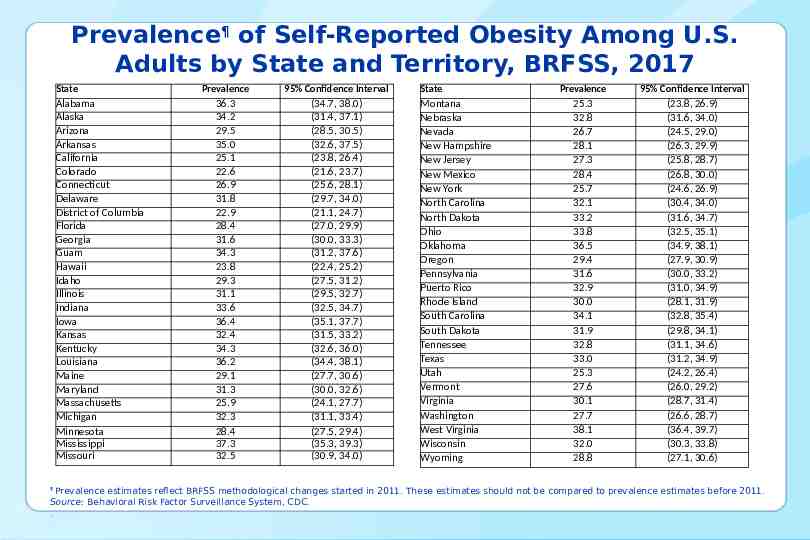
Prevalence¶ of Self-Reported Obesity Among U.S. Adults by State and Territory, BRFSS, 2017 Prevalence estimates reflect BRFSS methodological changes started in 2011. These estimates should not be compared to prevalence estimates before 2011. ¶ *Sample size 50, the relative standard error (dividing the standard error by the prevalence) 30%, or no data in a specific year.
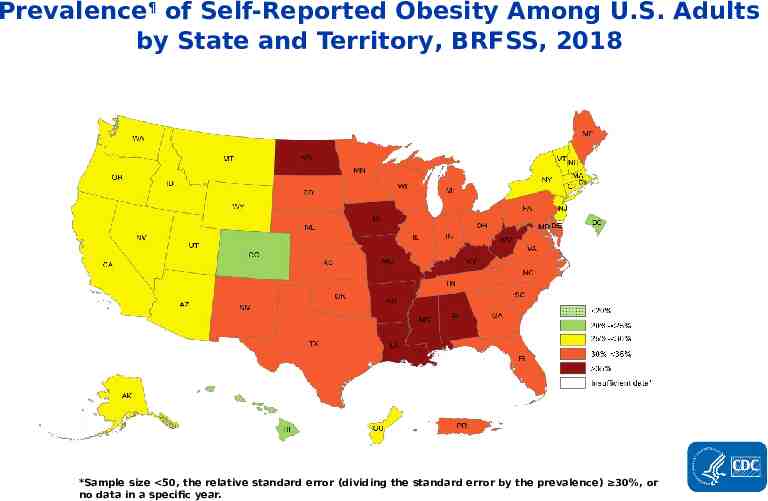
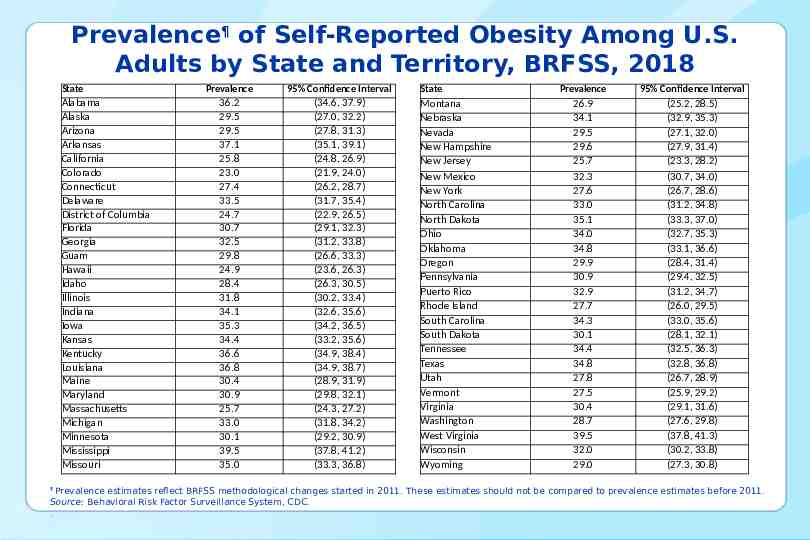
Prevalence¶ of Self-Reported Obesity Among U.S. Adults by State and Territory, BRFSS, 2018 Prevalence estimates reflect BRFSS methodological changes started in 2011. These estimates should not be compared to prevalence estimates before 2011. ¶ *Sample size 50, the relative standard error (dividing the standard error by the prevalence) 30%, or no data in a specific year.
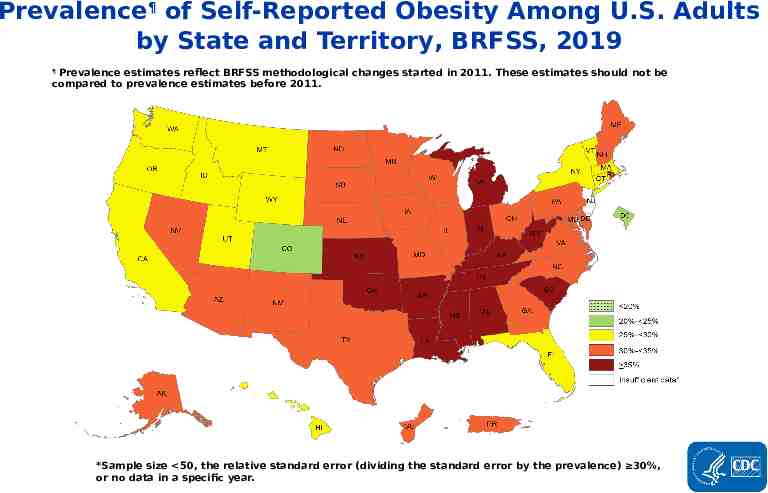
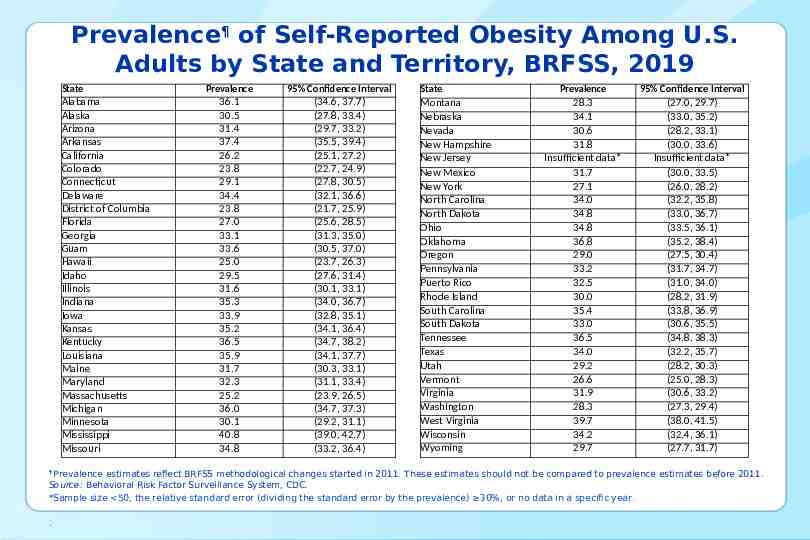
Prevalence¶ of Self-Reported Obesity Among U.S. Adults by State and Territory, BRFSS, 2019 Prevalence estimates reflect BRFSS methodological changes started in 2011. These estimates should not be compared to prevalence estimates before 2011. ¶ *Sample size 50, the relative standard error (dividing the standard error by the prevalence) 30%, or no data in a specific year.
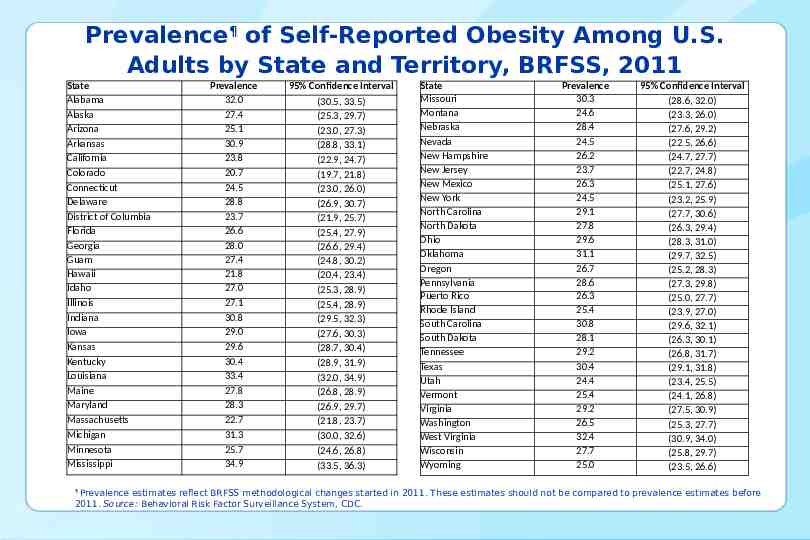
Prevalence¶ of Self-Reported Obesity Among U.S. Adults by State and Territory, BRFSS, 2011 State Alabama Alaska Arizona Arkansas California Colorado Connecticut Delaware District of Columbia Florida Georgia Guam Hawaii Idaho Illinois Indiana Iowa Kansas Kentucky Louisiana Maine Maryland Massachusetts Michigan Minnesota Mississippi Prevalence 32.0 27.4 25.1 30.9 23.8 20.7 24.5 28.8 23.7 26.6 28.0 27.4 21.8 27.0 27.1 30.8 29.0 29.6 30.4 33.4 27.8 28.3 22.7 31.3 25.7 34.9 95% Confidence Interval (30.5, 33.5) (25.3, 29.7) (23.0, 27.3) (28.8, 33.1) (22.9, 24.7) (19.7, 21.8) (23.0, 26.0) (26.9, 30.7) (21.9, 25.7) (25.4, 27.9) (26.6, 29.4) (24.8, 30.2) (20.4, 23.4) (25.3, 28.9) (25.4, 28.9) (29.5, 32.3) (27.6, 30.3) (28.7, 30.4) (28.9, 31.9) (32.0, 34.9) (26.8, 28.9) (26.9, 29.7) (21.8, 23.7) (30.0, 32.6) (24.6, 26.8) (33.5, 36.3) State Missouri Montana Nebraska Nevada New Hampshire New Jersey New Mexico New York North Carolina North Dakota Ohio Oklahoma Oregon Pennsylvania Puerto Rico Rhode Island South Carolina South Dakota Tennessee Texas Utah Vermont Virginia Washington West Virginia Wisconsin Wyoming Prevalence 30.3 24.6 28.4 24.5 26.2 23.7 26.3 24.5 29.1 27.8 29.6 31.1 26.7 28.6 26.3 25.4 30.8 28.1 29.2 30.4 24.4 25.4 29.2 26.5 32.4 27.7 25.0 95% Confidence Interval (28.6, 32.0) (23.3, 26.0) (27.6, 29.2) (22.5, 26.6) (24.7, 27.7) (22.7, 24.8) (25.1, 27.6) (23.2, 25.9) (27.7, 30.6) (26.3, 29.4) (28.3, 31.0) (29.7, 32.5) (25.2, 28.3) (27.3, 29.8) (25.0, 27.7) (23.9, 27.0) (29.6, 32.1) (26.3, 30.1) (26.8, 31.7) (29.1, 31.8) (23.4, 25.5) (24.1, 26.8) (27.5, 30.9) (25.3, 27.7) (30.9, 34.0) (25.8, 29.7) (23.5, 26.6) Prevalence estimates reflect BRFSS methodological changes started in 2011. These estimates should not be compared to prevalence estimates before 2011. Source: Behavioral Risk Factor Surveillance System, CDC. 
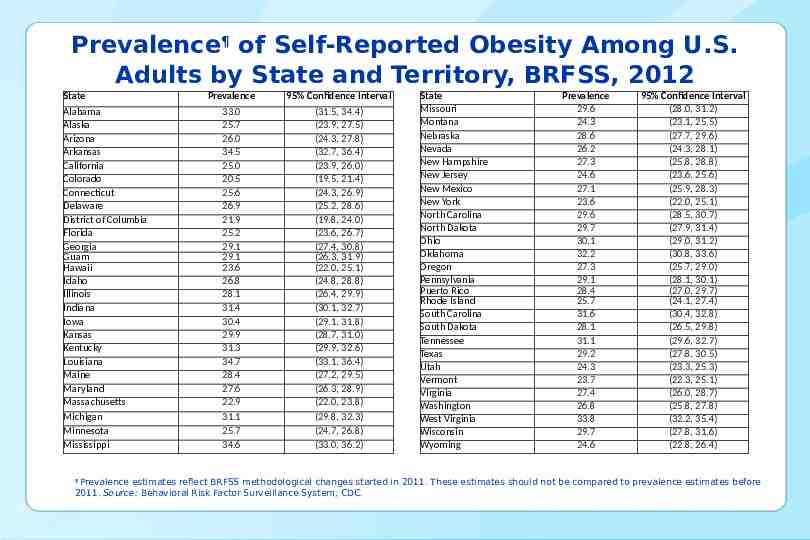
Prevalence¶ of Self-Reported Obesity Among U.S. Adults by State and Territory, BRFSS, 2012 State Alabama Alaska Arizona Arkansas California Colorado Connecticut Delaware District of Columbia Florida Georgia Guam Hawaii Idaho Illinois Indiana Iowa Kansas Kentucky Louisiana Maine Maryland Massachusetts Michigan Minnesota Mississippi Prevalence 33.0 25.7 26.0 34.5 25.0 20.5 25.6 26.9 21.9 25.2 29.1 29.1 23.6 26.8 28.1 31.4 30.4 29.9 31.3 34.7 28.4 27.6 22.9 31.1 25.7 34.6 95% Confidence Interval (31.5, 34.4) (23.9, 27.5) (24.3, 27.8) (32.7, 36.4) (23.9, 26.0) (19.5, 21.4) (24.3, 26.9) (25.2, 28.6) (19.8, 24.0) (23.6, 26.7) (27.4, 30.8) (26.3, 31.9) (22.0, 25.1) (24.8, 28.8) (26.4, 29.9) (30.1, 32.7) (29.1, 31.8) (28.7, 31.0) (29.9, 32.6) (33.1, 36.4) (27.2, 29.5) (26.3, 28.9) (22.0, 23.8) (29.8, 32.3) (24.7, 26.8) (33.0, 36.2) State Missouri Montana Nebraska Nevada New Hampshire New Jersey New Mexico New York North Carolina North Dakota Ohio Oklahoma Oregon Pennsylvania Puerto Rico Rhode Island South Carolina South Dakota Tennessee Texas Utah Vermont Virginia Washington West Virginia Wisconsin Wyoming Prevalence 29.6 24.3 28.6 26.2 27.3 24.6 27.1 23.6 29.6 29.7 30.1 32.2 27.3 29.1 28.4 25.7 31.6 28.1 31.1 29.2 24.3 23.7 27.4 26.8 33.8 29.7 24.6 95% Confidence Interval (28.0, 31.2) (23.1, 25.5) (27.7, 29.6) (24.3, 28.1) (25.8, 28.8) (23.6, 25.6) (25.9, 28.3) (22.0, 25.1) (28.5, 30.7) (27.9, 31.4) (29.0, 31.2) (30.8, 33.6) (25.7, 29.0) (28.1, 30.1) (27.0, 29.7) (24.1, 27.4) (30.4, 32.8) (26.5, 29.8) (29.6, 32.7) (27.8, 30.5) (23.3, 25.3) (22.3, 25.1) (26.0, 28.7) (25.8, 27.8) (32.2, 35.4) (27.8, 31.6) (22.8, 26.4) Prevalence estimates reflect BRFSS methodological changes started in 2011. These estimates should not be compared to prevalence estimates before 2011. Source: Behavioral Risk Factor Surveillance System, CDC. 
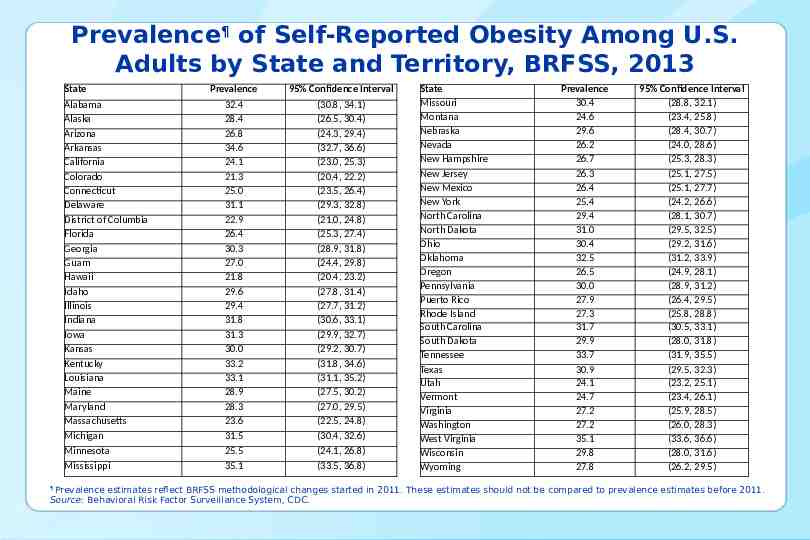
Prevalence¶ of Self-Reported Obesity Among U.S. Adults by State and Territory, BRFSS, 2013 State Alabama Alaska Arizona Arkansas California Colorado Connecticut Delaware District of Columbia Florida Georgia Guam Hawaii Idaho Illinois Indiana Iowa Kansas Kentucky Louisiana Maine Maryland Massachusetts Michigan Minnesota Mississippi Prevalence 95% Confidence Interval 32.4 28.4 26.8 34.6 24.1 21.3 25.0 31.1 22.9 26.4 30.3 27.0 21.8 29.6 29.4 31.8 31.3 30.0 33.2 33.1 28.9 28.3 23.6 31.5 25.5 35.1 (30.8, 34.1) (26.5, 30.4) (24.3, 29.4) (32.7, 36.6) (23.0, 25.3) (20.4, 22.2) (23.5, 26.4) (29.3, 32.8) (21.0, 24.8) (25.3, 27.4) (28.9, 31.8) (24.4, 29.8) (20.4, 23.2) (27.8, 31.4) (27.7, 31.2) (30.6, 33.1) (29.9, 32.7) (29.2, 30.7) (31.8, 34.6) (31.1, 35.2) (27.5, 30.2) (27.0, 29.5) (22.5, 24.8) (30.4, 32.6) (24.1, 26.8) (33.5, 36.8) State Missouri Montana Nebraska Nevada New Hampshire New Jersey New Mexico New York North Carolina North Dakota Ohio Oklahoma Oregon Pennsylvania Puerto Rico Rhode Island South Carolina South Dakota Tennessee Texas Utah Vermont Virginia Washington West Virginia Wisconsin Wyoming Prevalence 30.4 24.6 29.6 26.2 26.7 26.3 26.4 25.4 29.4 31.0 30.4 32.5 26.5 30.0 27.9 27.3 31.7 29.9 33.7 30.9 24.1 24.7 27.2 27.2 35.1 29.8 27.8 95% Confidence Interval (28.8, 32.1) (23.4, 25.8) (28.4, 30.7) (24.0, 28.6) (25.3, 28.3) (25.1, 27.5) (25.1, 27.7) (24.2, 26.6) (28.1, 30.7) (29.5, 32.5) (29.2, 31.6) (31.2, 33.9) (24.9, 28.1) (28.9, 31.2) (26.4, 29.5) (25.8, 28.8) (30.5, 33.1) (28.0, 31.8) (31.9, 35.5) (29.5, 32.3) (23.2, 25.1) (23.4, 26.1) (25.9, 28.5) (26.0, 28.3) (33.6, 36.6) (28.0, 31.6) (26.2, 29.5) Prevalence estimates reflect BRFSS methodological changes started in 2011. These estimates should not be compared to prevalence estimates before 2011. Source: Behavioral Risk Factor Surveillance System, CDC. 
Prevalence¶ of Self-Reported Obesity Among U.S. Adults by State and Territory, BRFSS, 2014 State Alabama Alaska Arizona Arkansas California Colorado Connecticut Delaware District of Columbia Florida Georgia Guam Hawaii Idaho Illinois Indiana Iowa Kansas Kentucky Louisiana Maine Maryland Massachusetts Michigan Minnesota Mississippi Prevalence 33.5 29.7 28.9 35.9 24.7 21.3 26.3 30.7 21.7 26.2 30.5 28.0 22.1 28.9 29.3 32.7 30.9 31.3 31.6 34.9 28.2 29.6 23.3 30.7 27.6 35.5 95% Confidence Interval (32.1, 35.0) (27.8, 31.7) (27.7, 30.2) (33.8, 38.0) (23.5, 25.9) (20.4, 22.2) (24.9, 27.7) (28.6, 32.8) (19.5, 24.0) (25.0, 27.5) (28.9, 32.1) (25.6, 30.5) (20.7, 23.5) (27.1, 30.8) (27.6, 31.1) (31.6, 34.0) (29.6, 32.3) (30.3, 32.2) (30.2, 33.1) (33.4, 36.4) (26.9, 29.5) (28.1, 31.1) (22.3, 24.4) (29.4, 32.0) (26.8, 28.5) (33.4, 37.6) State Missouri Montana Nebraska Nevada New Hampshire New Jersey New Mexico New York North Carolina North Dakota Ohio Oklahoma Oregon Pennsylvania Puerto Rico Rhode Island South Carolina South Dakota Tennessee Texas Utah Vermont Virginia Washington West Virginia Wisconsin Wyoming Prevalence 30.2 26.4 30.2 27.7 27.4 26.9 28.4 27.0 29.7 32.2 32.6 33.0 27.9 30.2 28.3 27.0 32.1 29.8 31.2 31.9 25.7 24.8 28.5 27.3 35.7 31.2 29.5 95% Confidence Interval (28.6, 31.9) (24.9, 27.9) (29.2, 31.3) (25.4, 30.1) (25.8, 29.1) (25.7, 28.1) (27.0, 30.0) (25.6, 28.5) (28.4, 31.0) (30.5, 34.0) (31.2, 34.1) (31.7, 34.3) (26.3, 29.6) (28.9, 31.4) (26.8, 29.8) (25.4, 28.6) (30.9, 33.3) (27.9, 31.8) (29.3, 33.2) (30.6, 33.3) (24.9, 26.6) (23.5, 26.1) (27.2, 29.7) (26.0, 28.5) (34.2, 37.2) (29.6, 32.8) (27.5, 31.5) Prevalence estimates reflect BRFSS methodological changes started in 2011. These estimates should not be compared to prevalence estimates before 2011. Source: Behavioral Risk Factor Surveillance System, CDC. . 
Prevalence¶ of Self-Reported Obesity Among U.S. Adults by State and Territory, BRFSS, 2015 State Alabama Alaska Arizona Arkansas California Colorado Connecticut Delaware District of Columbia Florida Georgia Guam Hawaii Idaho Illinois Indiana Iowa Kansas Kentucky Louisiana Maine Maryland Massachusetts Michigan Minnesota Mississippi Prevalence 35.6 29.8 28.4 34.5 24.2 20.2 25.3 29.7 22.1 26.8 30.7 31.6 22.7 28.6 30.8 31.3 32.1 34.2 34.6 36.2 30.0 28.9 24.3 31.2 26.1 35.6 95% Confidence Interval (34.1, 37.2) (27.5, 32.3) (26.9, 30.0) (32.2, 36.9) (23.2, 25.2) (19.1, 21.3) (24.1, 26.4) (27.6, 31.8) (19.7, 24.8) (25.5, 28.1) (28.8, 32.6) (28.2, 35.1) (21.3, 24.1) (26.9, 30.4) (29.2, 32.4) (29.5, 33.1) (30.5, 33.8) (33.4, 35.0) (32.9, 36.3) (34.3, 38.1) (28.6, 31.4) (27.2, 30.7) (23.0, 25.6) (29.9, 32.4) (25.3, 27.0) (33.8, 37.5) State Missouri Montana Nebraska Nevada New Hampshire New Jersey New Mexico New York North Carolina North Dakota Ohio Oklahoma Oregon Pennsylvania Puerto Rico Rhode Island South Carolina South Dakota Tennessee Texas Utah Vermont Virginia Washington West Virginia Wisconsin Wyoming Prevalence 32.4 23.6 31.4 26.7 26.3 25.6 28.8 25.0 30.1 31.0 29.8 33.9 30.1 30.0 29.5 26.0 31.7 30.4 33.8 32.4 24.5 25.1 29.2 26.4 35.6 30.7 29.0 95% Confidence Interval (30.8, 34.0) (22.1, 25.2) (30.3, 32.5) (24.1, 29.5) (24.8, 27.9) (24.3, 26.9) (27.1, 30.6) (24.0, 26.1) (28.7, 31.5) (29.3, 32.8) (28.4, 31.2) (32.2, 35.6) (28.4, 31.8) (28.4, 31.6) (28.0, 31.1) (24.3, 27.7) (30.5, 33.0) (28.5, 32.3) (31.9, 35.7) (30.9, 33.9) (23.5, 25.5) (23.8, 26.6) (27.9, 30.6) (25.5, 27.4) (34.1, 37.1) (29.0, 32.4) (27.0, 31.1) Prevalence estimates reflect BRFSS methodological changes started in 2011. These estimates should not be compared to prevalence estimates before 2011. Source: Behavioral Risk Factor Surveillance System, CDC. . 
Prevalence¶ of Self-Reported Obesity Among U.S. Adults by State and Territory, BRFSS, 2016 State Alabama Alaska Arizona Arkansas California Colorado Connecticut Delaware District of Columbia Florida Georgia Guam Hawaii Idaho Illinois Indiana Iowa Kansas Kentucky Louisiana Maine Maryland Massachusetts Michigan Minnesota Mississippi Missouri Prevalence 35.7 31.4 29.0 35.7 25.0 22.3 26.0 30.7 22.6 27.4 31.4 28.3 23.8 27.4 31.6 32.5 32.0 31.2 34.2 35.5 29.9 29.9 23.6 32.5 27.8 37.3 31.7 95% Confidence Interval (34.2, 37.3) (28.5, 34.4) (27.5, 30.6) (33.3, 38.1) (23.9, 26.1) (21.4, 23.2) (24.8, 27.2) (28.7, 32.8) (20.9, 24.3) (26.4, 28.5) (29.7, 33.2) (25.1, 31.7) (22.5, 25.2) (25.6, 29.3) (29.9, 33.3) (31.2, 33.8) (30.5, 33.4) (30.1, 32.3) (32.7, 35.6) (33.4, 37.7) (28.5, 31.3) (28.9, 31.0) (22.3, 24.9) (31.4, 33.6) (26.9, 28.6) (35.4, 39.1) (30.0, 33.4) State Montana Nebraska Nevada New Hampshire New Jersey New Mexico New York North Carolina North Dakota Ohio Oklahoma Oregon Pennsylvania Puerto Rico Rhode Island South Carolina South Dakota Tennessee Texas Utah Vermont Virgin Islands Virginia Washington West Virginia Wisconsin Wyoming Prevalence 25.5 32.0 25.8 26.6 27.4 28.3 25.5 31.8 31.9 31.5 32.8 28.7 30.3 30.7 26.6 32.3 29.6 34.8 33.7 25.4 27.1 32.5 29.0 28.6 37.7 30.7 27.7 95% Confidence Interval (23.9, 27.2) (30.8, 33.2) (23.9, 27.8) (25.0, 28.2) (25.7, 29.1) (26.6, 30.1) (24.6, 26.5) (30.4, 33.3) (30.3, 33.6) (30.2, 32.8) (31.2, 34.3) (27.3, 30.3) (28.8, 31.8) (29.0, 32.5) (24.9, 28.4) (31.0, 33.6) (27.6, 31.7) (33.0, 36.7) (31.9, 35.4) (24.2, 26.5) (25.5, 28.7) (28.6, 36.6) (27.7, 30.3) (27.6, 29.6) (36.3, 39.0) (29.0, 32.5) (25.7, 29.8) Prevalence estimates reflect BRFSS methodological changes started in 2011. These estimates should not be compared to prevalence estimates before 2011. Source: Behavioral Risk Factor Surveillance System, CDC. . 
Prevalence¶ of Self-Reported Obesity Among U.S. Adults by State and Territory, BRFSS, 2017 State Alabama Alaska Arizona Arkansas California Colorado Connecticut Delaware District of Columbia Florida Georgia Guam Hawaii Idaho Illinois Indiana Iowa Kansas Kentucky Louisiana Maine Maryland Massachusetts Michigan Minnesota Mississippi Missouri Prevalence 36.3 34.2 29.5 35.0 25.1 22.6 26.9 31.8 22.9 28.4 31.6 34.3 23.8 29.3 31.1 33.6 36.4 32.4 34.3 36.2 29.1 31.3 25.9 32.3 28.4 37.3 32.5 95% Confidence Interval (34.7, 38.0) (31.4, 37.1) (28.5, 30.5) (32.6, 37.5) (23.8, 26.4) (21.6, 23.7) (25.6, 28.1) (29.7, 34.0) (21.1, 24.7) (27.0, 29.9) (30.0, 33.3) (31.2, 37.6) (22.4, 25.2) (27.5, 31.2) (29.5, 32.7) (32.5, 34.7) (35.1, 37.7) (31.5, 33.2) (32.6, 36.0) (34.4, 38.1) (27.7, 30.6) (30.0, 32.6) (24.1, 27.7) (31.1, 33.4) (27.5, 29.4) (35.3, 39.3) (30.9, 34.0) State Montana Nebraska Nevada New Hampshire New Jersey New Mexico New York North Carolina North Dakota Ohio Oklahoma Oregon Pennsylvania Puerto Rico Rhode Island South Carolina South Dakota Tennessee Texas Utah Vermont Virginia Washington West Virginia Wisconsin Wyoming Prevalence 25.3 32.8 26.7 28.1 27.3 28.4 25.7 32.1 33.2 33.8 36.5 29.4 31.6 32.9 30.0 34.1 31.9 32.8 33.0 25.3 27.6 30.1 27.7 38.1 32.0 28.8 95% Confidence Interval (23.8, 26.9) (31.6, 34.0) (24.5, 29.0) (26.3, 29.9) (25.8, 28.7) (26.8, 30.0) (24.6, 26.9) (30.4, 34.0) (31.6, 34.7) (32.5, 35.1) (34.9, 38.1) (27.9, 30.9) (30.0, 33.2) (31.0, 34.9) (28.1, 31.9) (32.8, 35.4) (29.8, 34.1) (31.1, 34.6) (31.2, 34.9) (24.2, 26.4) (26.0, 29.2) (28.7, 31.4) (26.6, 28.7) (36.4, 39.7) (30.3, 33.8) (27.1, 30.6) Prevalence estimates reflect BRFSS methodological changes started in 2011. These estimates should not be compared to prevalence estimates before 2011. Source: Behavioral Risk Factor Surveillance System, CDC. . 
Prevalence¶ of Self-Reported Obesity Among U.S. Adults by State and Territory, BRFSS, 2018 State Alabama Alaska Arizona Arkansas California Colorado Connecticut Delaware District of Columbia Florida Georgia Guam Hawaii Idaho Illinois Indiana Iowa Kansas Kentucky Louisiana Maine Maryland Massachusetts Michigan Minnesota Mississippi Missouri Prevalence 36.2 29.5 29.5 37.1 25.8 23.0 27.4 33.5 24.7 30.7 32.5 29.8 24.9 28.4 31.8 34.1 35.3 34.4 36.6 36.8 30.4 30.9 25.7 33.0 30.1 39.5 35.0 95% Confidence Interval (34.6, 37.9) (27.0, 32.2) (27.8, 31.3) (35.1, 39.1) (24.8, 26.9) (21.9, 24.0) (26.2, 28.7) (31.7, 35.4) (22.9, 26.5) (29.1, 32.3) (31.2, 33.8) (26.6, 33.3) (23.6, 26.3) (26.3, 30.5) (30.2, 33.4) (32.6, 35.6) (34.2, 36.5) (33.2, 35.6) (34.9, 38.4) (34.9, 38.7) (28.9, 31.9) (29.8, 32.1) (24.3, 27.2) (31.8, 34.2) (29.2, 30.9) (37.8, 41.2) (33.3, 36.8) State Montana Nebraska Nevada New Hampshire New Jersey New Mexico New York North Carolina North Dakota Ohio Oklahoma Oregon Pennsylvania Puerto Rico Rhode Island South Carolina South Dakota Tennessee Texas Utah Vermont Virginia Washington West Virginia Wisconsin Wyoming Prevalence 26.9 34.1 29.5 29.6 25.7 32.3 27.6 33.0 35.1 34.0 34.8 29.9 30.9 32.9 27.7 34.3 30.1 34.4 34.8 27.8 27.5 30.4 28.7 39.5 32.0 29.0 95% Confidence Interval (25.2, 28.5) (32.9, 35.3) (27.1, 32.0) (27.9, 31.4) (23.3, 28.2) (30.7, 34.0) (26.7, 28.6) (31.2, 34.8) (33.3, 37.0) (32.7, 35.3) (33.1, 36.6) (28.4, 31.4) (29.4, 32.5) (31.2, 34.7) (26.0, 29.5) (33.0, 35.6) (28.1, 32.1) (32.5, 36.3) (32.8, 36.8) (26.7, 28.9) (25.9, 29.2) (29.1, 31.6) (27.6, 29.8) (37.8, 41.3) (30.2, 33.8) (27.3, 30.8) Prevalence estimates reflect BRFSS methodological changes started in 2011. These estimates should not be compared to prevalence estimates before 2011. Source: Behavioral Risk Factor Surveillance System, CDC. . 
Prevalence¶ of Self-Reported Obesity Among U.S. Adults by State and Territory, BRFSS, 2019 State Alabama Alaska Arizona Arkansas California Colorado Connecticut Delaware District of Columbia Florida Georgia Guam Hawaii Idaho Illinois Indiana Iowa Kansas Kentucky Louisiana Maine Maryland Massachusetts Michigan Minnesota Mississippi Missouri Prevalence 36.1 30.5 31.4 37.4 26.2 23.8 29.1 34.4 23.8 27.0 33.1 33.6 25.0 29.5 31.6 35.3 33.9 35.2 36.5 35.9 31.7 32.3 25.2 36.0 30.1 40.8 34.8 95% Confidence Interval (34.6, 37.7) (27.8, 33.4) (29.7, 33.2) (35.5, 39.4) (25.1, 27.2) (22.7, 24.9) (27.8, 30.5) (32.1, 36.6) (21.7, 25.9) (25.6, 28.5) (31.3, 35.0) (30.5, 37.0) (23.7, 26.3) (27.6, 31.4) (30.1, 33.1) (34.0, 36.7) (32.8, 35.1) (34.1, 36.4) (34.7, 38.2) (34.1, 37.7) (30.3, 33.1) (31.1, 33.4) (23.9, 26.5) (34.7, 37.3) (29.2, 31.1) (39.0, 42.7) (33.2, 36.4) State Montana Nebraska Nevada New Hampshire New Jersey New Mexico New York North Carolina North Dakota Ohio Oklahoma Oregon Pennsylvania Puerto Rico Rhode Island South Carolina South Dakota Tennessee Texas Utah Vermont Virginia Washington West Virginia Wisconsin Wyoming Prevalence 28.3 34.1 30.6 31.8 Insufficient data* 31.7 27.1 34.0 34.8 34.8 36.8 29.0 33.2 32.5 30.0 35.4 33.0 36.5 34.0 29.2 26.6 31.9 28.3 39.7 34.2 29.7 95% Confidence Interval (27.0, 29.7) (33.0, 35.2) (28.2, 33.1) (30.0, 33.6) Insufficient data* (30.0, 33.5) (26.0, 28.2) (32.2, 35.8) (33.0, 36.7) (33.5, 36.1) (35.2, 38.4) (27.5, 30.4) (31.7, 34.7) (31.0, 34.0) (28.2, 31.9) (33.8, 36.9) (30.6, 35.5) (34.8, 38.3) (32.2, 35.7) (28.2, 30.3) (25.0, 28.3) (30.6, 33.2) (27.3, 29.4) (38.0, 41.5) (32.4, 36.1) (27.7, 31.7) Prevalence estimates reflect BRFSS methodological changes started in 2011. These estimates should not be compared to prevalence estimates before 2011. Source: Behavioral Risk Factor Surveillance System, CDC. *Sample size 50, the relative standard error (dividing the standard error by the prevalence) 30%, or no data in a specific year. ¶ .
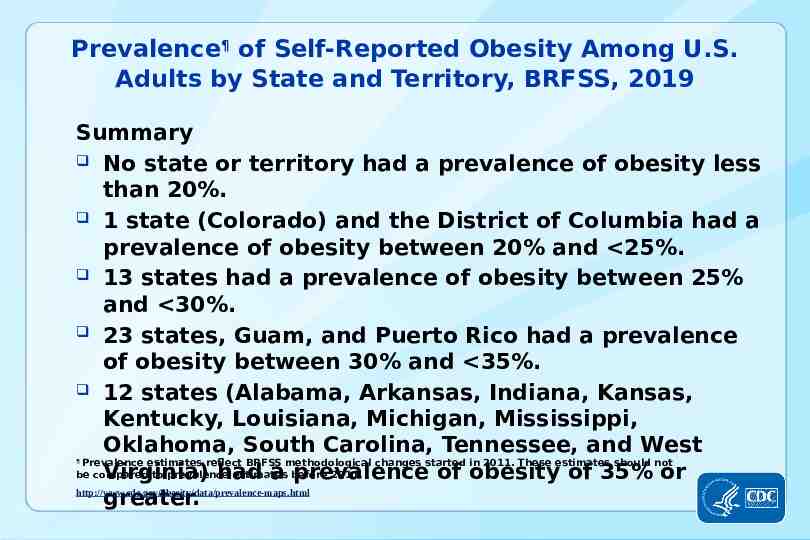
Prevalence¶ of Self-Reported Obesity Among U.S. Adults by State and Territory, BRFSS, 2019 Summary No state or territory had a prevalence of obesity less than 20%. 1 state (Colorado) and the District of Columbia had a prevalence of obesity between 20% and 25%. 13 states had a prevalence of obesity between 25% and 30%. 23 states, Guam, and Puerto Rico had a prevalence of obesity between 30% and 35%. 12 states (Alabama, Arkansas, Indiana, Kansas, Kentucky, Louisiana, Michigan, Mississippi, Oklahoma, South Carolina, Tennessee, and West Prevalence estimates reflect BRFSS methodological changes started in 2011. These estimates should not be compared to prevalence estimates 2011. Virginia) had a before prevalence of obesity of 35% or http://www.cdc.gov/obesity/data/prevalence-maps.html greater. 