Reports and Dashboards Updated 20/01/2023


8 Slides862.20 KB
Reports and Dashboards Updated 20/01/2023
Data you recorded on eSafe can be presented as a report or a dashboard. A report is a list of records that meet the criteria you define. It is displayed in rows and columns, and can be filtered, grouped or displayed in a graphical chart. You can use reports to analyse your data. Example: A dashboard provides a visual snapshot of key metrics or performance indicators. Dashboard presents data for a point in time. Use Refresh button to make sure you see real time data. Dashboard is a good tool for monitoring. Example:
Each dashboard component presents data from an underlying report.
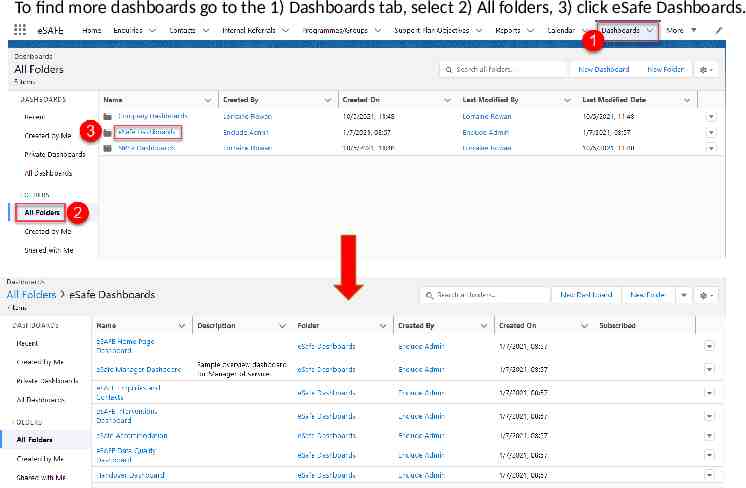
To find more dashboards go to the 1) Dashboards tab, select 2) All folders, 3) click eSafe Dashboards.
You can find eSafe reports by going to 1) Reports tab, clicking 2) All reports and selecting a folder from the list. ectin
For your annual reporting we recommend using “eSAFE Reports – Safe Ireland” folder and related Safe Ireland Last Year/Current Year dashboards introduced in release 1.31.
eSafe provides data that is needed for TUSLA weekly reporting. To find these reports go to All Folders, find eSafe TUSLA reports and then TUSLA weekly reports.
E.g. for these TUSLA questions you will find data in the following reports: