PMI Knowledge Areas Project Quality Management
30 Slides1.78 MB
PMI Knowledge Areas Project Quality Management
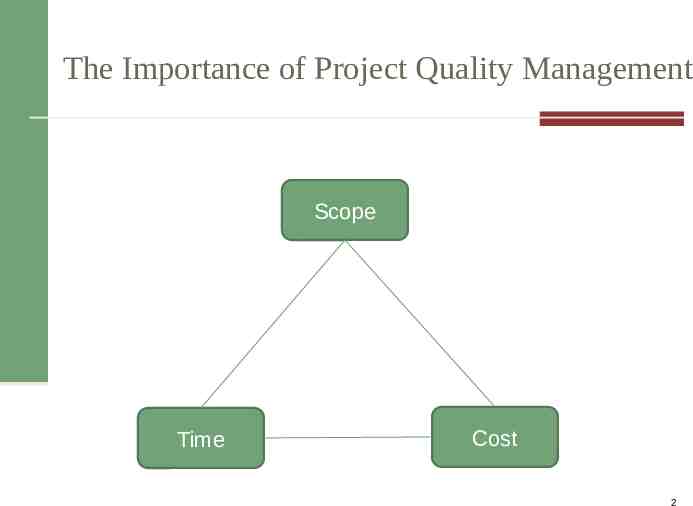
The Importance of Project Quality Management Scope Time Cost 2
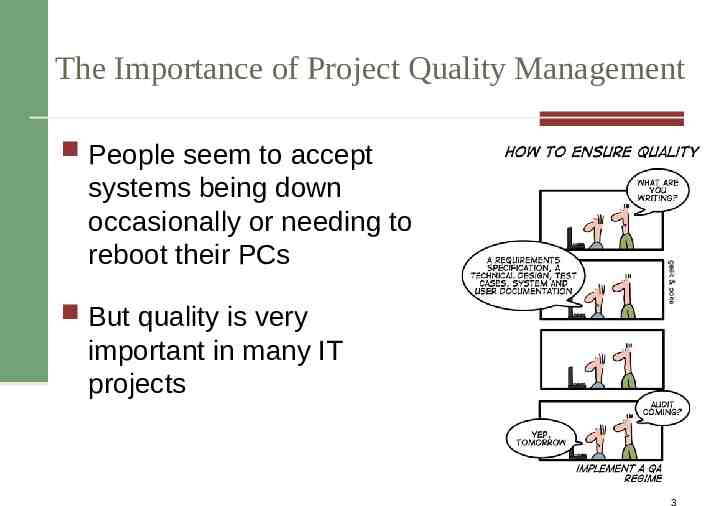
The Importance of Project Quality Management People seem to accept systems being down occasionally or needing to reboot their PCs But quality is very important in many IT projects 3
What Is Project Quality? The International Organization for Standardization (ISO) defines quality as “the degree to which a set of inherent characteristics fulfils requirements” (ISO9000:2000) Who ultimately decides if quality is acceptable? 4
The Cost of Quality The cost of quality is the cost of conformance plus the cost of nonconformance Conformance Cost of nonconformance Cost Categories Related to Quality Prevention cost Appraisal cost Internal failure cost External failure cost Measurement and test equipment costs 5
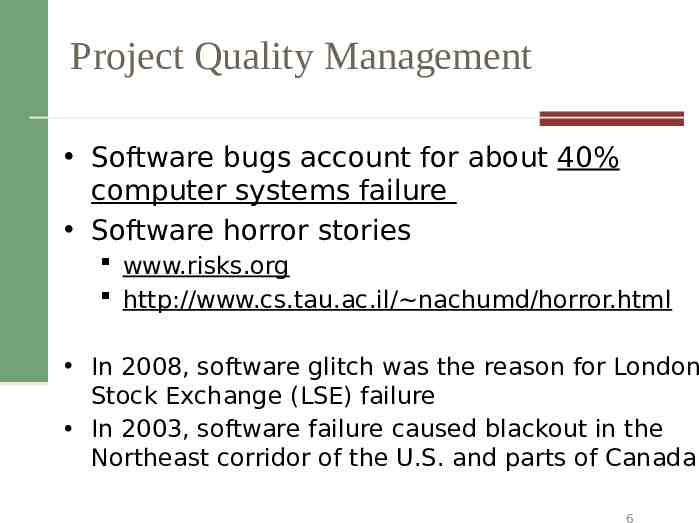
Project Quality Management Software bugs account for about 40% computer systems failure Software horror stories www.risks.org http://www.cs.tau.ac.il/ nachumd/horror.html In 2008, software glitch was the reason for London Stock Exchange (LSE) failure In 2003, software failure caused blackout in the Northeast corridor of the U.S. and parts of Canada 6
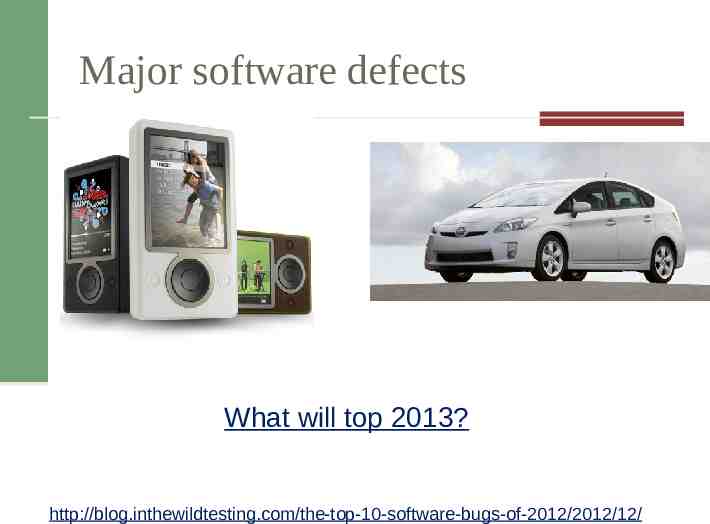
Major software defects What will top 2013? http://blog.inthewildtesting.com/the-top-10-software-bugs-of-2012/2012/12/
What Is Project Quality Management? Project quality management ensures that the project will satisfy the needs for which it was undertaken Processes include: 1) Planning quality management (Planning) 2) Performing quality assurance (Executing) 3) Performing quality control (Control/Monitor) 8
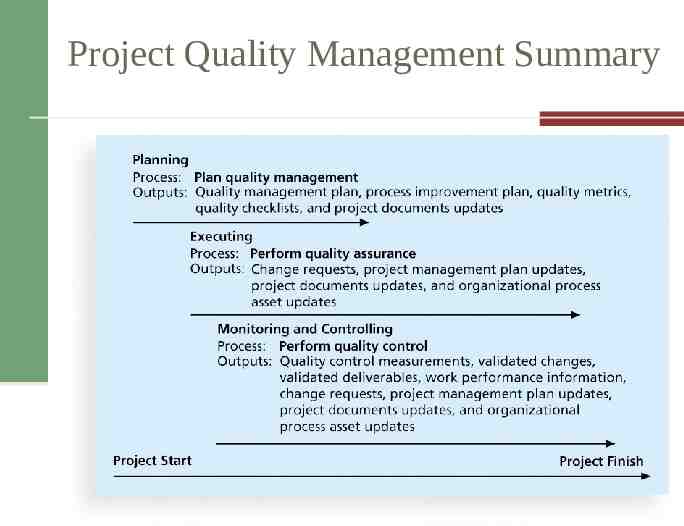
Project Quality Management Summary Information Technology Project Management, Seventh Edition 9
1) Planning Quality Implies the ability to anticipate situations and prepare actions to bring about the desired outcome Important to prevent defects by: Selecting proper materials Training and indoctrinating people in quality Planning a process that ensures the appropriate outcome 10
Quality and IT Projects Customers have difficulty explaining exactly what they want in an IT project. What are the important scope aspects of IT projects that impact quality? 11
Who’s Responsible for the Quality of Projects? Project managers are ultimately responsible for quality management on their projects Several organizations and references can help project managers and their teams understand quality International Organization for Standardization (www.iso.org) IEEE (www.ieee.org) 12
2) Performing Quality Assurance Quality assurance includes all the activities related to satisfying the relevant quality standards for a project Another goal of quality assurance is continuous quality improvement Performing Quality Assurance through: Benchmarking Quality audits 13
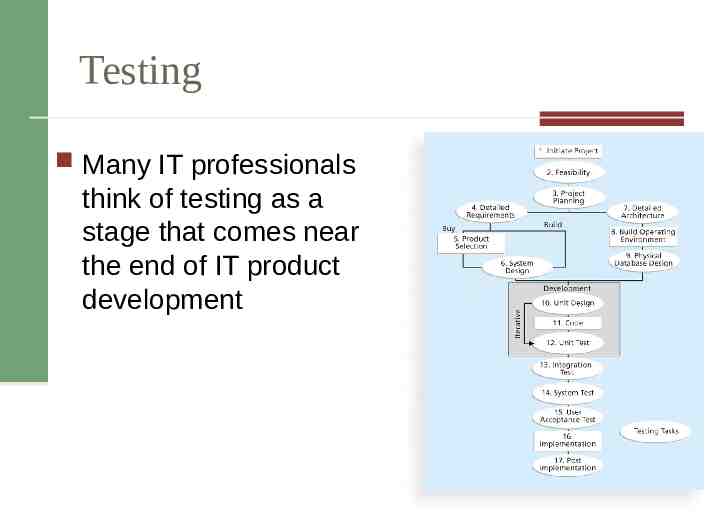
Testing Many IT professionals think of testing as a stage that comes near the end of IT product development 14
Types of Tests Unit testing Integration testing System testing User acceptance testing Information Technology Project Management, Seventh Edition 15
Testing Alone Is Not Enough Watts S. Humphrey, a renowned expert on software quality, defines a software defect as anything that must be changed before delivery of the program Testing does not sufficiently prevent software defects because Why?
Program inspections These are peer reviews where engineers examine the source of a system with the aim of discovering anomalies and defects. Inspections do not require execution of a system so may be used before implementation. 17
Inspection checklists Checklist of common errors should be used to drive the inspection. Examples: Initialisation, Constant naming, loop termination, array bounds, etc. 18
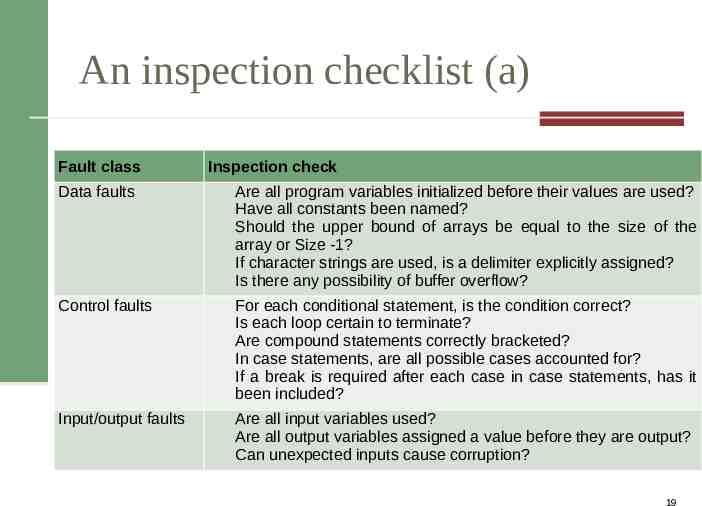
An inspection checklist (a) Fault class Data faults Control faults Input/output faults Inspection check Are all program variables initialized before their values are used? Have all constants been named? Should the upper bound of arrays be equal to the size of the array or Size -1? If character strings are used, is a delimiter explicitly assigned? Is there any possibility of buffer overflow? For each conditional statement, is the condition correct? Is each loop certain to terminate? Are compound statements correctly bracketed? In case statements, are all possible cases accounted for? If a break is required after each case in case statements, has it been included? Are all input variables used? Are all output variables assigned a value before they are output? Can unexpected inputs cause corruption? 19
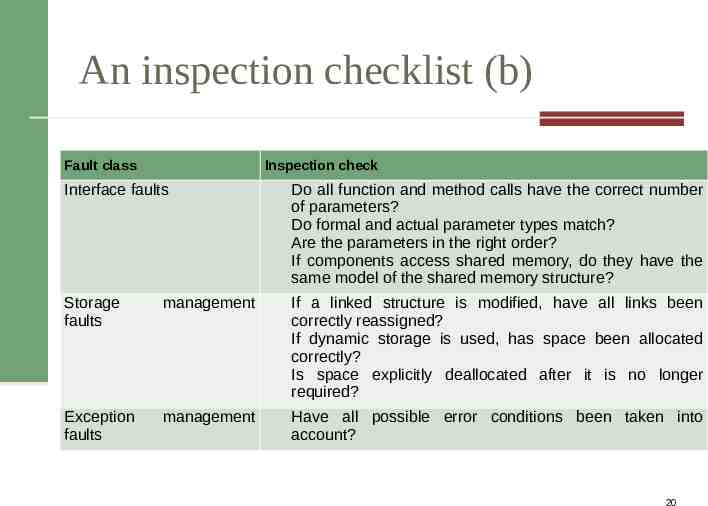
An inspection checklist (b) Fault class Inspection check Interface faults Storage faults Exception faults Do all function and method calls have the correct number of parameters? Do formal and actual parameter types match? Are the parameters in the right order? If components access shared memory, do they have the same model of the shared memory structure? management If a linked structure is modified, have all links been correctly reassigned? If dynamic storage is used, has space been allocated correctly? Is space explicitly deallocated after it is no longer required? management Have all possible error conditions been taken into account? 20
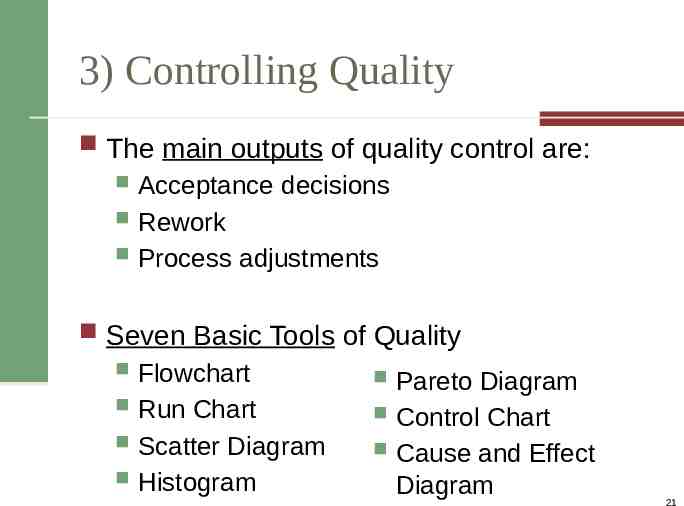
3) Controlling Quality The main outputs of quality control are: Acceptance decisions Rework Process adjustments Seven Basic Tools of Quality Flowchart Pareto Diagram Run Chart Control Chart Scatter Diagram Cause and Effect Histogram Diagram 21
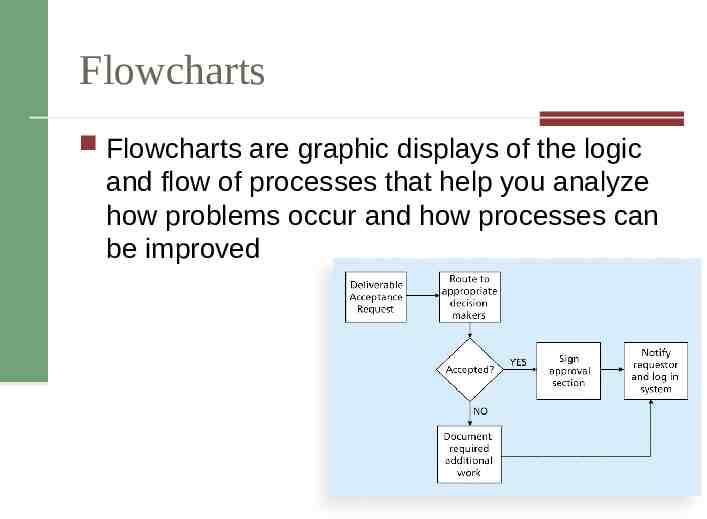
Flowcharts Flowcharts are graphic displays of the logic and flow of processes that help you analyze how problems occur and how processes can be improved 22
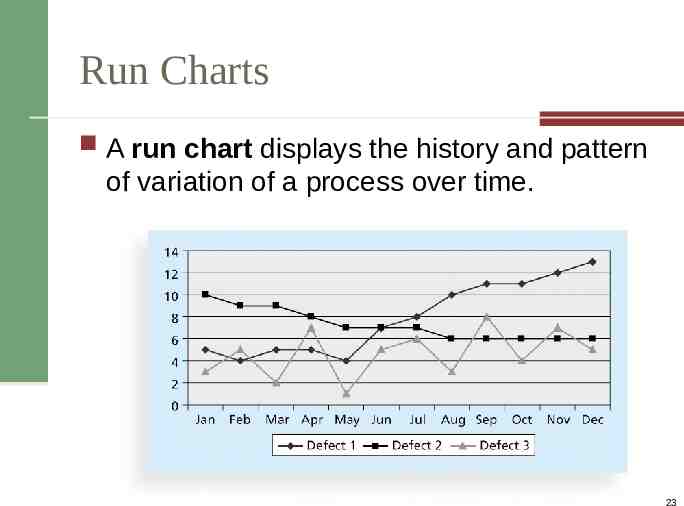
Run Charts A run chart displays the history and pattern of variation of a process over time. 23
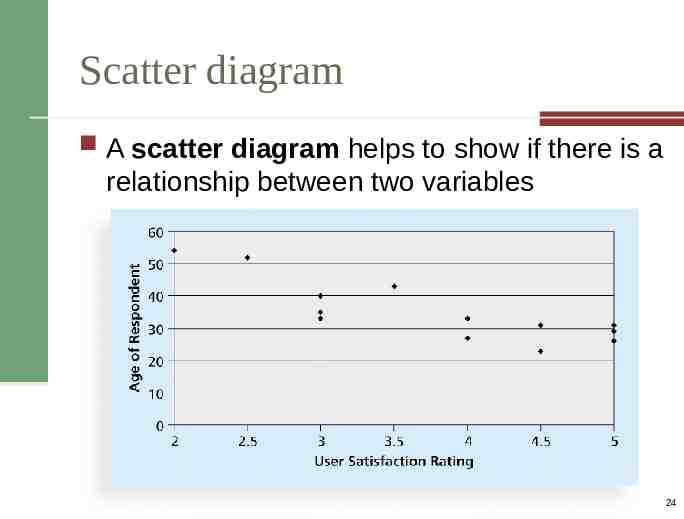
Scatter diagram A scatter diagram helps to show if there is a relationship between two variables 24
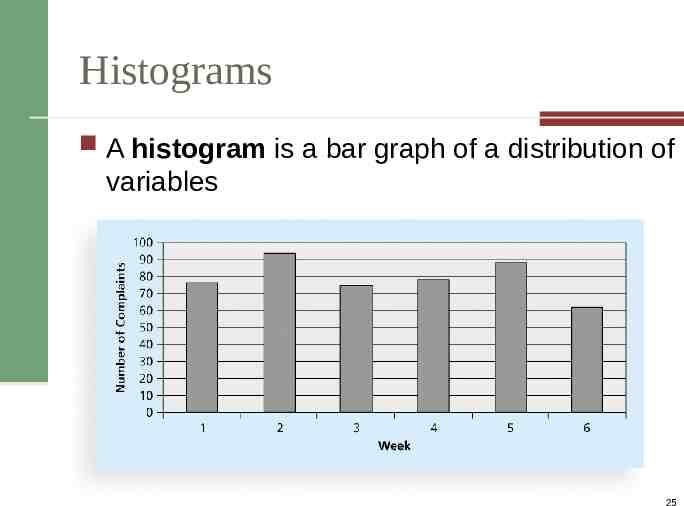
Histograms A histogram is a bar graph of a distribution of variables 25
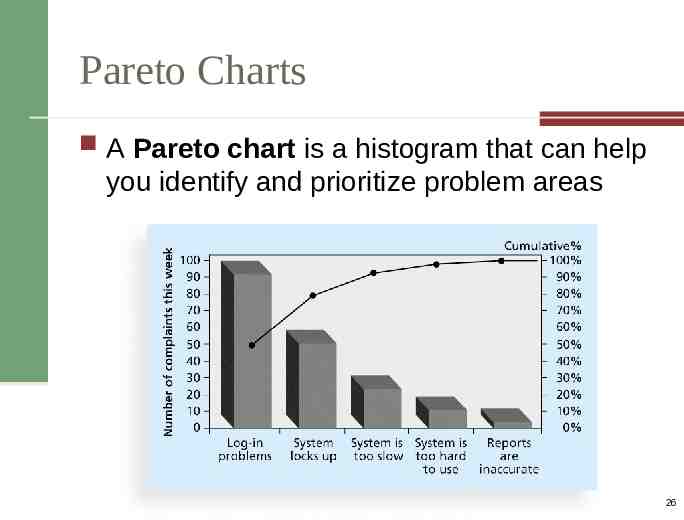
Pareto Charts A Pareto chart is a histogram that can help you identify and prioritize problem areas 26
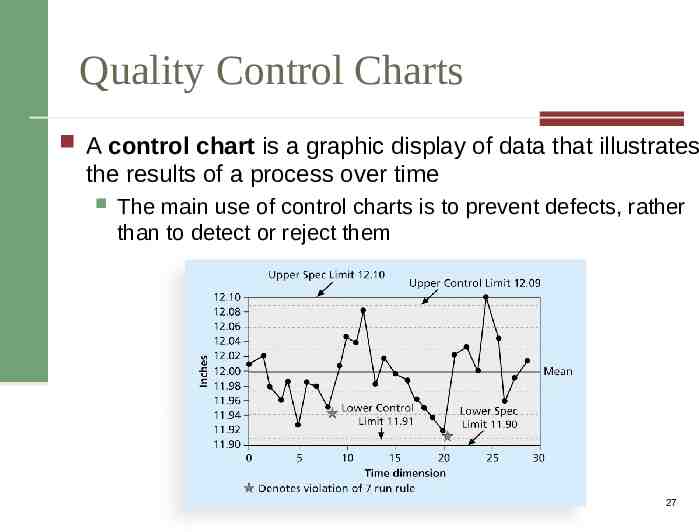
Quality Control Charts A control chart is a graphic display of data that illustrates the results of a process over time The main use of control charts is to prevent defects, rather than to detect or reject them 27
The Seven Run Rule You can use quality control charts and the seven run rule to look for patterns in data The seven run rule states that if seven data points in a row are all below the mean, above the mean, or are all increasing or decreasing, then the process needs to be examined for non-random problems Information Technology Project Management, Seventh Edition 28
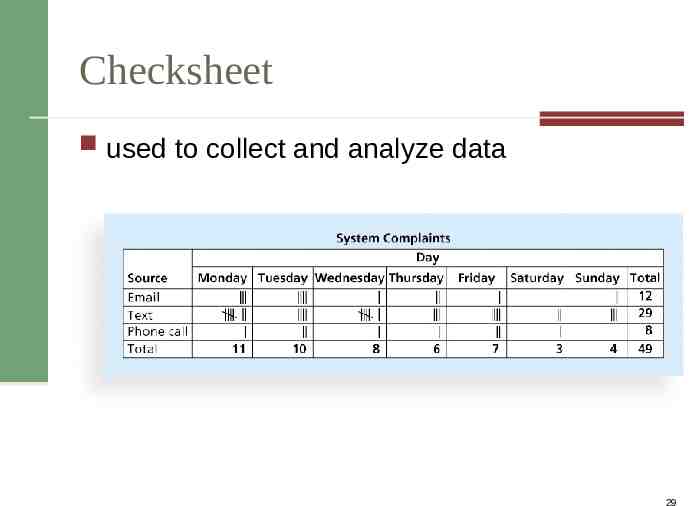
Checksheet used to collect and analyze data 29
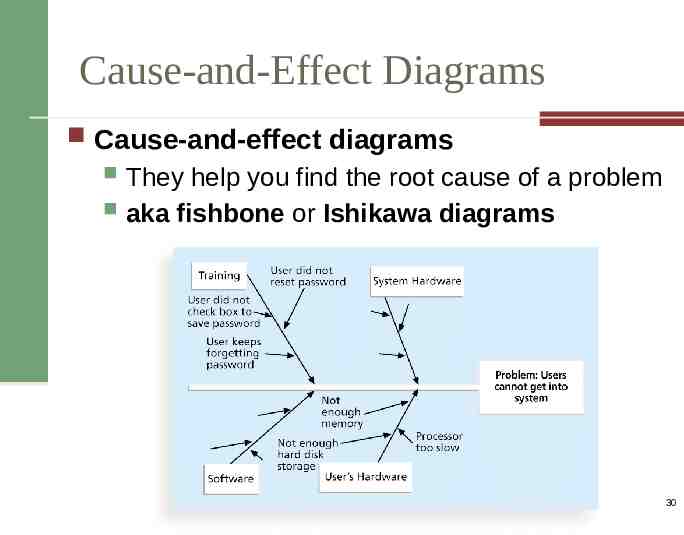
Cause-and-Effect Diagrams Cause-and-effect diagrams They help you find the root cause of a problem aka fishbone or Ishikawa diagrams 30