R – a brief introduction Johannes Freudenberg Cincinnati Children’s

19 Slides64.00 KB
R – a brief introduction Johannes Freudenberg Cincinnati Children’s Hospital Medical Center [email protected]
Overview History of R Getting started R as a calculator Data types Missing values Subsetting Importing/Exporting data Plotting and Summarizing data Resources
History of R Statistical programming language S developed at Bell Labs since 1976 (at the same time as UNIX) Intended to interactively support research and data analysis projects Exclusively licensed to Insightful (“S-Plus”) R: Open source platform similar to S developed by R. Gentleman and R. Ihaka (U of Auckland, NZ) during the 1990s Since 1997: international “R-core” developing team Updated versions available every couple months
What R is and what it is not R is – – – – a programming language a statistical package an interpreter Open Source R is not – – – – a database a collection of “black boxes” a spreadsheet software package commercially supported
Getting started To obtain and install R on your computer 1) Go to http://cran.r-project.org/mirrors.html to choose a mirror near you 2) Click on your favorite operating system (Linux, Mac, or Windows) 3) Download and install the “base” To install additional packages 1) Start R on your computer 2) Choose the appropriate item from the “Packages” menu
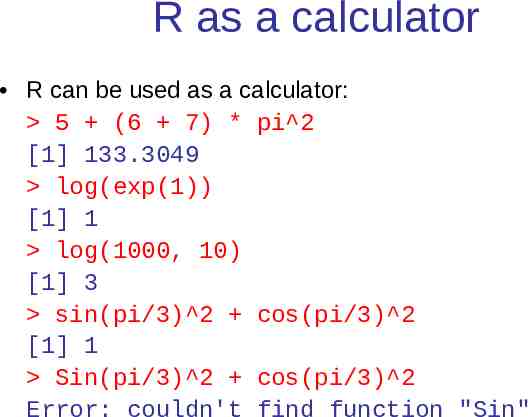
R as a calculator R can be used as a calculator: 5 (6 7) * pi 2 [1] 133.3049 log(exp(1)) [1] 1 log(1000, 10) [1] 3 sin(pi/3) 2 cos(pi/3) 2 [1] 1 Sin(pi/3) 2 cos(pi/3) 2 Error: couldn't find function "Sin"
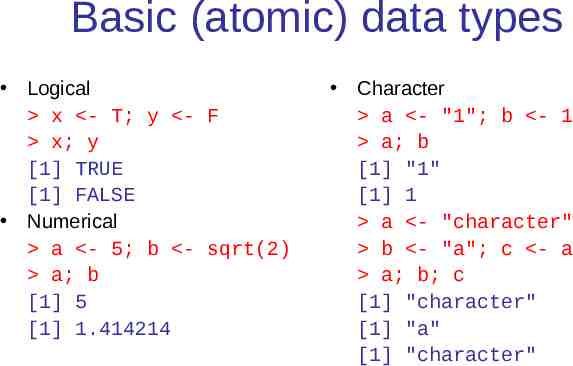
Basic (atomic) data types Logical x - T; y - F x; y [1] TRUE [1] FALSE Numerical a - 5; b - sqrt(2) a; b [1] 5 [1] 1.414214 Character a - "1"; b - 1 a; b [1] "1" [1] 1 a - "character" b - "a"; c - a a; b; c [1] "character" [1] "a" [1] "character"
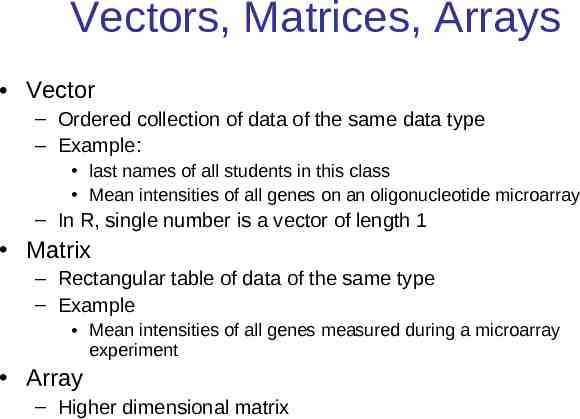
Vectors, Matrices, Arrays Vector – Ordered collection of data of the same data type – Example: last names of all students in this class Mean intensities of all genes on an oligonucleotide microarray – In R, single number is a vector of length 1 Matrix – Rectangular table of data of the same type – Example Mean intensities of all genes measured during a microarray experiment Array – Higher dimensional matrix
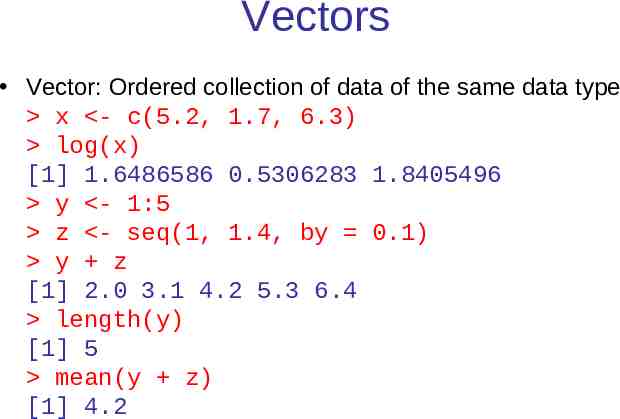
Vectors Vector: Ordered collection of data of the same data type x - c(5.2, 1.7, 6.3) log(x) [1] 1.6486586 0.5306283 1.8405496 y - 1:5 z - seq(1, 1.4, by 0.1) y z [1] 2.0 3.1 4.2 5.3 6.4 length(y) [1] 5 mean(y z) [1] 4.2
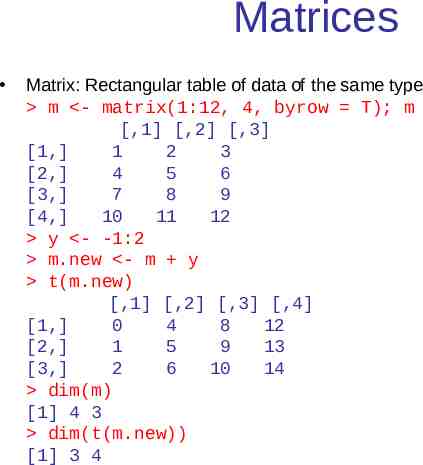
Matrices Matrix: Rectangular table of data of the same type m - matrix(1:12, 4, byrow T); m [,1] [,2] [,3] [1,] 1 2 3 [2,] 4 5 6 [3,] 7 8 9 [4,] 10 11 12 y - -1:2 m.new - m y t(m.new) [,1] [,2] [,3] [,4] [1,] 0 4 8 12 [2,] 1 5 9 13 [3,] 2 6 10 14 dim(m) [1] 4 3 dim(t(m.new)) [1] 3 4
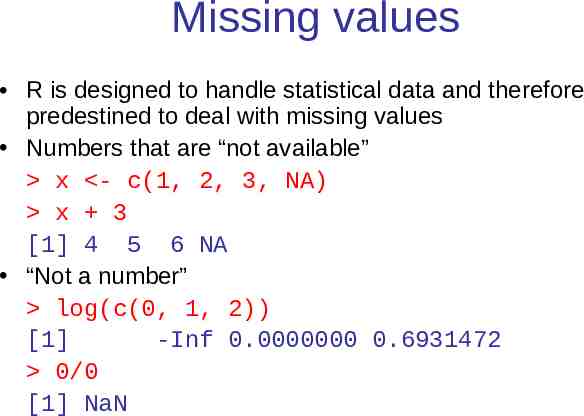
Missing values R is designed to handle statistical data and therefore predestined to deal with missing values Numbers that are “not available” x - c(1, 2, 3, NA) x 3 [1] 4 5 6 NA “Not a number” log(c(0, 1, 2)) [1] -Inf 0.0000000 0.6931472 0/0 [1] NaN
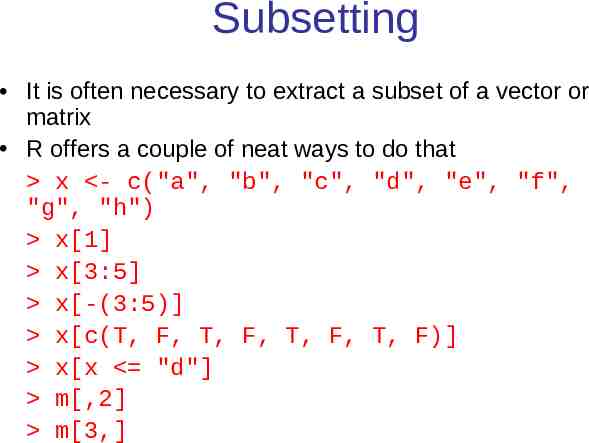
Subsetting It is often necessary to extract a subset of a vector or matrix R offers a couple of neat ways to do that x - c("a", "b", "c", "d", "e", "f", "g", "h") x[1] x[3:5] x[-(3:5)] x[c(T, F, T, F, T, F, T, F)] x[x "d"] m[,2] m[3,]
Other Objects and Data Types Functions Factors Lists Dataframes We’ll talk about them later in the course
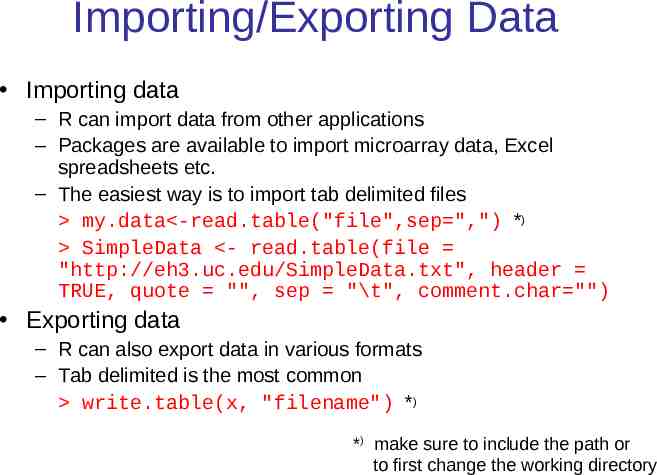
Importing/Exporting Data Importing data – R can import data from other applications – Packages are available to import microarray data, Excel spreadsheets etc. – The easiest way is to import tab delimited files my.data -read.table("file",sep ",") *) SimpleData - read.table(file "http://eh3.uc.edu/SimpleData.txt", header TRUE, quote "", sep "\t", comment.char "") Exporting data – R can also export data in various formats – Tab delimited is the most common write.table(x, "filename") *) *) make sure to include the path or to first change the working directory
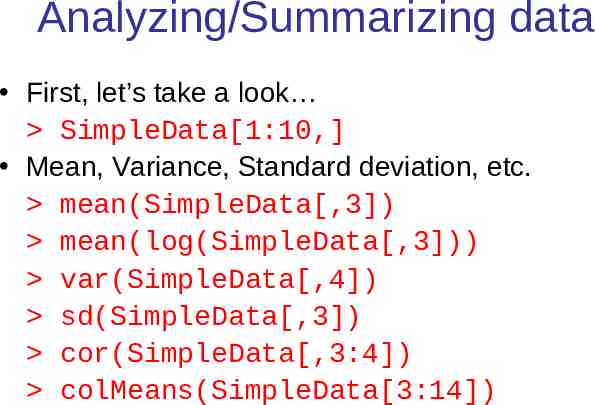
Analyzing/Summarizing data First, let’s take a look SimpleData[1:10,] Mean, Variance, Standard deviation, etc. mean(SimpleData[,3]) mean(log(SimpleData[,3])) var(SimpleData[,4]) sd(SimpleData[,3]) cor(SimpleData[,3:4]) colMeans(SimpleData[3:14])
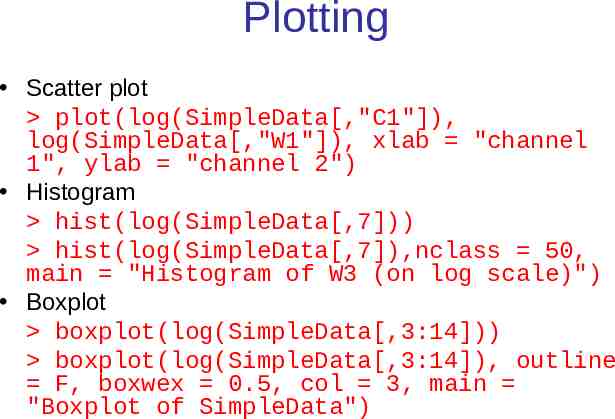
Plotting Scatter plot plot(log(SimpleData[,"C1"]), log(SimpleData[,"W1"]), xlab "channel 1", ylab "channel 2") Histogram hist(log(SimpleData[,7])) hist(log(SimpleData[,7]),nclass 50, main "Histogram of W3 (on log scale)") Boxplot boxplot(log(SimpleData[,3:14])) boxplot(log(SimpleData[,3:14]), outline F, boxwex 0.5, col 3, main "Boxplot of SimpleData")
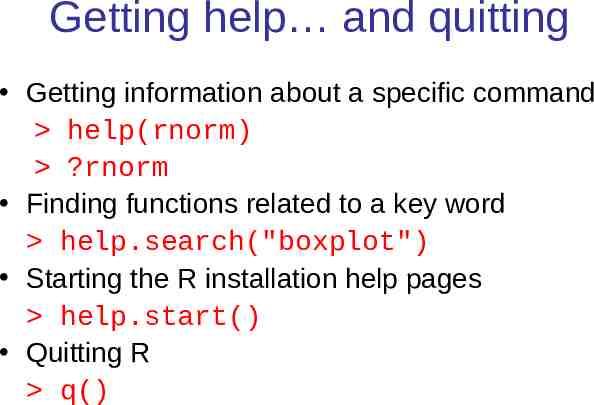
Getting help and quitting Getting information about a specific command help(rnorm) ?rnorm Finding functions related to a key word help.search("boxplot") Starting the R installation help pages help.start() Quitting R q()
Resources Books – Assigned text book – For an extended list visit http://www.r-project.org/doc/ bib/R-publications.html Mailing lists – R-help (http://www.r-project.org/mail.ht ml) – Bioconductor (http://www.bioconductor.org/m ailList.html) – However, first read the posting guide/ general instructions and search archives Online documentation – R Project documentation (http://www.r-project.org/) Manuals FAQs – Bioconductor documentation (http://www.bioconductor.org/) Vignettes Short Courses – Google Personal communication – Email me: [email protected] – Ask other R users
References H Chen: R-Programming. http://www.math.ntu.edu.tw/ hchen/Prediction/notes/R-p rogramming.ppt WN Venables and DM Smith: An Introduction to R. http://cran.r-project.org/doc/manuals/R-intro.pdf http://cm.bell-labs.com/cm/ms/departments/sia/S/ history.html