Monitoring Openstack – The Relationship Between Nagios and
38 Slides2.89 MB

Monitoring Openstack – The Relationship Between Nagios and Ceilometer Konstantin Benz, Researcher @ Zurich University of Applied Sciences [email protected]

Introduction & Agenda About me Working as researcher @ Zurich University of Applied Sciences OpenStack / Cloud Computing Engaged in monitoring and High Availability systems Currently working on a Europe-wide cloud federation: XIFI – eXtensible Infrastructure for Future Internet http://www.fi-xifi.eu 17 nodes / OpenStack clouds Test environment for Future Internet (FI-WARE) applications Infrastructure for smart cities, public healthcare, traffic management European-wide L2-connected backbone network Nagios as main monitoring tool of that project

Introduction & Agenda What are you talking about in this presentation? How to use Nagios to monitor an OpenStack cloud environment Integrate Nagios with OpenStack Anything else? Cloud monitoring requirements OpenStack cloud management software and Ceilometer Comparison between Nagios and Ceilometer: Technological paradigms Commonalities and differences How to integrate Nagios with Ceilometer Can't wait!

Cloud Monitoring Requirements Cloud virtualization elasticity Types of clouds: IaaS: virtual VMs and network devices, elasticity in number/size of devices PaaS: virtual, elastically sized platform SaaS: software provided by employing virtual, elastic resources Cloud is a collection of virtual resources provided in physical infrastructure Cloud provides resources elastically

Cloud Monitoring Requirements Why should someone use clouds? Cloud consumer can outsource IT infrastructure No fixed costs for cloud consumer Pay for resource utilization Cloud provider responsible for building and maintaining physical infrastructure Cloud provider can rent out unused IT infrastructure Eliminate waste Get money back for overcapacity

Monitoring OpenStack OpenStack Architecture Open source cloud computing software Consists in multiple services: Keystone: OpenStack identity services (authentication, authorization, accounting) Cinder: management of block storage volumes Nova: management and provision of virtual resources (VM instances) Glance: management of VM images Swift: management of object storage Neutron: management of network resources (IPs, routing, connectivity) Horizon: GUI dashboard for end users Heat: orchestration of virtualized environments (important for providing elasticity) Ceilometer: monitoring of virtual resources

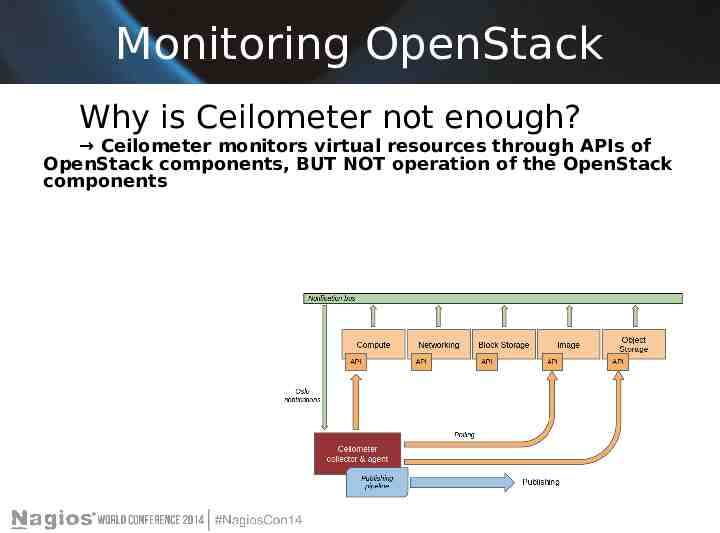
Monitoring OpenStack Things to monitor Operation of OpenStack itself: Services: Cinder, Glance, Nova, Swift . Infrastructure: Hardware, Operating System where OpenStack services are running Operation of virtual resources provided by OpenStack: Resource availability: VMs, virtual network devices Resource utilization: VM uptime, CPU / memory usage Virtual resources are commonly monitored by Ceilometer Ceilometer gathers data through the API of OpenStack services

Monitoring OpenStack Why is Ceilometer not enough? Ceilometer monitors virtual resources through APIs of OpenStack components, BUT NOT operation of the OpenStack components

Comparison Nagios / Ceilometer Nagios operational model Configuration: Check interval (and retry interval) to poll system status and update frontend GUI Remote execution of monitoring clients (usually Nagios plugins) Thresholds that result in "Okay", "Warning", "Critical" status messages which are sent back to Nagios server (and "Unknown" if status not measurable) Main usage: Effective monitoring solution for physical servers System administration console that allows for fast reaction in case of problems Strength: extensibility and customizability Nagios must be extended in order to monitor virtual resources inside administrated systems

Comparison Nagios / Ceilometer Ceilometer operational model Configuration: Polling services check metrics OpenStack objects generate event notifications automatically All events and metrics collected in a database Main usage: OpenStack integrated metrics collector and database Temporal database that can be used for rating, charging and billing of virtual resource utilization Strength: fully integrated in OpenStack, collecting most important metrics and storing their change history Weakness: Does not monitor physical hosts

Nagios / OpenStack Integration Alternative 1: Ceilometer Plugin in Nagios Use Nagios server as frontend for Ceilometer: Nagios plugin that queries Ceilometer database Virtual resource utilization data collected by Ceilometer Nagios server responsible for monitoring non-virtual resources Benefits: Simple and easy to implement No extra Nagios plugins required to monitor virtual devices that are managed within OpenStack Ceilometer tool can be left unchanged Drawbacks: Monitoring data is stored at 2 different places: Nagios flat file and Ceilometer database

Nagios / OpenStack Integration Alternative 1: Ceilometer Plugin in Nagios Implementation: Nagios plugin on client which hosts the Ceilometer API (code sample below) Initialization with default values, OpenStack authentication: #!/bin/bash #initialization with default values SERVICE 'cpu util' THRESHOLD '50.0' CRITICAL THRESHOLD '80.0' #get openstack token to access ceilometer-api export OS USERNAME "youruser" export OS TENANT NAME "yourtenant" export OS PASSWORD "yourpassword" export OS AUTH URL http://yourkeystoneurl:35357/v2.0/

Nagios / OpenStack Integration Alternative 1: Ceilometer Plugin in Nagios The plugin should receive paramaters for: Resource to be monitored (VM) Service (Ceilometer metric) Warning threshold Critical threshold while getopts ":hs:t:T:" opt do case opt in h) printusage;; r) RESOURCE {OPTARG};; s) SERVICE {OPTARG};; t) THRESHOLD {OPTARG};; T) CRITICAL THRESHOLD {OPTARG};; ?) printusage;; esac done

Nagios / OpenStack Integration Alternative 1: Ceilometer Plugin in Nagios Query Nova API to get resource to monitor (VM to be monitored): RESOURCE (nova list grep RESOURCE tail -2 head -1 awk -F ' ' '{print 2; end}') RESOURCE (echo RESOURCE) Query metric on that resource, multiple entries possible requires an iterator): ITERATOR (ceilometer meter-list -q "resource id RESOURCE" grep -w SERVICE awk 'END{print NR; end}') Initialize with return code 0 (no warning or error): RETURNCODE 0

Nagios / OpenStack Integration Alternative 1: Ceilometer Plugin in Nagios Iterate through metric: for (( C 1; C ITERATOR; C )) do METER NAME (ceilometer meter-list -q "resource id RESOURCE" grep -w SERVICE awk -F ' ' -v var " C" '{if (NR var) {print 2 1; end}}') METER UNIT (ceilometer meter-list -q "resource id RESOURCE" grep w SERVICE awk -F ' ' -v var " C" '{if (NR var) {print 4 1; end}}') RESOURCE ID (ceilometer meter-list -q "resource id RESOURCE" grep -w SERVICE awk -F ' ' -v var " C" '{if (NR var) {print 5 1; end}}') ACTUAL VALUE (ceilometer sample-list -m METER NAME -q "resource id RESOURCE" -l 1 grep RESOURCE ID head -4 tail -1 awk -F ' ' '{print 5; end}')

Nagios / OpenStack Integration Alternative 1: Ceilometer Plugin in Nagios Update return code if value of one metric is above a threshold: if [ (echo " ACTUAL VALUE THRESHOLD" bc) -eq 1 ] then if (( " RETURNCODE" "1" )) then RETURNCODE 1 fi if [ (echo " ACTUAL VALUE CRITICAL THRESHOLD" bc) -eq 1 ] then if (( " RETURNCODE" "2" )) then RETURNCODE 2

Nagios / OpenStack Integration Alternative 1: Ceilometer Plugin in Nagios Output return code: STATUS (echo " METER NAME on RESOURCE ID is: ACTUAL VALUE METER UNIT") echo STATUS done echo RETURNCODE

Nagios / OpenStack Integration Alternative 1: Ceilometer Plugin in Nagios Plugin can be downloaded from Github: https://github.com/kobe6661/nagios ceilometer plugin.git Additionally: NRPE-Plugin: remote execution of Nagios calls to Ceilometer Install NRPE on Nagios Core server and server that hosts Ceilometer API Change nrpe.cfg to include call to VM metric

Nagios / OpenStack Integration Alternative 1: Implementation OpenStack installed on 3 nodes: Management node: responsible for monitoring other OpenStack nodes Controller node: responsible for management and configuration of cloud resources (VMs, network) Compute node: provisions virtual resources

Nagios / OpenStack Integration Alternative 2: Nagios OpenStack Plugins Nagios as a tool to monitor OpenStack services and VMs: Plugins to monitor health of OpenStack services As soon as new VMs are created, Nagios should monitor them Requires elastic reconfiguration of Nagios Benefits: No data duplication, Nagios is the only monitoring tool required to monitor OpenStack Drawbacks: Elastic reconfiguration Rather complex Nagios configuration

Nagios / OpenStack Integration Alternative 2: Nagios OpenStack Plugins Problem: Dynamic provisioning of resources (Virtual Machines) Dynamic configuration ofMONITORS hosts in Nagios Server required Nagios Server OpenStack Controller Node VM Image PROVIDES Virtual Machine OpenStack Compute Node

Nagios / OpenStack Integration Alternative 2: Nagios OpenStack Plugins Problem: What happens if VM is terminated by end user? MONITORS and produces a critical warning Nagios assumes a host failure Nagios Server OpenStack Controller Node VM Image PROVIDES Virtual Machine OpenStack Compute Node

Nagios / OpenStack Integration Alternative 2: Nagios OpenStack Plugins Solution: Nova-API triggers reconfiguration of Nagios if VMs are created or terminated RECONFIGURES Nagios Server OpenStack Controller Node VM Image PROVIDES Virtual Machine OpenStack Compute Node

Nagios / OpenStack Integration Alternative 2: Nagios OpenStack Plugins Another problem: VMs must have Nagios plugins installed when they are created Solution: Use only VM Images that contain Nagios plugins for VM creation OR Use package management tools like Puppet, Chef Nagios Server OpenStack Controller Node NRPE Plugins VM Image NRPE Plugins PROVIDES Virtual Machine OpenStack Compute Node

Nagios / OpenStack Integration Alternative 2: Nagios OpenStack Plugins Trigger for dynamic Nagios configuration: Find available resources via nova-api (requires name of host and IP address) #!/bin/bash NUMLINES (nova list wc -l) NUMLINES [ NUMLINES-3] for (( C 1; C ITERATOR; C )) do VM NAME (nova list tail - NUMLINES awk -F' ' -v var " I" '{if (NR var){print 3 1;end}}') IP ADDRESS (nova list tail - NUMLINES awk -F' ' -v var " I" '{if (NR var){print 7 1;end}}' sed 's/[a-zA-Z0-9]*[ -]//g')

Nagios / OpenStack Integration Alternative 2: Nagios OpenStack Plugins Trigger for dynamic Nagios configuration: Create a config file including VM name and IP address from a template (e. g. vm template.cfg) CONFIG FILE (echo VM NAME).cfg sed "s/ vm name / VM NAME/g" vm template.cfg named template.cfg sed "s/ ip address / IP ADDRESS/g" named template.cfg CONFIG FILE Set Nagios as owner of the file and move file to Nagios configuration directory chown nagios.nagios CONFIG FILE chmod 644 CONFIG FILE mv CONFIG FILE /usr/local/nagios/etc/objects/ CONFIG FILE

Nagios / OpenStack Integration Alternative 2: Nagios OpenStack Plugins Trigger for dynamic Nagios configuration: Add config file to nagios.cfg echo "cfg file /usr/local/nagios/etc/objects/ CONFIG FILE" /usr/local/nagios/etc/nagios.cfg Restart nagios service nagios restart

Nagios / OpenStack Integration Alternative 2: Nagios OpenStack Plugins Why restart Nagios? Nagios must know that a new VM is present or that an old VM has been terminated Reconfigure and restart Nagios (!)

Nagios / OpenStack Integration Alternative 2: Nagios OpenStack Plugins Trigger for dynamic Nagios configuration: Add trigger to Nova-API: Nagios Event Broker module: Check MK: http://mathias-kettner.de/checkmk livestatus.html Reconfigure Nagios dynamically: Edit nagios.cfg and restart Nagios – bad idea (!!) in a cloud environment Autoconfiguration tools: NagioSQL: http://www.nagiosql.org/documentation.html

Nagios / OpenStack Integration Alternative 2: Nagios OpenStack Plugins What other ways do exist to dynamically reconfigure Nagios? Puppet master that triggers: VMs to install Nagios NRPE plugins and Nagios Server to update its configuration Same can be done with Chef, Ansible Drawback: Puppet scalability if 1‘000s of servers have to be (de-)commisioned dynamically

Nagios / OpenStack Integration Alternative 2: Nagios OpenStack Plugins What other ways do exist to dynamically reconfigure Nagios? Python fabric with Cuisine to trigger: VMs to install Nagios NRPE plugins and Nagios Server to update its configuration Get list of VMs from novaclient.client import Client nova Client(VERSION, USERNAME, PASSWORD, PROJECT ID, AUTH URL) servers nova.servers.list() Write VM list to file file open('servers'‚ 'w') file.write(servers)

Nagios / OpenStack Integration Alternative 2: Nagios OpenStack Plugins What other ways do exist to dynamically reconfigure Nagios? Python fabric with Cuisine to trigger: VMs to install Nagios NRPE plugins and Nagios Server to update its configuration Create fabfile.py and define which servers should be configured from fabric.api import * from . import vm recipe, nagios recipe env.use ssh config True servers open('servers‘) serverlist [str(line) for line in servers] env.roledefs {‘vm': serverlist, ‘nagios server': xx.xx.xx.xx }

Nagios / OpenStack Integration Alternative 2: Nagios OpenStack Plugins Assign recipes @roles(„vm") def configure vm(): vm recipe.ensure() @roles(„nagios") def configure nagios(): nagios recipe.ensure()

Nagios / OpenStack Integration Alternative 2: Nagios OpenStack Plugins Create vm recipe.py and nagios recipe.py from fabric.api import * import cuisine def ensure(): if not is installed(): puts("Installing NRPE.") install() else: puts(„NRPE already installed") def install prerequisites(): cuisine.package ensure(„nrpe")

Choice of Alternatives Which option should we choose? Implementation advantages and drawbacks Implementation Advantages Drawbacks A1: Ceilometer collects data Very easy solution Scales well Data duplication Two monitoring systems working in parallel A2: Shell script No data duplication Easy solution Difficult to maintain Possibly insecure Nagios is forced to restart A2: Puppet Automatic VM and Nagios configuration Allows for elastic reconfiguration of Nagios Heavyweight Bad scalability for large IaaS clusters Lightweight Automatic VM and Nagios configuration Allows for elastic reconfiguration of Nagios Bigger configuration effort for package management with strong dependencies between packages A2: Python fabric & cuisine

Conclusion What did you talk about? How to use Nagios to monitor an OpenStack cloud environment Cloud monitoring requirements: Elasticity, dynamic provisioning of virtual machines OpenStack monitoring tools Nagios and Ceilometer Nagios as extensible monitoring system Ceilometer captures data through Nova-API Nagios/OpenStack integration Alternative 1: Ceilometer monitors VMs with Nagios as graphical frontend Alternative 2: Nagios monitors VMs and is automatically reconfigured Discovered need for dynamic reloading of Nagios configuration Discussed advantages/drawbacks of different implementations

Questions? Any questions? Thanks!

The End Konstantin Benz [email protected]


