GIS – Whirlwind Tour (In 25 slides) What, Why, How


25 Slides520.00 KB
GIS – Whirlwind Tour (In 25 slides) What, Why, How
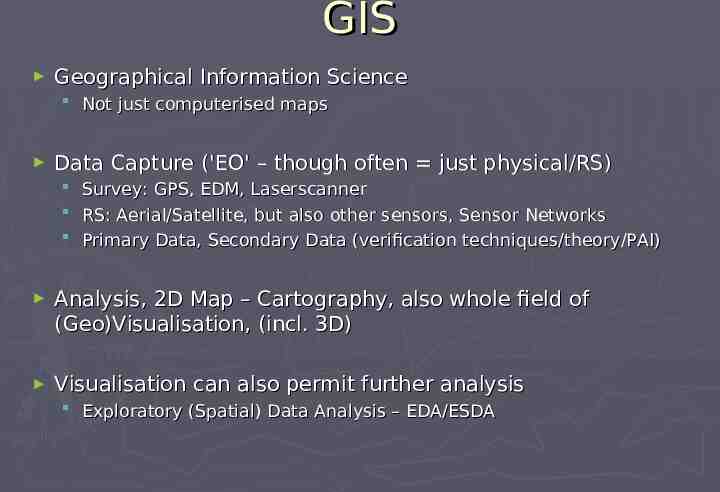
GIS Geographical Information Science Not just computerised maps Data Capture ('EO' – though often just physical/RS) Survey: GPS, EDM, Laserscanner RS: Aerial/Satellite, but also other sensors, Sensor Networks Primary Data, Secondary Data (verification techniques/theory/PAI) Analysis, 2D Map – Cartography, also whole field of (Geo)Visualisation, (incl. 3D) Visualisation can also permit further analysis Exploratory (Spatial) Data Analysis – EDA/ESDA
GIS – Three or Four Kinds Desktop Application / Full Package Web Mapping / Feature Server / Server Web Browser with GIS Tools / Thick Client GIS Apps, Mashups, APIs – Distributed GIS
Spatial Phenomena Land Use – Urban, Rural, Building Types Flood Risk, Water Transport, Soil Type Topography – Elevation, Slope, Aspect How does topog’ affect ‘occurrence’ in landscape People – Travel to work, shop, emergency services
Modelling Conceptual Models To understand world, predict conditions at locations in time and/or space Mathematical Models Numerical models where formalised - some idealised, some less so Data Models Structure and flow of information in time and space Spatial Data – often (not always) represented in maps (Lots of) Data with spatial component, some attempts to address time too Computerised Spatial Data - Quick Spatial Analysis over wide extent GIS – Geographical Information Science (and/or Systems)
GIS History / Software Geography Techniques (by hand) pre 1960s: John Snow, Minard’s Map (Napoleon) Forestry – Canada ( E Africa) - CGIS First GIS – Roger Tomlinson 1960 , operational from 1971 USA – Government Organisations: USGS, US Forest Serv, others incl. CIA Academia Edinburgh – GIMMS 1970 (Sold from 1973), MSc GIS 1985 Harvard – Computer Graphics and Spatial Analysis Lab 1965 ESRI 1969 Env. Consultancy – Arc/Info 1982 - ArcView Desktop 1995 - ArcGIS 1999 Physics/Space (Moon landings) later CAD/Utilities – LaserScan/Intergraph 1969 Demographics/Consultancy – MapInfo 1986 OpenSource – GRASS, Quantum GIS (QGIS), gvSIG, link to DBMS Web GIS – WMS, WFS, Google Maps, Google Earth, OGC, OpenStreetMap
Data Types Vector Points Lines Polygons Raster space – Discrete Entities within space – Contin’s Field/Surface across Elevation pH Growth Pot’l as secondary data based on above
Attributes Vector – Multiple Attributes (Properties) Attributes are of each feature (point, line, poly) Raster – Single Attribute (Value) e.g. pH Each cell has a different value of this attribute BUT! Can also have in turn Value Attributes e.g. 1 Acid, 7 Neutral, 14 Alkaline BUT! Again only one per value!
Model Framework to use – 1? Q. For mapping HGVs across Europe? Ans: Lines – A Linear Network (Vector) Lorries constrained to linear road network Each road can have multiple attributes: speed limit, length, width, number of lanes
Model Framework to use – 2 Q. To model flow/drainage in moorland? Ans: Raster Grid – A continuous surface Each cell can have a flow direction Need multiple spatially co-incident grids to combine in order to achieve end result (answer)
Spatial Co-incidence – Map Layers Combination of spatial and aspatial (often numerical) manipulation of data Grids lie on top of each other. Co-incident cells can then be combined numerically to give result. GIS all about combining info from different Layers Layers form a stack – but usually only in model – multiple measures found in same x,y,z (cell) location E.g. elevation, pH, salinity – each of these in different grid layer
Overlay – Attribute Transfer Can convert between raster vector but limited and tend to be treated in isolation but can be viewed together easily Can however easily combine vector layers – mathematical combination of geometry – easy to cut-up and intersect Vector Overlay Vector Overlay all about Attribute Transfer
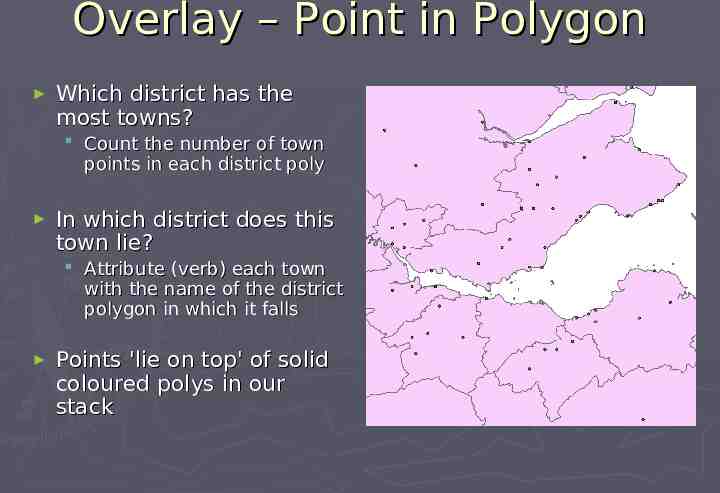
Overlay – Point in Polygon Which district has the most towns? Count the number of town points in each district poly In which district does this town lie? Attribute (verb) each town with the name of the district polygon in which it falls Points 'lie on top' of solid coloured polys in our stack
Overlay – Polygon Overlay Degree of overlap between different districts/zones/catchment areas E.g. Erase SSSI polygons from potential Golf Course polygons (unless you are a Trump) Intersect pollution zones with population zones ( 10,000 pop) to get danger zones!
Co-ord’te Reference Systems (CRS) – Map Projections, Datums Spatial Data can be measured/located in: Angular Units – Lat, Long, e.g. 56º23'4'' (dms), 56.38º (dd) Linear Units – Flat Grid-based: Easting, Northing, e.g. metres, ft Spherical (Angular) 'Geographic' CRS (unprojected) Flat Planar (Linear) 'Projected' CRS, e.g. BNG, UTM All CRS based on a reference datum – a model of the Earth’s surface/shape. This MUST be correctly defined, for any later projection (curved to flat) to WORK correctly. If collecting GPS data in Britain, we want to end up in BNG but MUST define source data as WGS84 datum / geographic sys as THAT is what the GPS uses. Once source data defined we can project to BNG.
Simple GIS – Google Earth Last point less of an issue if using Simple GIS – Google Earth – uses WGS84 lat long; loads in KML files – now often saved by GPS software directly. E.g. GPS Utility. Or just write raw KML or use converter prog. Simple annotation / measurement tools etc. but also clever features, e.g. timestamp allows animation/viewing change through time Beware – Google Maps uses its own Mercator projection but you can link to KML URL in Google Maps Can make 'mashups': Google Maps, JavaScript, WMS, Scanned Maps NO pricey GIS package required
Industry Standard - ArcGIS ArcGIS: ArcMap – 2D, ArcScene 3D, ArcCatalog, others Relatively easy to get started, though can at times be overwhelming! Some similarity to Word/Excel in structure ArcToolbox now primary interface to functionality (or command line) though various toolbars (drop-down menus) too Beware – from v10 Arc tries to save everything to a default geodatabase in user’s home path. In UoE, home path is M: and for undergrads this may still be quite small. Thus must keep some space on M: even if other space available
File Formats Shapefile – Actually a set of 3-6 files (min 3) Prob one of most widely used file type – though closed, proprietary format Myfile.shp (geom), Myfile.shx, Myfile.dbf (attrs), .prj, . Move each file, or .zip all together at OS; just move the .shp in ArcCatalog Geodatabase Single file at OS level – neatly holds all vectors & rasters File Geodatabase now 1Tb (and there are ways to get up to 256 Tb!) In time will likely be the only thing to use (other GIS still use shp for now) Coverage (vector); Grid (raster) Older formats you may need to know about Hybrid structure of one folder mygrid and a shared info folder – shared between ALL coverages and grids in a containing folder Move ALL of these at OS – or better still use ArcCatalog only!
Data Storage Theory Hybrid Arc/Info model based on storing correct type of data in best place for that Data can be re-joined when required Same principle means store only relevant info in a table of particular feature types and join these at query/display time – also use key tables & numbers to reduce data vols Relational DBs good for this and can store spatial data – Many offer spatial extensions with spatial analysis functions
Database Storage Can connect GIS to RDBMS for: Better querying Robust storage Multi-user access and sophisticated control (only one user edits electoral district at a time!) Examples: ArcSDE – Create GeoDatabase in RDBMS SPIT – Connects QGIS to PostgreSQL(PostGIS)
Open (Source) GIS PostGIS, MySQL – Open Source DBMS – implement OGC standards OGC – Consortium of 482 Companies/Orgs – Define Open Standards OSGeo Found’n – Support develop’t of op’n source Geospatial software GRASS – Orig. US Army, now project of OS Geo GDAL (Conversion), GEOS (Geometry), rasdaman (rasters) Quantum GIS (QGIS) – Another OSGeo Project MapServer export, OpenStreetMap editor, Run GRASS datasets/tools within MapTiler (uses GDAL2Tiles) – Create OpenLayers/Google Maps Tilesets
Web GIS Tools – MapTiler, OpenLayers, MapServer, GeoServer Developers’ Platforms – JavaScript, AJAX, SVG, Java Google Earth/Maps, Virtual Earth, Streetmap OpenStreetMap, (interesting to compare against OS!) OS Get-a-map; OS OpenData (Apr 2010); OpenData API Simple User Requirements? – ArcGIS Online
The Future 1 – PDAs, AR, Apps Move from mainframe to desktop to distributed desktops, and distributed servers PDAs and Phones – ArcPad, GPS Maps Augmented AIS Reality – Scan horizon, Utilities – Ships, Planes – Track in Google Earth
The Future 2 – LBS, Sensors, Clouds Location Cloud Computing, Ubiquitous Computing Tracking Social People? Civil Liberties / Freedoms? inequality – advantaged vs disadvantaged? Free/VGI But Based Services, Sensor Networks more folk making bad maps - noise? a more skilled-up knowledgeable population ?
Thank You! Questions?