Global Water Market 2008: Opportunities in Scarcity and
18 Slides2.70 MB

Global Water Market 2008: Opportunities in Scarcity and Environmental Regulation A comprehensive 10 year forecast for the international water market as a whole. Global Water Market 2008: Opportunities in Scarcity and Environmental Regulation is a unique tool in the water industry right now. Totally up-to-date, it provides detailed market data and forecasts for 161 countries, along with global water trends and datasheets of all the figures used to generate the results. It is entirely electronic and in a far more user-friendly format than our previous reports. Global Water Market 2008 provides the user with instant access to various data sets, country profiles, graphs and market overview presentations at the touch of a button. This report offers highly analytical, expert data, designed to guide water professionals through the markets, competitors and opportunities that they will encounter over the next decade.

Section 1: The Countries 161 Countries are covered in Global Water Market 2008: Opportunities in Scarcity and Environmental Regulation. Choose a country from the drop-down menu or click on an area of the world map on the report homepage to view your chosen country’s profile. A typical country snapshot will provide the following data: - Basic data i.e. Population, GDP, GDP/Head, Total annual renewable water resources etc. - Scarcity data - Water utility data - Market drivers -Total water market ( m) -Forecast data for: Municipal water and wastewater expenditure 2007-216 ( m) Water market data Industrial water and PPPs i.e.

Sample Country Snapshot: Turkey Click on the icon below to view an example of a full country profile If you received this slideshow in an email, please see the additional PDF attachment instead of clicking on the homepage icon.

Full Country List Afghanistan, Albania, Algeria, Angola, Argentina, Armenia, Australia, Austria, Azerbaijan, Bahrain, Bangladesh, Belarus, Belgium, Benin, Bhutan, Bolivia, Bosnia and Herzegovina, Botswana, Brazil, Bulgaria, Burkina Faso, Burundi, Cambodia, Cameroon, Canada, Central African Republic, Chad, Chile, China, Colombia, Congo Dem. Rep. Congo, Rep. Costa Rica, Cote d'Ivoire, Croatia, Cuba, Cyprus, Czech Republic, Denmark, Djibouti, Dominican Republic, Ecuador, Egypt, Arab Rep. El Salvador, Equatorial Guinea, Eritrea, Estonia, Ethiopia, Fiji, Finland, France, Gabon, Gambia, The, Georgia, Germany, Ghana, Greece, Guatemala, Guinea, Guinea-Bissau, Guyana, Haiti, Honduras, Hong Kong, Hungary, India, Indonesia, Iran, Islamic Rep. Iraq, Ireland, Israel, Italy, Jamaica, Japan, Jordan, Kazakhstan, Kenya, Korea, Dem. Rep, Korea, Rep. Kuwait, Kyrgyz Republic, Lao PDR, Latvia, Lebanon, Lesotho, Liberia, Libya, Lithuania, Macedonia, FYR, Madagascar, Malawi, Malaysia, Mali, Mauritania, Mauritius, Mexico, Moldova, Mongolia, Montenegro Morocco, Mozambique, Myanmar, Namibia, Nepal, Netherlands, New Zealand, Nicaragua, Niger, Nigeria, Norway, Oman, Pakistan, Panama, Papua New Guinea, Paraguay, Peru, Philippines, Poland, Portugal, Puerto Rico, Qatar, Romania, Russian Federation, Rwanda, Saudi Arabia, Senegal, Serbia, Sierra Leone, Singapore, Slovak Republic, Slovenia, Somalia, South Africa, Sri Lanka, Sudan, Swaziland, Sweden, Switzerland, Syrian Arab Republic, Taiwan, China, Tajikistan, Tanzania, Thailand, Timor-Leste, Togo, Trinidad and Tobago, Tunisia, Turkey, Turkmenistan, Uganda, Ukraine, United Arab Emirates, United Kingdom, United States, Uruguay, Uzbekistan, Venezuela, RB, Vietnam, West Bank and Gaza, Yemen, Rep, Zambia, Zimbabwe

Section 2: The Commentaries (In PowerPoint format) 1.1 Global water market growth 1.2 Global water market growth by region Fig 1: Global water market overview page 1. Presentation 1:Global water market overview Presentation length: 13 slides Presentation 2: Market drivers, scarcity and regulation Presentation length: 17 slides Tables and figures: 1.1 Global water market growth 1.2 Global water market growth by region 1.3 Total water market value 2007 1.4 Water utility costs 2007 1.5 Capital intensity of utility services 1.6 Open market growth vs. total market growth 1.7 The 15 largest water markets 1.8 The 15 largest growth markets Tables and figures: 2.1 Global internal renewable resources per person per year 2.2 The dynamics of water use 1900 – 2025 2.3 Recent evolution of precipitation patterns 2.4 Modeled precipitation patterns vs. observed precipitation patterns 2.5 Major international water transfer projects

The Commentaries continued Presentation 3: Municipal water and wastewater Presentation length: 20 slides Tables and figures: 3.1 Water and wastewater penetration by region 3.2 The global water and wastewater market 3.3 Capital intensity of different utility operations 3.4 Top 10 water-related aid recipients 3.5 Aid flows to the water sector 3.6 Sources of water funding 3.7 Private water contract structures 3.8 Major contract renewal dates in France 3.9 Private water growth 3.10 Expenditure by private water and wastewater companies 20072016 3.11 Private water & wastewater opex 2007-2016 by region 3.12 Private water & wastewater capex 2007-2016 by region 3.13 Global municipal capital expenditure and operating expenditure 2007-2016 3.14 Global municipal water and wastewater capital expenditure 20072016 3.15 Global municipal water and wastewater operating expenditure 2007-2016 3.16 Municipal combined water and wastewater opex by region 20072016 3.17 Municipal combined water and wastewater capex by region 2007-2016 3.18 The global municipal market for water treatment chemicals 2007-2016 by region 3.19 Capital expenditure on municipal water 3.20 Capital expenditure on municipal wastewater 3.21 Sludge management costs versus drinking water treatment costs in Lyon 3.22 The evolution of sludge management 1997 – 2017 3.23 Sludge management costs 3.24 The rising tide of sludge 3.25 Water and wastewater networks in key international markets 3.26 The rising cost of steel pipe installation in US water networks 2000-2006 3.27 Increasing cost of pipe-laying in the US 3.28 Suitability of materials for pipeline purposes 3.29 US water and wastewater pipes by age 3.30 Water pipe rehabilitation technology market forecast 3.31 Wastewater pipe rehabilitation technology market forecast 3.32 Plant procurement models in 2007 3.33 Plant procurement 2007 vs. 2016

The Commentaries continued Presentation 4: Industrial water and wastewater Presentation length: 18 slides Tables and figures: 4.1 Water treatment equipment: revenue share % 4.2 Wastewater treatment equipment: revenue share % 4.3 Industrial water equipment market by end user 4.4 Mobile water services potential revenues by region 4.5 Industrial water services 2007-2016 4.6 Revenue share by end-users 4.7 Revenue share by chemicals (percentage) 4.8 Growth forecast – power generation 4.9 Growth forecast – pulp and paper 4.10 Growth forecast – oil and gas 4.11 Growth forecast – food and beverage 4.12 Growth forecast – refineries 4.13 The global industrial water market 2007-2016 by revenue stream 4.14 The global industrial water market by region 2007-2016 4.4 Mobile water services potential revenues by region 4.5 Industrial water services 2007-2016

The Commentaries continued Presentation 5: Desalination, Reuse and Membranes Presentation length: 11 slides 5.15 Annual operating expenditure by region 2007-2016 5.16 Water reuse terms 5.17 Typical water reuse project costs 5.18 Typical energy consumption by treatment process 5.19 Processes used in wastewater reclamation and Tables and figures: contaminant removal 5.1 Membrane pore sizes in operation 5.20 Global reuse project survey 5.2 Seawater membrane element performance chronology 5.21 Water reuse growth 2006-2016 5.3 Desalination by intake water quality 5.22 Water reuse versus desalination 2006-2016 5.4 Desalination by end-user customer 5.23 Water reuse by region 2006-2016 5.24 Cost breakdown for a typical low pressure membrane 5.5 Desalination process comparison system 5.6 Water price trends in the desalination market 5.25 The municipal UF/MF membrane treatment plant market 5.7 Water price from selected desalination projects 2007 5.8 Relative operating costs of the main desalination processes 5.26 The municipal UF/MF membrane treatment plant market 5.9 Contracted desalination market share by technology 2016 2000 - 2007 5.27 UF/MF membrane systems in municipal water and 5.10 Desalination market growth wastewater treatment 2007-2016 5.11 Proposed desalination capacity by delivery 5.28 The municipal market for UF/MF membranes 2007-2016 mechanism 5.29 Low pressure membrane systems market growth 20075.12 EPC costs by category 2006-2010 and 2011-2015 2016 5.13 Operating costs by category 2005 – 2015 5.30 Low pressure membrane element market growth 20075.14 Annual capital expenditure thermal vs. membrane 2016 2006-2016

The Commentaries continued The politics of private water Presentation 6: Investing in water From an investor’s point of view, buying a water utility appears to be the best way of capitalising on the expected growth of the water sector. Unlike equipment supply or contracting, it gives you direct access to the end user market, and with the right contract or regulatory environment, it guarantees steady revenues for long into the future. Presentation length: 8 slides Unfortunately not everyone sees it that way, and investors who fail to appreciate the political dimension of private water will lose their money. Tables and figures: 6.1 Global water stocks vs. the MSCI World Index 6.2 Pictet Water Fund performance 6.3 Water funds September 2005 – June 2007 6.4 Specialist water funds 2007 6.3 The growth of international private water companies in emerging markets was strongly opposed by local trade unions, who joined forces with the anti-globalisation movement to protest vociferously against new contracts. The retreat of private water companies from high-profile contracts as Aguas Argentinas seemingly Water funds September 2005such – June vindicated the opposition. 2007 Since then, market leaders Veolia and Suez have maintained a low profile, focussing their business development efforts on those markets which are most receptive to outsourcing operations to the private sector – i.e. China and the Middle East. Other emerging markets are no longer prioritised. Nor indeed is the US, where both Veolia and Suez have scaled back their promotional activities since 2003, when Suez withdrew from Atlanta, and a tender to run water services in New Orleans collapsed. Both Veolia Water North America and Suez’s United Water subsidiary are focussing their marketing efforts on small communities in the US, where the financial case for privatisation is strongest, and the political opposition weakest. The real question is whether a post-IPO American Water will take a similar low profile approach to the politics of private water in the US. If it keeps a low profile like the French companies, it will undoubtedly disappoint its investors. If it does not, it will have a fight on its hands, but one which we believe to be winnable. After all, why should the home of capitalism need lessons in private enterprise from the French?

Section 3: The Datasets Users are provided with detailed datasets displaying all the information used to generate the tables and figures throughout the report 1) Municipal water and wastewater utilities Utility water service population Utility water service population Water pipe length Non-revenue water Metering Volume water supply Private water supply customers Private water treatment population equivalent Population with sewerage connection Population with sewerage connection Sewer pipe length Volume wastewater Proportion of wastewater receiving secondary treatment Private wastewater customers Private wastewater treatment population equivalent Utility revenues Operating costs Operating recovery rate Operating expenditure on water (before capital expenditure) Operating expenditure on wastewater (before capital expenditure) Municipal expenditure on water and wastewater treatment chemicals Municipal expenditure on parts & subcontracted services Total municipal capital expenditure 2007 Total capital expenditure on water 2007 Capex on water network maintenance 2007 Capex on water network expansion 2007 Capex on water treatment plants 2007 Capital expenditure on wastewater 2007 Wastewater network maintenance 2007 Wastewater network expansion 2007 Wastewater treatment plants 2007

The Datasets continued 2) Municipal market forecast Total municipal wastewater capital expenditure forecast 2007-2016 by country Annual percentage increase in capital expenditure Total municipal expenditure on wastewater network rehabilitation forecast 2007-2016 by country Total municipal expenditure on new wastewater networks forecast 20072016 by country Total municipal expenditure on wastewater treatment plants forecast 2007-2016 by country Total municipal drinking water capital expenditure forecast 2007-2016 by country Annual percentage increase in capital expenditure Total municipal expenditure on water network rehabilitation forecast 2007-2016 by country Total municipal expenditure on new water networks forecast 2007-2016 by country Total municipal expenditure on water treatment plants forecast 20072016 by country Total municipal wastewater capital expenditure forecast 2007-2016 by region Total municipal expenditure on wastewater network rehabilitation forecast 2007-2016 by region Total municipal expenditure on new wastewater networks forecast 20072016 by region Total municipal expenditure on wastewater treatment plants forecast 2007-2016 by region Total municipal drinking water capital expenditure forecast 2007-2016 by region Total municipal expenditure on water network rehabilitation forecast 2007-2016 by region Total municipal expenditure on new water networks forecast 2007-2016 by region Total municipal expenditure on water treatment plants forecast 2007-2016 by country Total municipal wastewater capital expenditure forecast 20072016 by region Total municipal expenditure on wastewater network rehabilitation forecast 2007-2016 by region Total municipal expenditure on new wastewater networks forecast 2007-2016 by region Total municipal expenditure on wastewater treatment plants forecast 2007-2016 by region Total municipal drinking water capital expenditure forecast 2007-2016 by region Total municipal expenditure on water network rehabilitation forecast 2007-2016 by region Total municipal expenditure on new water networks forecast 2007-2016 by region Total municipal expenditure on water treatment plants forecast 2007-2016 by region Combined operating expenditure expected 2007-2016 by country Water operating expenditure expected 2007-2016 by country Wastewater operating expenditure expected 2007-2016 by country Combined operating expenditure expected 2007-2016 by region Water operating expenditure expected 2007-2016 by region Wastewater operating expenditure expected 2007-2016 by region

The Datasets continued 3) Water scarcity 4) The industrial water market Country number Country name Region Population Total abstraction Total natural renewable water resources Abstraction/ availability balance Per capita availability 2007 Per capita availability 2011 Per capita availability 2016 Scarcity % Scarcity population Scarcity population 2011 Scarcity population 2016 Total abstraction Total natural renewable water resources 21,000,000 23.3km3 65km3 ECA 3,129,678 1.7km3 42km3 Algeria MNA 32,853,798 6.1km3 14km3 Angola AFR 15,941,392 0.3km3 184km3 Argentina LAC 38,747,148 29.1km3 814km3 Country name Regio n Afghanistan SAR Albania Population number Industrial equipment by country 2007 Industrial Chemicals & services by country 2007 Industrial equipment by country 2016 Industrial chemicals and services by country 2016 Total industrial water market forecast for top 40 economies 2007-2016 Water equipment market forecast for top 40 economies 2007-2016 Wastewater equipment market forecast for top 40 economies 2007-2016 Chemicals market forecast for top 40 economies 20072016 Outsourcing & services market forecast for top 40 economies 2007-2016 Market drivers: pulp & paper production Pulp & paper industry growth rate Market drivers: power generation Power generation market growth rate Market drivers: oil & gas O&G capacity growth Rate Oil refineries capacity Refineries capacity growth rate Market drivers: food & beverage F&B capacity growth rate Metals and mining capacity growth rate Pharma/microelectronics industry growth rate

The Datasets continued 5) Private water Full listing (902 entries) of all private water contracts globally including: Start date Contract type Contract scope Country Location/nature Company Water population served Wastewater population served Ended (where appropriate) Water capacity (where available) Wastewater capacity (where available) Stake (where available) Project (where available) Length (where available) Private water capex 1997-2006 by region Private water opex 1997-2006 by region Private water capex forecast 2007-2016 Private wastewater capex forecast 2007-2016 Private water and wastewater capex forecast 2007-2016 Private water opex forecast 2007-2016 Private wastewater opex forecast 20072016 Private water and wastewater opex forecast 2007-2016 Consolidate data by contract type

The Datasets continued 6) Corporate transactions Full listing of mergers and acquisitions in the water sector since 2000 including: Date Vendor Country Target % acquired Acquirer Revenues Profit Profit type Acquirer type Price where available Price where available XSales multiple where available XProfit multiple where available Classification by Utility/Equipment supply/Desalination Notes 7) Publicly traded private water companies Company Name Ticker Country Latest full year revenues Revenues Year to end Operating Income Profit before tax Market cap Market cap Water % (of revenues) Utility Systems integrator Equipment supply Desalination
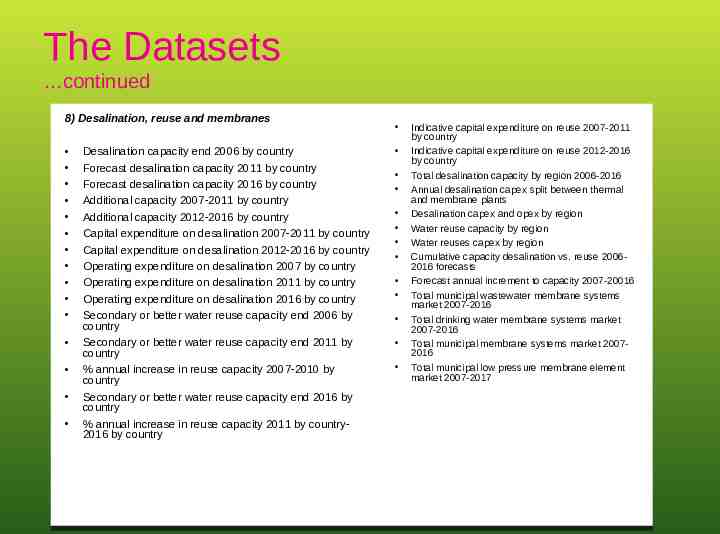
The Datasets continued 8) Desalination, reuse and membranes Desalination capacity end 2006 by country Forecast desalination capacity 2011 by country Forecast desalination capacity 2016 by country Additional capacity 2007-2011 by country Additional capacity 2012-2016 by country Capital expenditure on desalination 2007-2011 by country Capital expenditure on desalination 2012-2016 by country Operating expenditure on desalination 2007 by country Operating expenditure on desalination 2011 by country Operating expenditure on desalination 2016 by country Secondary or better water reuse capacity end 2006 by country Secondary or better water reuse capacity end 2011 by country % annual increase in reuse capacity 2007-2010 by country Secondary or better water reuse capacity end 2016 by country % annual increase in reuse capacity 2011 by country2016 by country Indicative capital expenditure on reuse 2007-2011 by country Indicative capital expenditure on reuse 2012-2016 by country Total desalination capacity by region 2006-2016 Annual desalination capex split between thermal and membrane plants Desalination capex and opex by region Water reuse capacity by region Water reuses capex by region Cumulative capacity desalination vs. reuse 20062016 forecasts Forecast annual increment to capacity 2007-20016 Total municipal wastewater membrane systems market 2007-2016 Total drinking water membrane systems market 2007-2016 Total municipal membrane systems market 20072016 Total municipal low pressure membrane element market 2007-2017

The Datasets continued The Water Tariff Survey 2007 explained And finally! Water prices are rising globally in response to rising energy costs and the realisation that current low water prices are unsustainable. Water prices rose 3.8% last year and 5.9% this year. However, this is still not enough to make the current water market sustainable. 9) GWI/OECD water tariff survey 2007 City name (259 cities covered) Utility name Country Water/m3 for 15m3/month user ( US) June 2007 Wastewater/m3 for 15m3/month user ( US) June 2007 Total Water & Wastewater/m3 for 15m3 per month user ( US) June 2007 Full structural detail of tariffs The US (historically renowned for low water prices) is closing the gap on Europe (traditionally highest water prices). The Water Tariff Survey is done in conjunction with the OECD (Organisation for Economic Cooperation and Development). It covers 250 cities globally and 250 million people, giving an unprecedented overview of the world water market. The survey gives water and wastewater prices for all these cities and people, and a year on year increase On the following page you can view a sample version of Water and Wastewater Utilities of the World: The Global Guide to the Top 2,500 Companies

Global Water Market 2008’s Sister report: Water and Wastewater Utilities of the World: The Global Guide to the Top 2,500 Companies The dataset field list is as follows: Country City/State Utility name Utility short name CEO name CEO title Address Locator Phone Fax E-mail Http Population served water (000's) Population served wastewater (000's) Water connections (000's) Wastewater connections (000's) Water Pipe Network (kms) Wastewater Pipe Network (kms) (Street) Drainage yes or no Bulk water /strategic body/Utility Status/Ownership type Owner/client body Click on the CD image above to view a sample version of the utilities database. If you received this slideshow in an email, see the additional Excel file for a sample.
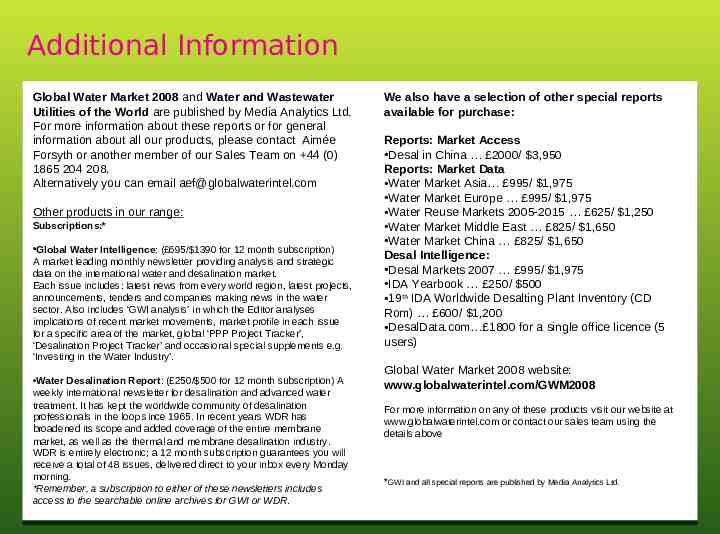
Additional Information Global Water Market 2008 and Water and Wastewater Utilities of the World are published by Media Analytics Ltd. For more information about these reports or for general information about all our products, please contact Aimée Forsyth or another member of our Sales Team on 44 (0) 1865 204 208. Alternatively you can email [email protected] Other products in our range: Subscriptions:* Global Water Intelligence: ( 695/ 1390 for 12 month subscription) A market leading monthly newsletter providing analysis and strategic data on the international water and desalination market. Each issue includes: latest news from every world region, latest projects, announcements, tenders and companies making news in the water sector. Also includes ‘GWI analysis’ in which the Editor analyses implications of recent market movements, market profile in each issue for a specific area of the market, global ‘PPP Project Tracker’, ‘Desalination Project Tracker’ and occasional special supplements e.g. ‘Investing in the Water Industry’. Water Desalination Report: ( 250/ 500 for 12 month subscription) A weekly international newsletter for desalination and advanced water treatment. It has kept the worldwide community of desalination professionals in the loop since 1965. In recent years WDR has broadened its scope and added coverage of the entire membrane market, as well as the thermal and membrane desalination industry. WDR is entirely electronic; a 12 month subscription guarantees you will receive a total of 48 issues, delivered direct to your inbox every Monday morning. *Remember, a subscription to either of these newsletters includes access to the searchable online archives for GWI or WDR. We also have a selection of other special reports available for purchase: Reports: Market Access Desal in China 2000/ 3,950 Reports: Market Data Water Market Asia 995/ 1,975 Water Market Europe 995/ 1,975 Water Reuse Markets 2005-2015 625/ 1,250 Water Market Middle East 825/ 1,650 Water Market China 825/ 1,650 Desal Intelligence: Desal Markets 2007 995/ 1,975 IDA Yearbook 250/ 500 19th IDA Worldwide Desalting Plant Inventory (CD Rom) 600/ 1,200 DesalData.com 1800 for a single office licence (5 users) Global Water Market 2008 website: www.globalwaterintel.com/GWM2008 For more information on any of these products visit our website at www.globalwaterintel.com or contact our sales team using the details above *GWI and all special reports are published by Media Analytics Ltd.


