Linear Regression Statistics Ch En 479

17 Slides335.73 KB
Linear Regression Statistics Ch En 479
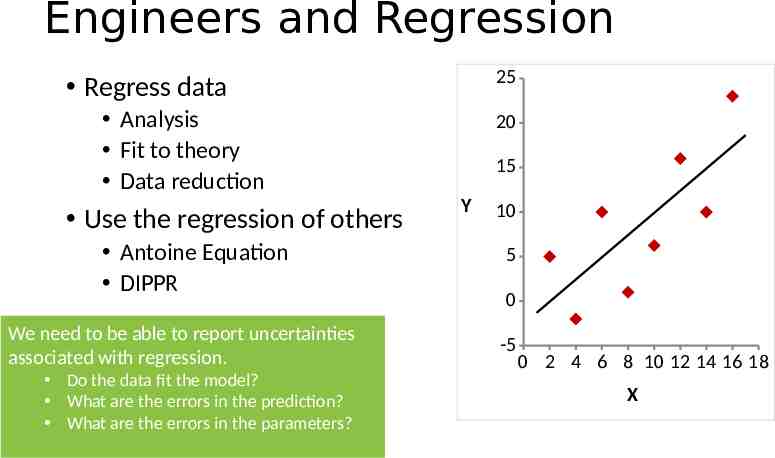
Engineers and Regression 25 Regress data Analysis Fit to theory Data reduction Use the regression of others Antoine Equation DIPPR We need to be able to report uncertainties associated with regression. Do the data fit the model? What are the errors in the prediction? What are the errors in the parameters? 20 15 Y 10 5 0 -5 0 2 4 6 8 10 12 14 16 18 X
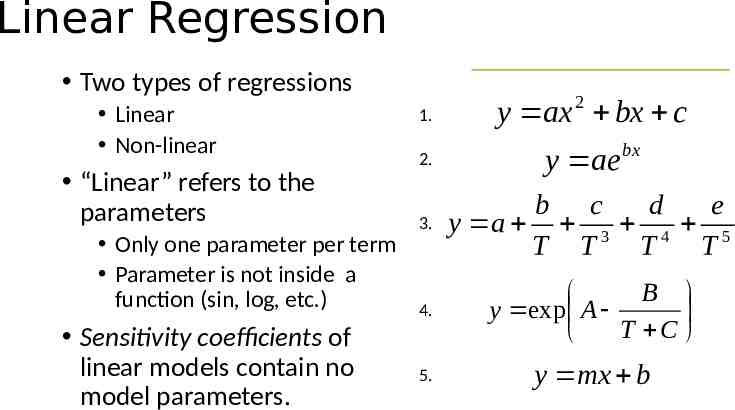
Linear Regression Quiz Two types of regressions Linear Non-linear “Linear” refers to the parameters Only one parameter per term Parameter is not inside a function (sin, log, etc.) Sensitivity coefficients of linear models contain no model parameters. 1. y ax 2 bx c 2. y aebx 3. b c d e y a 3 4 5 T T T T 4. B y exp A T C 5. y mx b
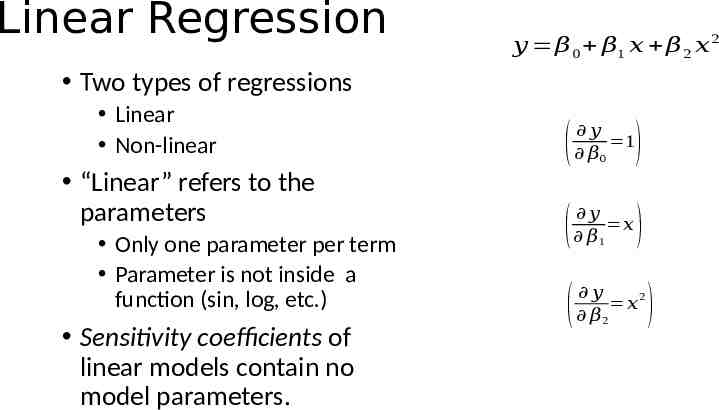
Linear Regression 𝑦 𝛽 0 𝛽1 𝑥 𝛽 2 𝑥 2 Two types of regressions Linear Non-linear “Linear” refers to the parameters Only one parameter per term Parameter is not inside a function (sin, log, etc.) Sensitivity coefficients of linear models contain no model parameters. ( 𝑦 1 𝛽0 ) ( 𝑦 𝑥 𝛽1 ) ( 𝑦 2 𝑥 𝛽2 )
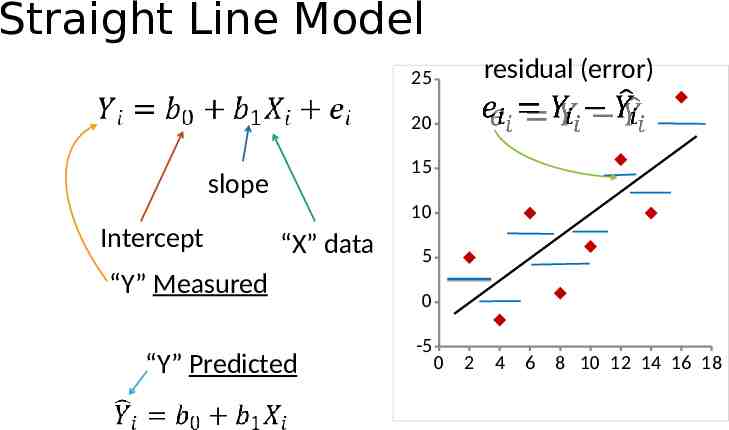
Straight Line Model residual (error) 25 20 15 slope 10 Intercept “X” data “Y” Measured “Y” Predicted 5 0 -5 0 2 4 6 8 10 12 14 16 18
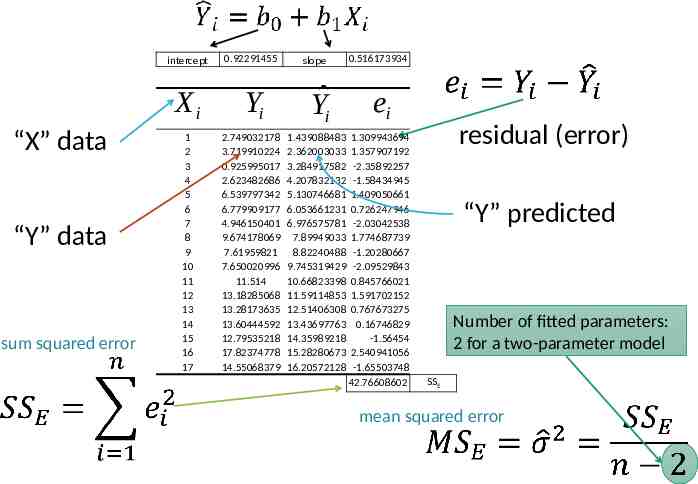
intercept Xi “X” data “Y” data sum squared error 1 2 3 4 5 6 7 8 9 10 11 12 13 14 15 16 17 0.92291455 Yi 2.749032178 3.719910224 0.925995017 2.623482686 6.539797342 6.779909177 4.946150401 9.674178069 7.61959821 7.650020996 11.514 13.18285068 13.28173635 13.60444592 12.79535218 17.82374778 14.55068379 slope Yˆi 1.439088483 2.362003033 3.284917582 4.207832132 5.130746681 6.053661231 6.976575781 7.89949033 8.82240488 9.745319429 10.66823398 11.59114853 12.51406308 13.43697763 14.35989218 15.28280673 16.20572128 0.516173934 ei 1.309943694 1.357907192 -2.35892257 -1.58434945 1.409050661 0.726247946 -2.03042538 1.774687739 -1.20280667 -2.09529843 0.845766021 1.591702152 0.767673275 0.16746829 -1.56454 2.540941056 -1.65503748 42.76608602 residual (error) “Y” predicted Number of fitted parameters: 2 for a two-parameter model SSE mean squared error
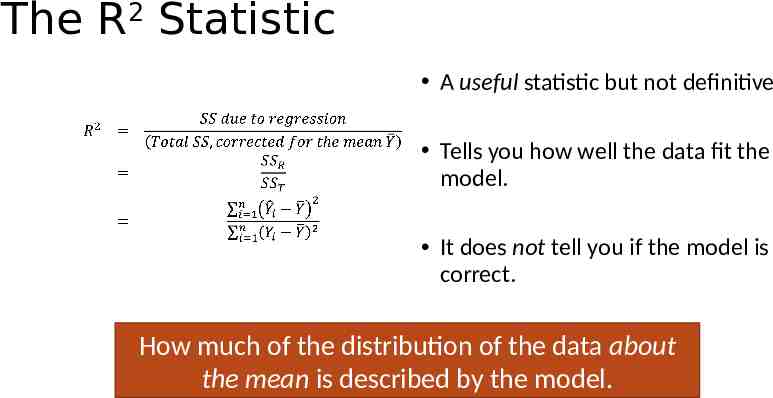
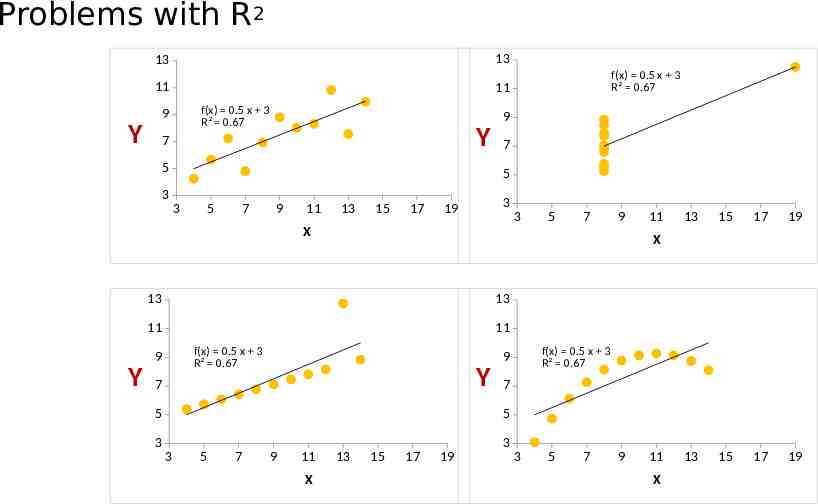
The R2 Statistic A useful statistic but not definitive Tells you how well the data fit the model. It does not tell you if the model is correct. How much of the distribution of the data about the mean is described by the model.
Problems with R2 13 13 11 11 f(x) 0.5 x 3 R² 0.67 9 Y f(x) 0.5 x 3 R² 0.67 9 Y 7 5 7 5 3 3 5 7 9 11 13 15 17 3 19 3 5 7 9 X Y 13 15 17 19 13 15 17 19 X 13 13 11 11 f(x) 0.5 x 3 R² 0.67 9 11 f(x) 0.5 x 3 R² 0.67 9 Y 7 5 7 5 3 3 3 5 7 9 11 X 13 15 17 19 3 5 7 9 11 X
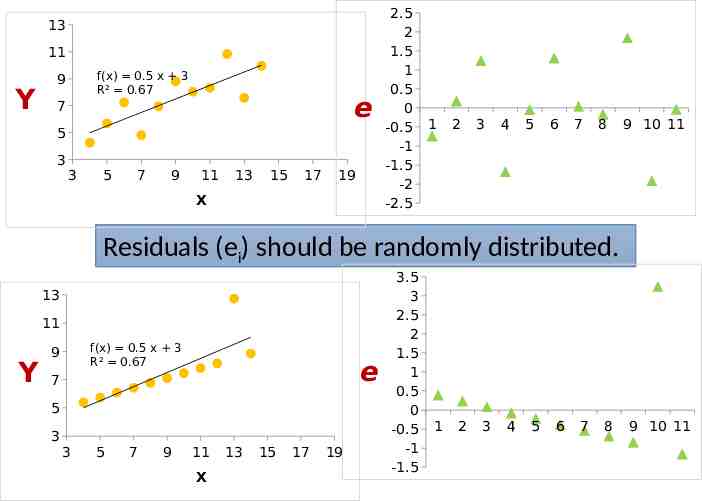
13 11 Y f(x) 0.5 x 3 R² 0.67 9 e 7 5 3 3 5 7 9 11 13 15 17 19 X 2.5 2 1.5 1 0.5 0 -0.5 -1 -1.5 -2 -2.5 1 2 3 4 5 6 7 8 9 10 11 Residuals (ei) should be randomly distributed. 13 11 Y f(x) 0.5 x 3 R² 0.67 9 e 7 5 3 3 5 7 9 11 X 13 15 17 19 3.5 3 2.5 2 1.5 1 0.5 0 -0.5 -1 -1.5 1 2 3 4 5 6 7 8 9 10 11
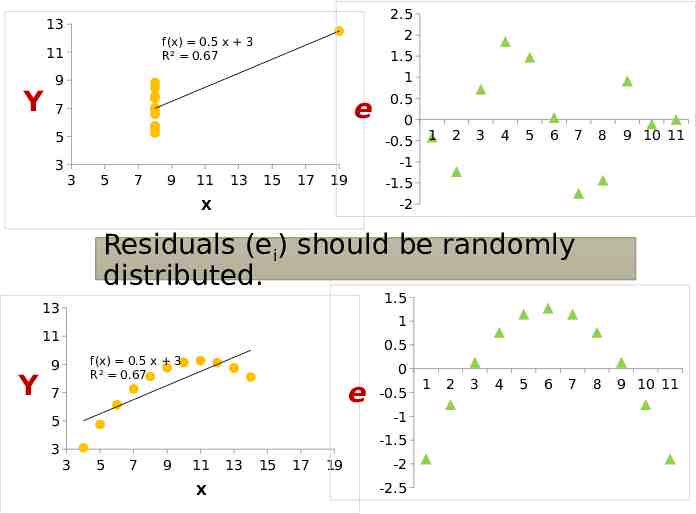
2.5 13 11 Y 2 f(x) 0.5 x 3 R² 0.67 1.5 1 9 e 7 0.5 0 5 -0.5 3 -1 3 5 7 9 11 13 15 17 19 1 2 3 4 5 6 7 8 9 10 11 -1.5 -2 X Residuals (ei) should be randomly distributed. 1.5 13 1 11 Y 0.5 f(x) 0.5 x 3 R² 0.67 9 e 7 -0.5 -1 5 3 0 -1.5 3 5 7 9 11 X 13 15 17 19 -2 -2.5 1 2 3 4 5 6 7 8 9 10 11
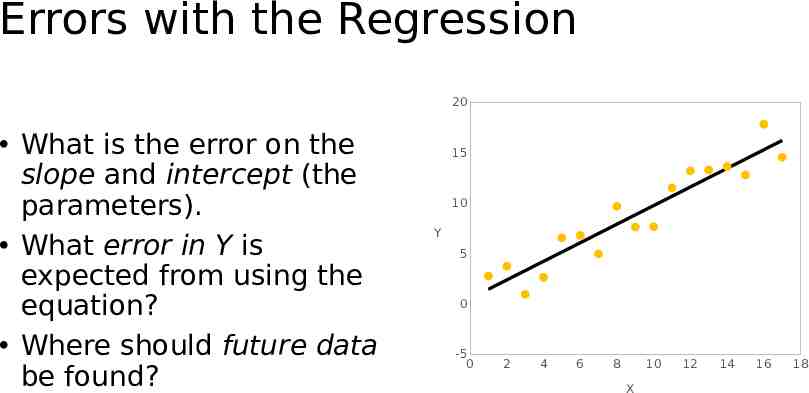
Errors with the Regression 20 What is the error on the slope and intercept (the parameters). What error in Y is expected from using the equation? Where should future data be found? 15 10 Y 5 0 -5 0 2 4 6 8 10 X 12 14 16 18
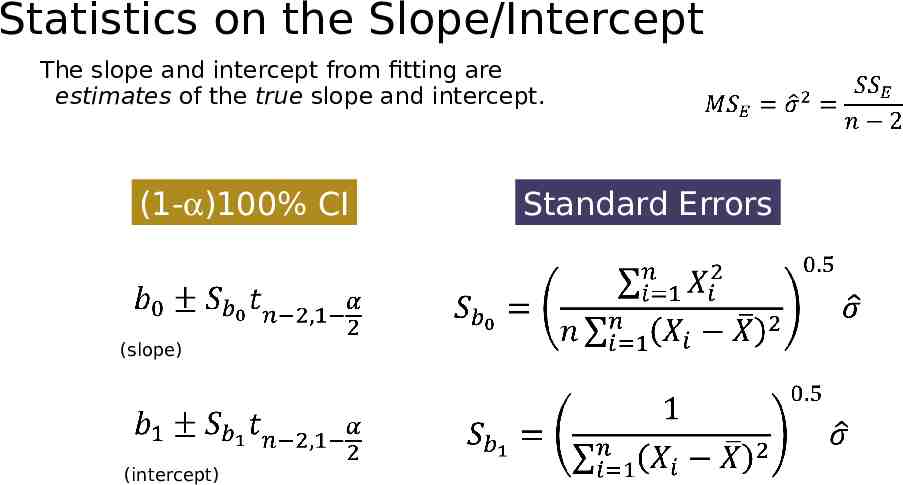
Statistics on the Slope/Intercept The slope and intercept from fitting are estimates of the true slope and intercept. (1-a)100% CI (slope) (intercept) Standard Errors
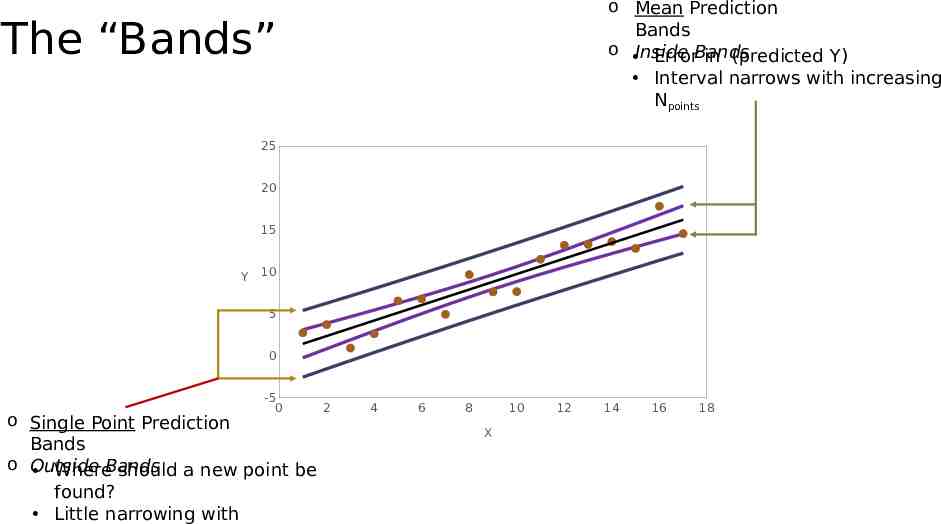
o Mean Prediction Bands o Inside ErrorBands in (predicted Y) Interval narrows with increasing Npoints The “Bands” 25 20 15 Y 10 5 0 -5 0 o Single Point Prediction Bands o Outside WhereBands should a new point be found? Little narrowing with 2 4 6 8 10 X 12 14 16 18
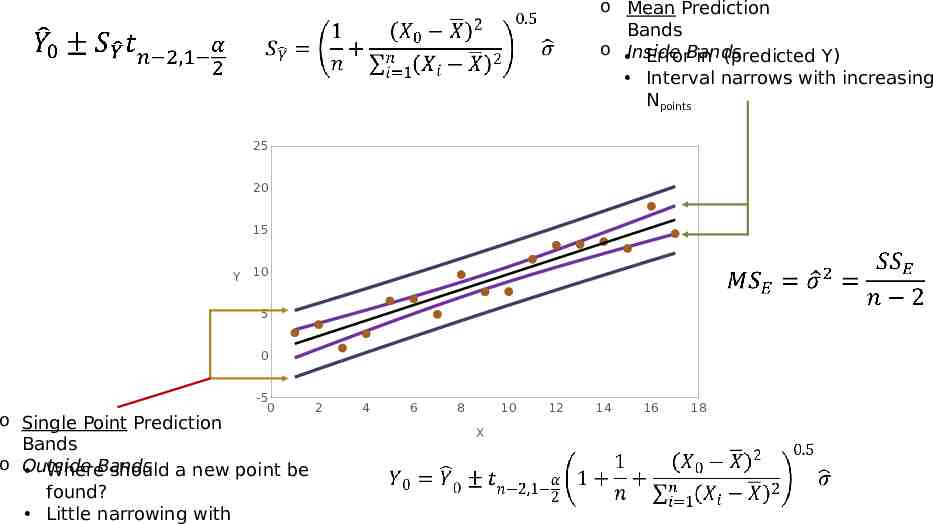
o Mean Prediction Bands o Inside ErrorBands in (predicted Y) Interval narrows with increasing Npoints 25 20 15 Y 10 5 0 -5 0 o Single Point Prediction Bands o Outside WhereBands should a new point be found? Little narrowing with 2 4 6 8 10 X 12 14 16 18
Example Using Excel
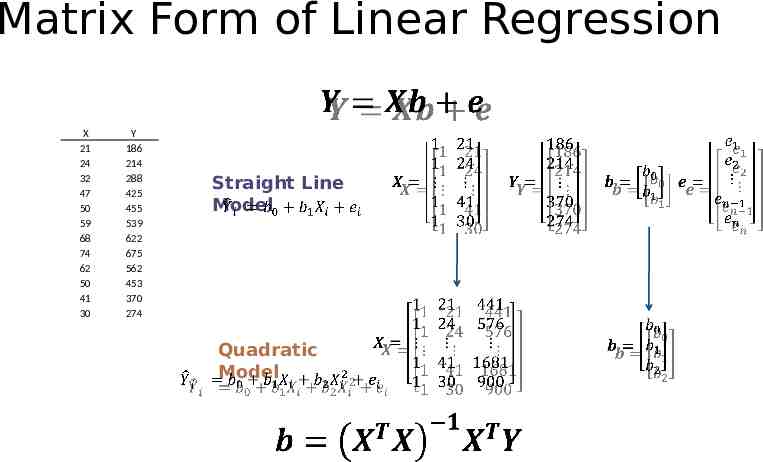
Matrix Form of Linear Regression X 21 24 32 47 50 59 68 74 62 50 41 30 Y 186 214 288 425 455 539 622 675 562 453 370 274 Straight Line Model Quadratic Model
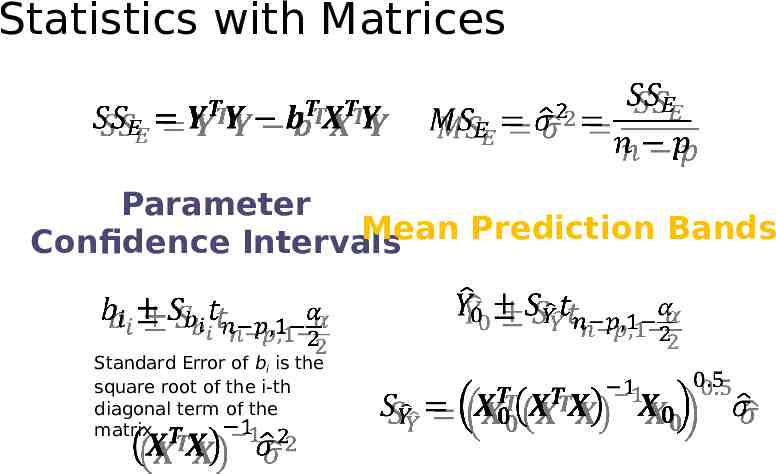
Statistics with Matrices Parameter Mean Prediction Bands Confidence Intervals Standard Error of bi is the square root of the i-th diagonal term of the matrix