Enrollment Projections and the Budget Process: A Technique for Smart

18 Slides167.50 KB
Enrollment Projections and the Budget Process: A Technique for Smart Planning SCUP-39 Annual Conference Toronto, Canada July 20, 2004 Carol Rylee, Director Budget Office University of Delaware Phone: 302-831-1234 Fax: 302-831-8530 Email: [email protected] Dale Trusheim, Associate Director Office of Institutional Research and Planning University of Delaware Phone: 302-831-2021 Fax: 302-831-8530 Email: [email protected]
Summary of Presentation Enrollment Projection Methods UD Enrollment Model Brief Demo of Excel Enrollment Proj Model IR Enrollment Model informs Budget Office Tuition Model Parameters & Relevance of Tuition Model Brief Demo of Tuition Model Questions
Enrollment Projection Methods Ad Hoc Cohort Survival Moving averages Exponential smoothing Time series (Box-Jenkins) Linear regression and auto regression SPSS Trends
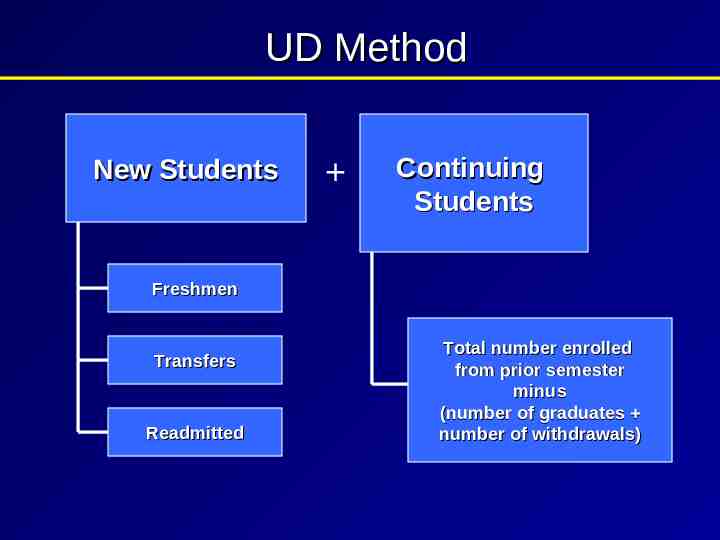
UD Method Enrollment in a given semester is simply a function of the behaviors of two groups of students: 1. New Students (Inputs) 2. Continuers
UD Method New Students Continuing Students Freshmen Transfers Readmitted Total number enrolled from prior semester minus (number of graduates number of withdrawals)
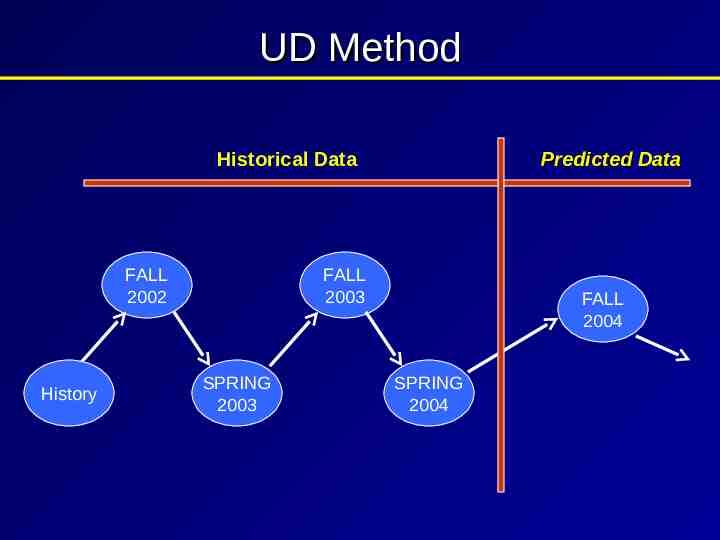
UD Method Historical Data FALL 2002 History Predicted Data FALL 2003 SPRING 2003 FALL 2004 SPRING 2004
UD Method Primary task is to develop a model to depict student flow and to generate a prediction for future enrollment . . . . . . MS EXCEL
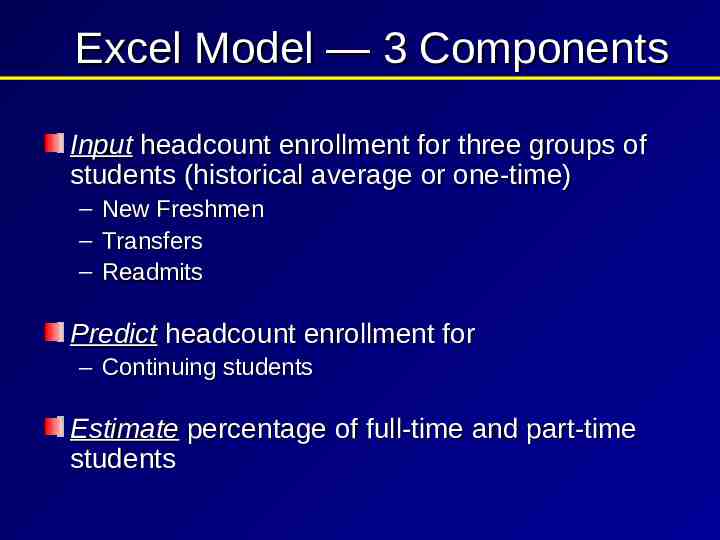
Excel Model — 3 Components Input headcount enrollment for three groups of students (historical average or one-time) – New Freshmen – Transfers – Readmits Predict headcount enrollment for – Continuing students Estimate percentage of full-time and part-time students
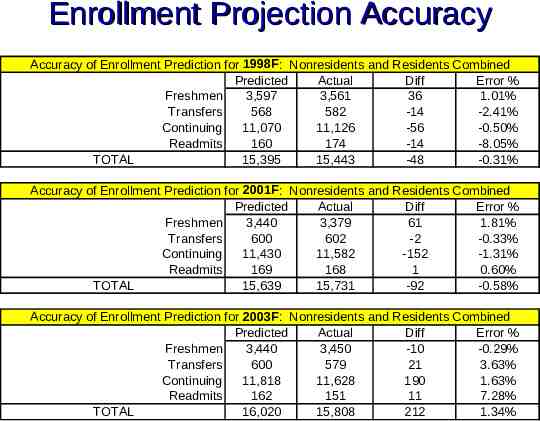
Enrollment Projection Accuracy Accuracy of Enrollment Prediction for 1998F: Nonresidents and Residents Combined Predicted Actual Diff Error % Freshmen 3,597 3,561 36 1.01% Transfers 568 582 -14 -2.41% Continuing 11,070 11,126 -56 -0.50% Readmits 160 174 -14 -8.05% TOTAL 15,395 15,443 -48 -0.31% Accuracy of Enrollment Prediction for 2001F: Nonresidents and Residents Combined Predicted Actual Diff Error % Freshmen 3,440 3,379 61 1.81% Transfers 600 602 -2 -0.33% Continuing 11,430 11,582 -152 -1.31% Readmits 169 168 1 0.60% TOTAL 15,639 15,731 -92 -0.58% Accuracy of Enrollment Prediction for 2003F: Nonresidents and Residents Combined Predicted Actual Diff Error % Freshmen 3,440 3,450 -10 -0.29% Transfers 600 579 21 3.63% Continuing 11,818 11,628 190 1.63% Readmits 162 151 11 7.28% TOTAL 16,020 15,808 212 1.34%
Enrollment Projection Model
Tuition Model Budget Office Model uses separate Excel model to projection tuition income Request Enrollment Model 3-4 times per year Use numbers from enrollment model in spreadsheet model of tuition income
Tuition Model Parameters FT/PT mix Resident/NonResident Mix Fall to Spring Attrition Upcharge over 17 credits Grad vs. Undergrad
Uses of Model Forecast Full-time Undergrad Construct what-if scenarios in regard to enrollment Easily calculate each x% or x change in tuition Identify source of variances of actual from budgeted.
Relevance of models Accurate budgeting of tuition – Don’t want to underbudget – campus confidence in numbers Is important – Don’t want to overbudget – leads to shortfall in income at year-end Assessment of accuracy of model – Can quickly identify source of variances – Allows fine-tuning of models
Relevance of Models Allows viewing of all factors related to enrollment and tuition income in succinct fashion Facilitates comparision of tuition budgets from year to year
Other than Full-time Tuition Part-time, Graduate and Special Sessions Model is based on numbers of credit hours by residency. Model is used in years when major changes are anticipated in mix and/or credit hours Otherwise, use projection of prior year actual increased by estimated tuition increase
Tuition Projection Model
Questions & Info Questions? Copy of Powerpoint and Excel Models are available at: http://www.udel.edu/ir/reports/presentations.html