ELA & Math Scale Scores Steven Katz, Director of State Assessment Dr.
17 Slides668.00 KB
ELA & Math Scale Scores Steven Katz, Director of State Assessment Dr. Zach Warner, State Psychometrician
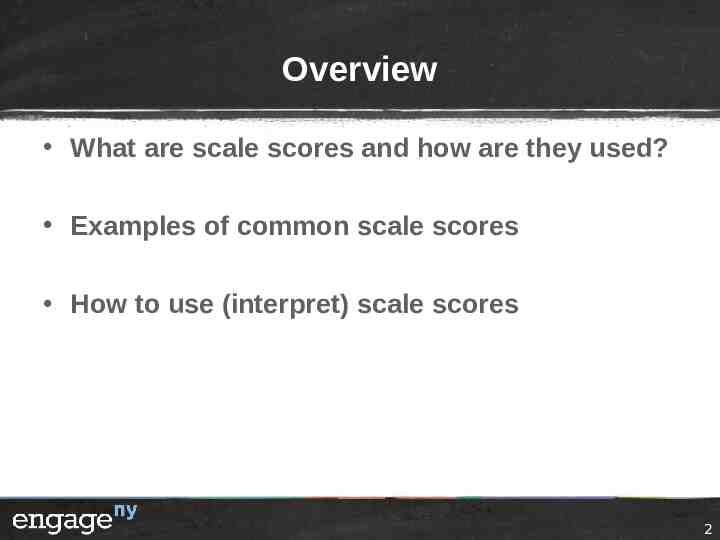
Overview What are scale scores and how are they used? Examples of common scale scores How to use (interpret) scale scores 2
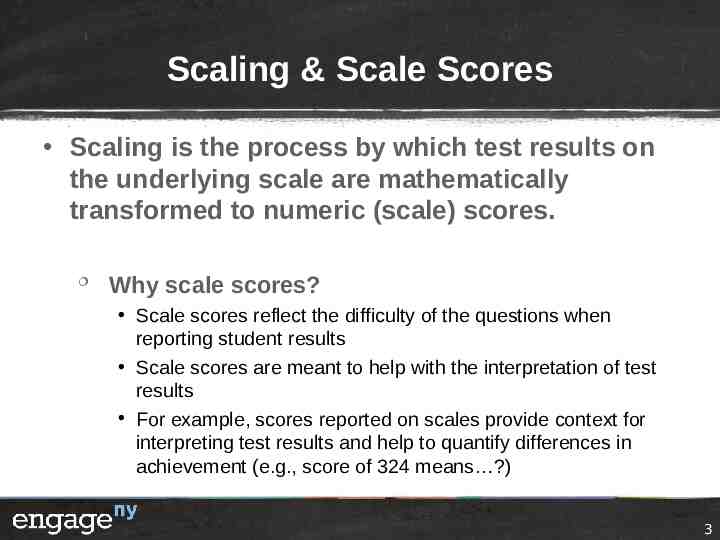
Scaling & Scale Scores Scaling is the process by which test results on the underlying scale are mathematically transformed to numeric (scale) scores. Why scale scores? Scale scores reflect the difficulty of the questions when reporting student results Scale scores are meant to help with the interpretation of test results For example, scores reported on scales provide context for interpreting test results and help to quantify differences in achievement (e.g., score of 324 means ?) 3
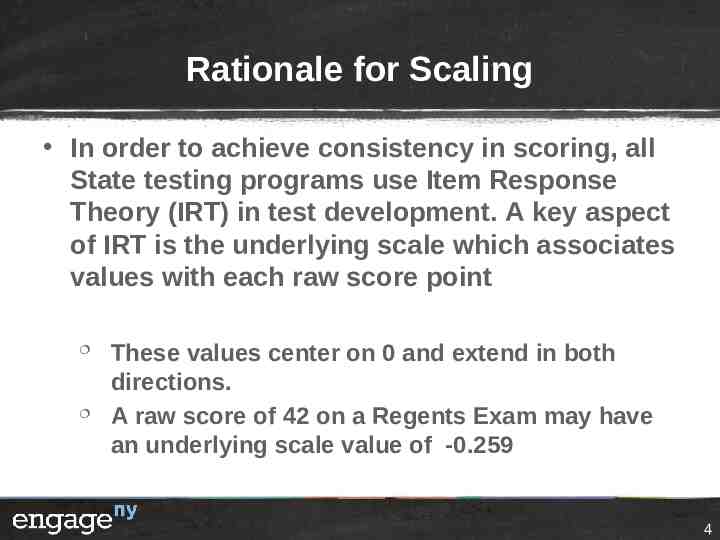
Rationale for Scaling In order to achieve consistency in scoring, all State testing programs use Item Response Theory (IRT) in test development. A key aspect of IRT is the underlying scale which associates values with each raw score point These values center on 0 and extend in both directions. A raw score of 42 on a Regents Exam may have an underlying scale value of -0.259 4
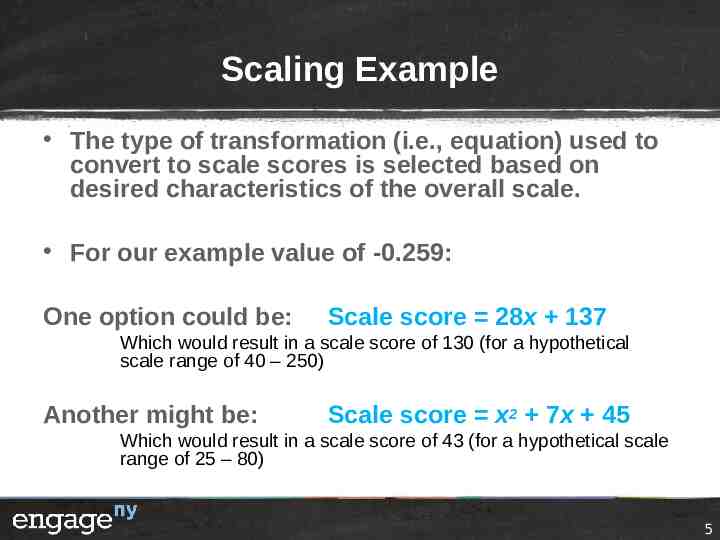
Scaling Example The type of transformation (i.e., equation) used to convert to scale scores is selected based on desired characteristics of the overall scale. For our example value of -0.259: One option could be: Scale score 28x 137 Which would result in a scale score of 130 (for a hypothetical scale range of 40 – 250) Another might be: Scale score x2 7x 45 Which would result in a scale score of 43 (for a hypothetical scale range of 25 – 80) 5
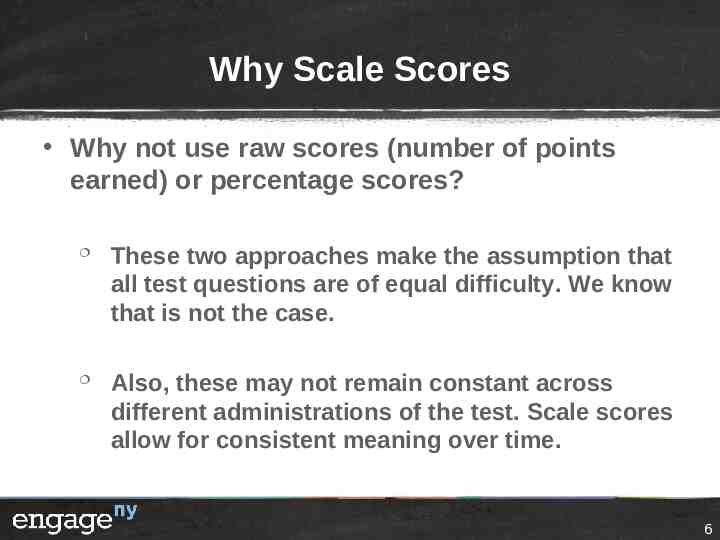
Why Scale Scores Why not use raw scores (number of points earned) or percentage scores? These two approaches make the assumption that all test questions are of equal difficulty. We know that is not the case. Also, these may not remain constant across different administrations of the test. Scale scores allow for consistent meaning over time. 6
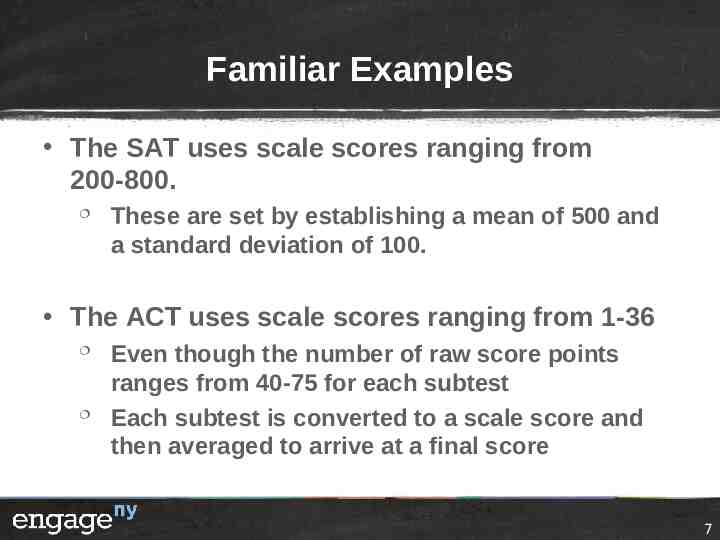
Familiar Examples The SAT uses scale scores ranging from 200-800. These are set by establishing a mean of 500 and a standard deviation of 100. The ACT uses scale scores ranging from 1-36 Even though the number of raw score points ranges from 40-75 for each subtest Each subtest is converted to a scale score and then averaged to arrive at a final score 7
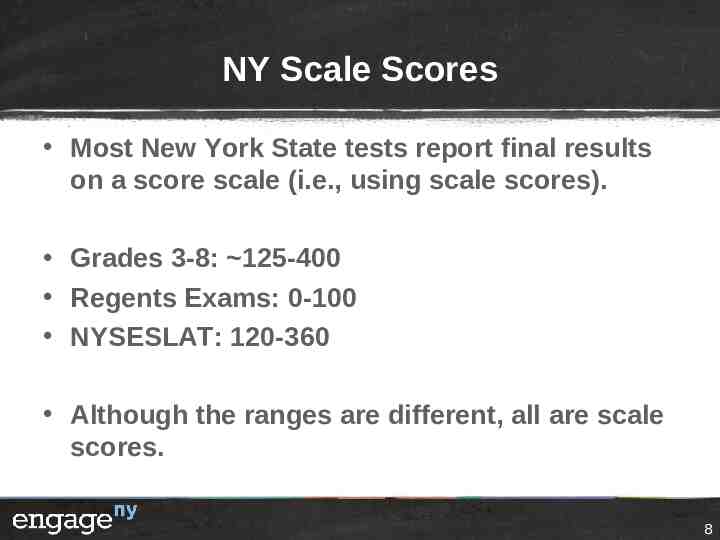
NY Scale Scores Most New York State tests report final results on a score scale (i.e., using scale scores). Grades 3-8: 125-400 Regents Exams: 0-100 NYSESLAT: 120-360 Although the ranges are different, all are scale scores. 8
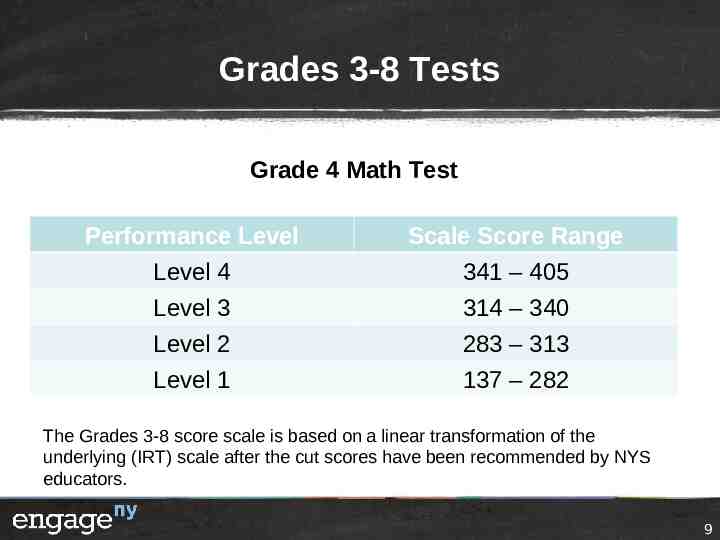
Grades 3-8 Tests Grade 4 Math Test Performance Level Scale Score Range Level 4 341 – 405 Level 3 314 – 340 Level 2 283 – 313 Level 1 137 – 282 The Grades 3-8 score scale is based on a linear transformation of the underlying (IRT) scale after the cut scores have been recommended by NYS educators. 9
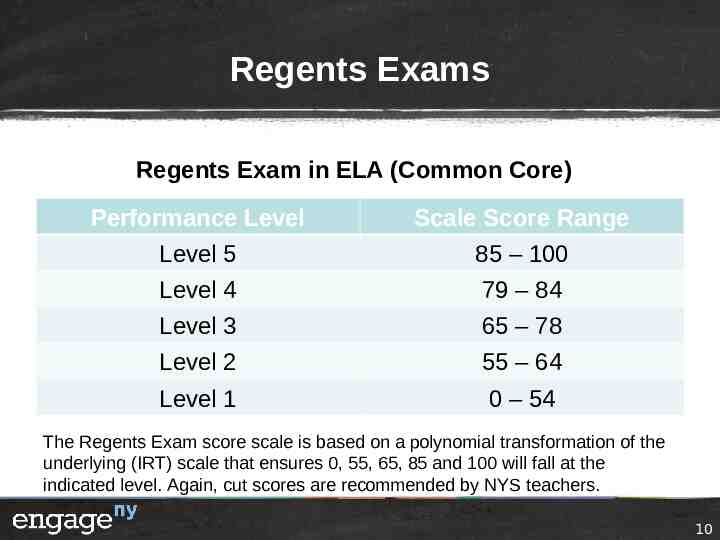
Regents Exams Regents Exam in ELA (Common Core) Performance Level Scale Score Range Level 5 85 – 100 Level 4 79 – 84 Level 3 65 – 78 Level 2 55 – 64 Level 1 0 – 54 The Regents Exam score scale is based on a polynomial transformation of the underlying (IRT) scale that ensures 0, 55, 65, 85 and 100 will fall at the indicated level. Again, cut scores are recommended by NYS teachers. 10
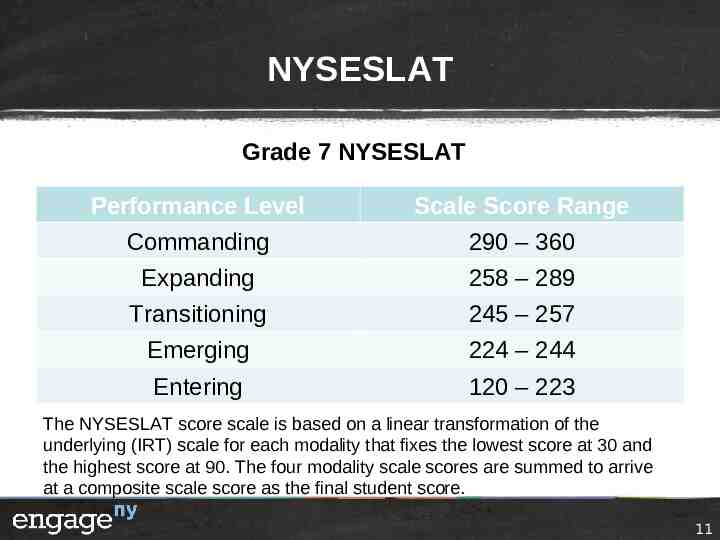
NYSESLAT Grade 7 NYSESLAT Performance Level Scale Score Range Commanding 290 – 360 Expanding 258 – 289 Transitioning 245 – 257 Emerging 224 – 244 Entering 120 – 223 The NYSESLAT score scale is based on a linear transformation of the underlying (IRT) scale for each modality that fixes the lowest score at 30 and the highest score at 90. The four modality scale scores are summed to arrive at a composite scale score as the final student score. 11
Holding the Baseline A baseline scale is established for each test when the performance standards are set. Note: this means that each exam has it’s own scale and cannot be compared to other titles. The equating process ensures that the meaning of the performance levels (and scale scores) are consistent from test to test across time e.g., a score of 65 in 2014 and in 2015 must require the same level of knowledge and skills 12
Interpretations Interpretations and conclusions made by performance level are appropriate as they allow for statements about the students in terms of knowledge and skills. Performance-level descriptions lay out the knowledge and skills associated with each level Interpretations and conclusions made using only scale scores only are less reliable (all scores contain error) and more limited in scope. Norm-referenced interpretations (e.g., class ranking) may be appropriate 13
Accurate Interpretation Example: Steve received a scale score of 81 on the Regents Exam in ELA (Common Core) Steve demonstrated the knowledge and skills consistent with performance level 4 which is defined as meeting the expectations of the CCLS for her grade/level. 14
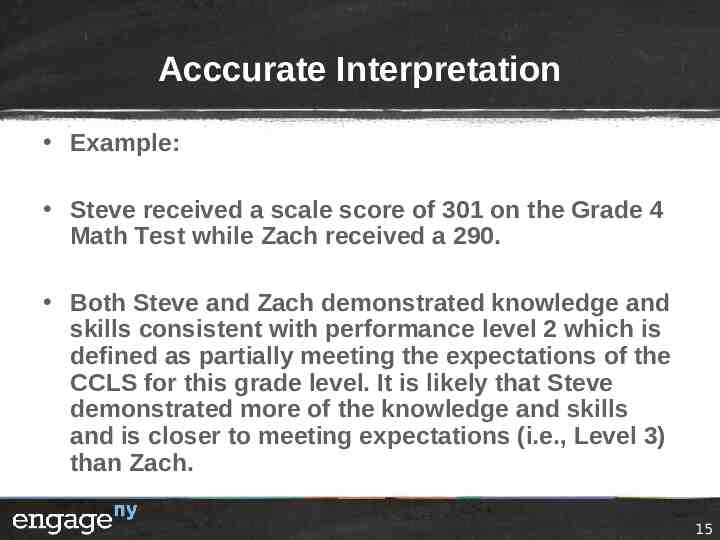
Acccurate Interpretation Example: Steve received a scale score of 301 on the Grade 4 Math Test while Zach received a 290. Both Steve and Zach demonstrated knowledge and skills consistent with performance level 2 which is defined as partially meeting the expectations of the CCLS for this grade level. It is likely that Steve demonstrated more of the knowledge and skills and is closer to meeting expectations (i.e., Level 3) than Zach. 15
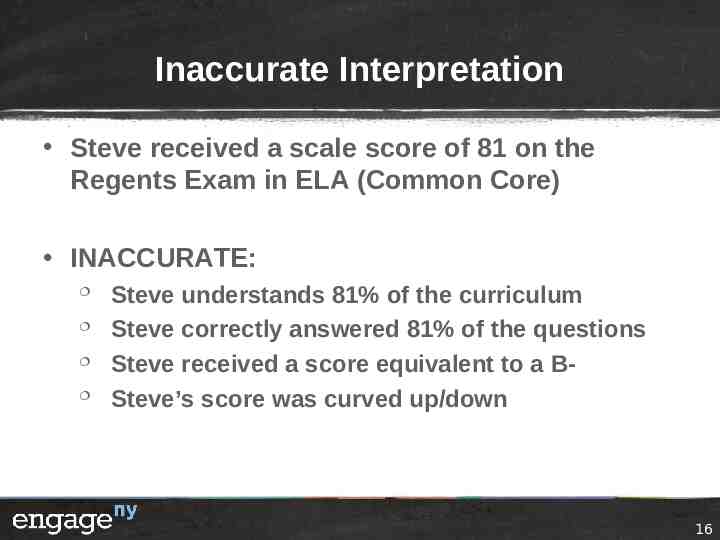
Inaccurate Interpretation Steve received a scale score of 81 on the Regents Exam in ELA (Common Core) INACCURATE: Steve understands 81% of the curriculum Steve correctly answered 81% of the questions Steve received a score equivalent to a BSteve’s score was curved up/down 16
Thank You Questions related to NYS assessments may be directed to: [email protected] For further reading, consider: https://www.ets.org/Media/Research/pdf/RD Connections16.pdf 17