DEPAUL UNIVERSITY SERVICE LEVEL AGREEMENTS AND PERFORMANCE METRICS
11 Slides181.50 KB
DEPAUL UNIVERSITY SERVICE LEVEL AGREEMENTS AND PERFORMANCE METRICS Marge Hayes Ashton Hayes Group January 31, 2000
SERVICE LEVEL AGREEMENTS PURPOSE Align IT Services with Customer Expectations Build on the Customer / IT Partnership Improve Communications Measure Service Delivery Effectiveness Promote Customer Satisfaction
SERVICE LEVEL AGREEMENTS BENEFITS Improved IT Understanding of Customer Expectations Improved Customer Understanding of IT Capabilities Business Based Metrics for Evaluation of Service Effectiveness Clearly Defined Roles, Responsibilities and Accountabilities Framework for Improving Customer Satisfaction and IT Services
SERVICE LEVEL AGREEMENTS APPROACH Review Customer and Applications within IT Meet with the Customer Analyze Gaps Define Metrics and Responsibilities Negotiate Service Level Agreements Establish Service Level Agreement
SERVICE LEVEL AGREEMENTS CATEGORIES OF SERVICE STANDARDS Availability - Focuses on When Responsiveness - Focuses on How Long Rate or Frequency - Focuses on How Many Timeliness - Focuses on How Soon Quality - Focuses on How Good
SERVICE LEVEL AGREEMENTS CRITICAL SUCCESS FACTORS Team Approach Management Support Customer Perspective Evolving Process
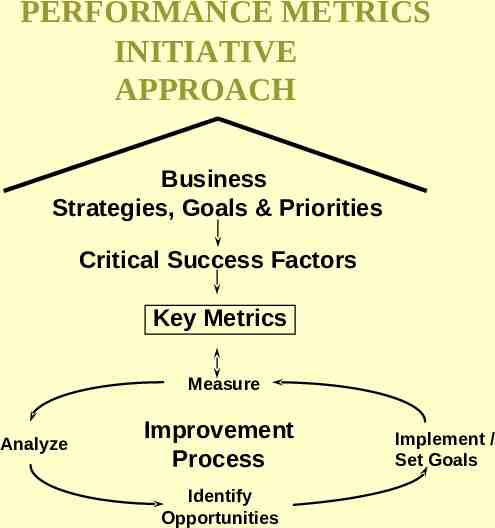
PERFORMANCE METRICS INITIATIVE Opportunity Communicate Success to Management Define Success for Staff Challenge Tell Story in Management Terms Align Staff with Corporate Goals Approach Critical Success Factors Improvement Process
PERFORMANCE METRICS INITIATIVE APPROACH Business Strategies, Goals & Priorities Critical Success Factors Key Metrics Measure Analyze Improvement Process Identify Opportunities Implement / Set Goals
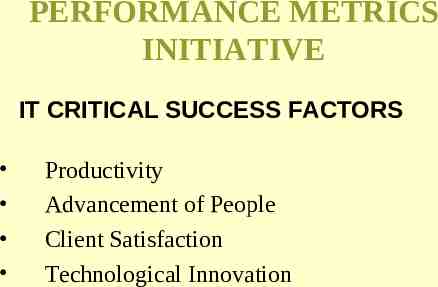
PERFORMANCE METRICS INITIATIVE IT CRITICAL SUCCESS FACTORS Productivity Advancement of People Client Satisfaction Technological Innovation
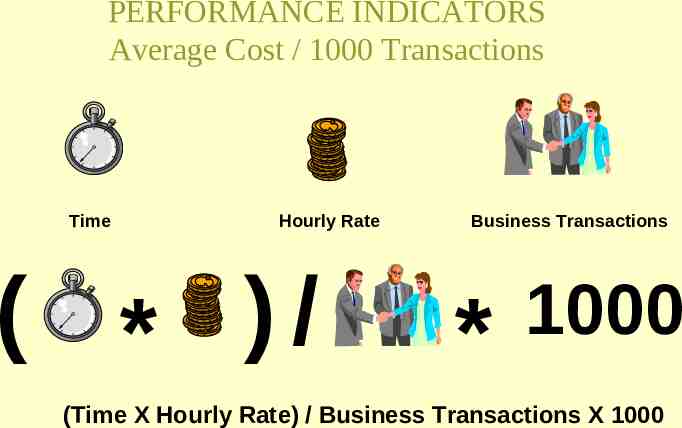
PERFORMANCE INDICATORS Average Cost / 1000 Transactions Time Hourly Rate ( * )/ Business Transactions * 1000 (Time X Hourly Rate) / Business Transactions X 1000
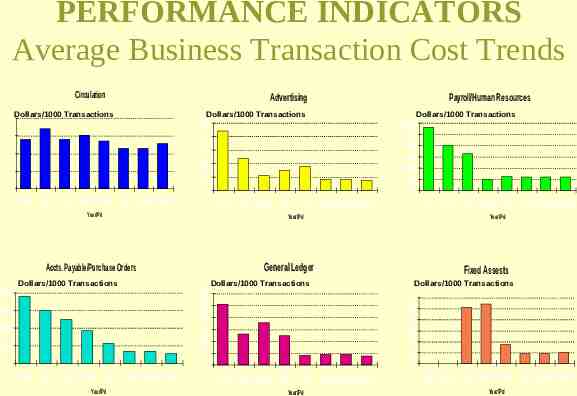
PERFORMANCE INDICATORS Average Business Transaction Cost Trends Circulation Advertising 80 Dollars/1000 Transactions Payroll/Human Resources Dollars/1000 Transactions 500 60 400 40 300 3000 2500 2000 1500 1000 500 0 200 20 100 0 0 1988 1989 1990 1991 1992 1993 LastQtr ThisPd 1988 Year/Pd 1989 1990 1991 1992 1993 LastQtr ThisPd Dollars/1000 Transactions 2000 300 250 200 150 100 50 0 1500 1000 500 0 1989 1990 1991 1992 Year/Pd 1993 LastQtr ThisPd 1989 1990 1991 1992 1993 LastQtr ThisPd Year/Pd General Ledger Dollars/1000 Transactions 1988 1988 Year/Pd Accts. Payable/Purchase Orders Dollars/1000 Transactions Fixed Assests Dollars/1000 Transactions 120 100 80 60 40 20 0 1988 1989 1990 1991 1992 1993 LastQtr ThisPd Year/Pd 1988 1989 1990 1991 1992 1993 LastQtr ThisPd Year/Pd