Course Review – Information Mgmt 1


43 Slides823.00 KB
Course Review – Information Mgmt 1
For Friday Final Project Deliverable Due in Recitation This th Friday, April 30
Final Exam Final Exam this Saturday, May 1st Submit your peer evaluation with your exam 7:30 PM – 10:00 PM MUEN E050
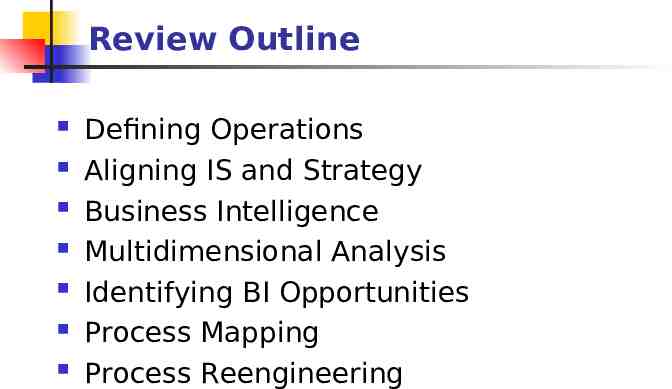
Review Outline Defining Operations Aligning IS and Strategy Business Intelligence Multidimensional Analysis Identifying BI Opportunities Process Mapping Process Reengineering
Defining Operations Operations is all about adding value, and creating wealth
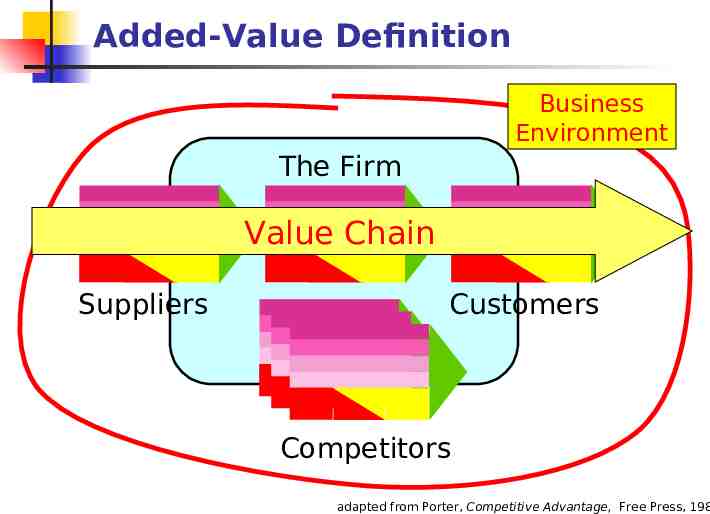
Added-Value Definition Business Environment The Firm Value Chain Suppliers Customers Competitors adapted from Porter, Competitive Advantage, Free Press, 198
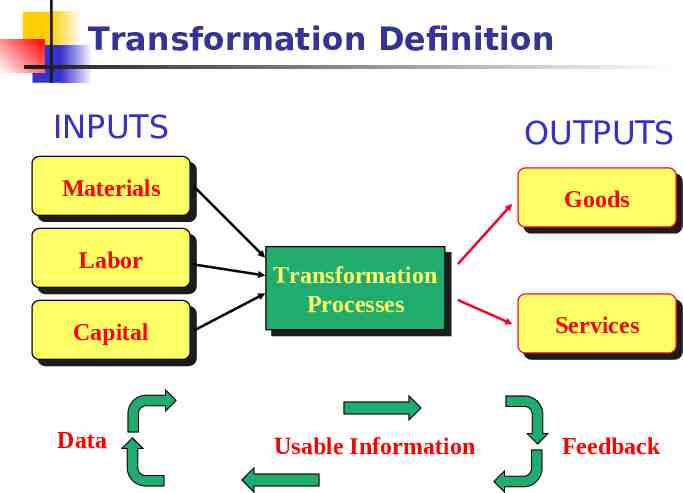
Transformation Definition INPUTS OUTPUTS Materials Materials Goods Goods Labor Labor Capital Capital Data Transformation Transformation Processes Processes Usable Information Services Services Feedback
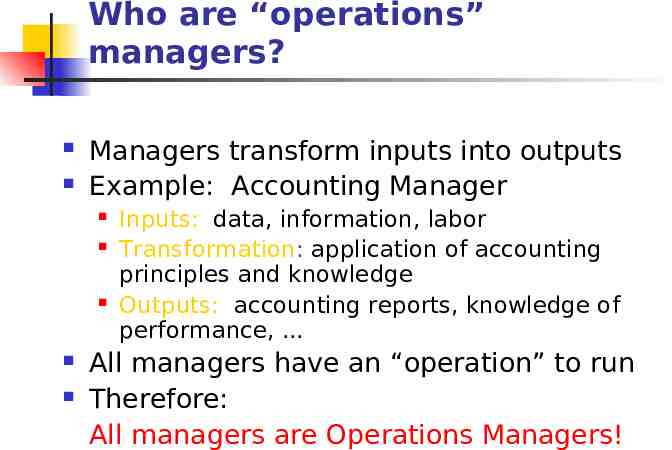
Who are “operations” managers? Managers transform inputs into outputs Example: Accounting Manager Inputs: data, information, labor Transformation: application of accounting principles and knowledge Outputs: accounting reports, knowledge of performance, . All managers have an “operation” to run Therefore: All managers are Operations Managers!
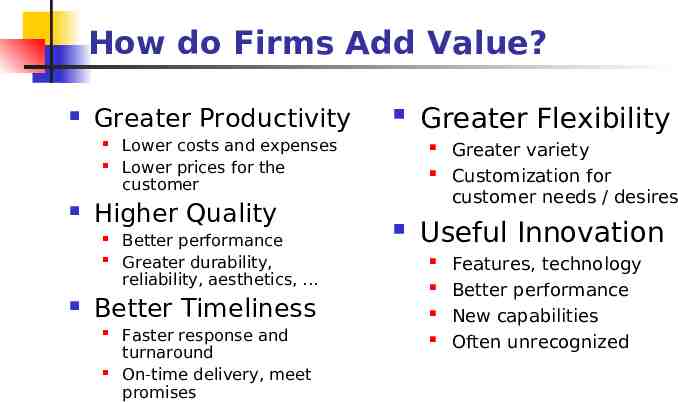
How do Firms Add Value? Greater Productivity Lower costs and expenses Lower prices for the customer Higher Quality Better performance Greater durability, reliability, aesthetics, . Better Timeliness Faster response and turnaround On-time delivery, meet promises Greater Flexibility Greater variety Customization for customer needs / desires Useful Innovation Features, technology Better performance New capabilities Often unrecognized
Key Point Usable information must be captured and organized in a way that managers can understand how much value has been added.
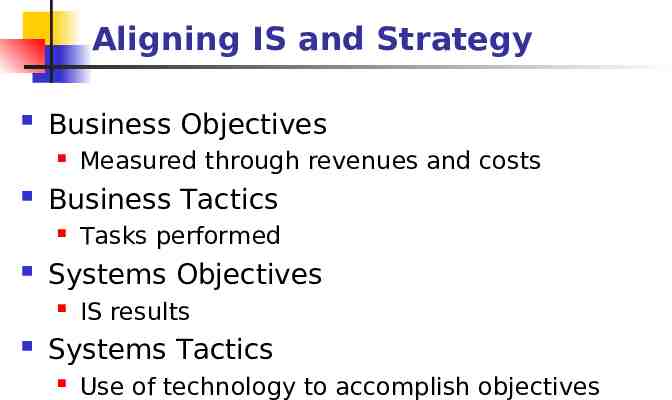
Aligning IS and Strategy Business Objectives Business Tactics Tasks performed Systems Objectives Measured through revenues and costs IS results Systems Tactics Use of technology to accomplish objectives
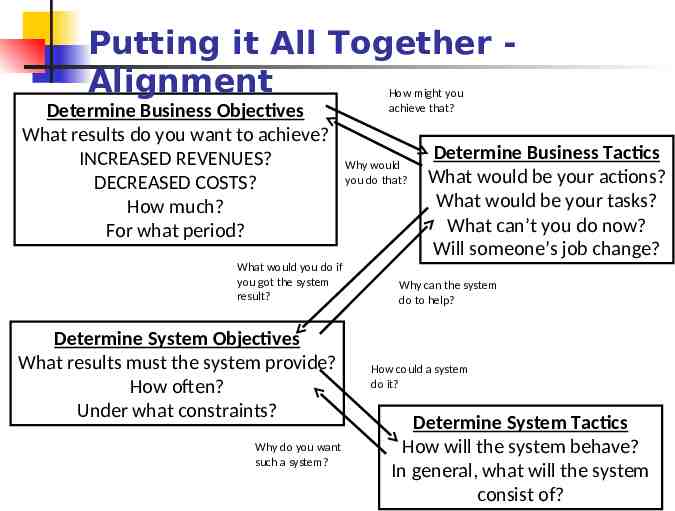
Putting it All Together Alignment Determine Business Objectives What results do you want to achieve? INCREASED REVENUES? DECREASED COSTS? How much? For what period? What would you do if you got the system result? Determine System Objectives What results must the system provide? How often? Under what constraints? Why do you want such a system? How might you achieve that? Why would you do that? Determine Business Tactics What would be your actions? What would be your tasks? What can’t you do now? Will someone’s job change? Why can the system do to help? How could a system do it? Determine System Tactics How will the system behave? In general, what will the system consist of?
What’s Needed? Business-Savvy IT Personnel IT-Savvy Business Persons
Business Intelligence Business Intelligence (BI) is important to help bring tools and data to every employee in a format each can use, on a device each has, when each needs it. BI is one form of sustainable competitive advantage BI is key to bringing together information, people and technology
Making Better Decisions Primary goal of BI is to help people make decisions that can improve company performance and promote competitive advantage BI aids better decision making by analyzing if actions are resulting in progress Best accomplished with clearly stated set of objectives and plan for achieving them Putting it all together
BI Foundation Besides being a broad range of technologies, software platforms, applications, and processess BI an attitude and performance management framework for problem solving The BI Cycle Analysis Insight Measurement Action
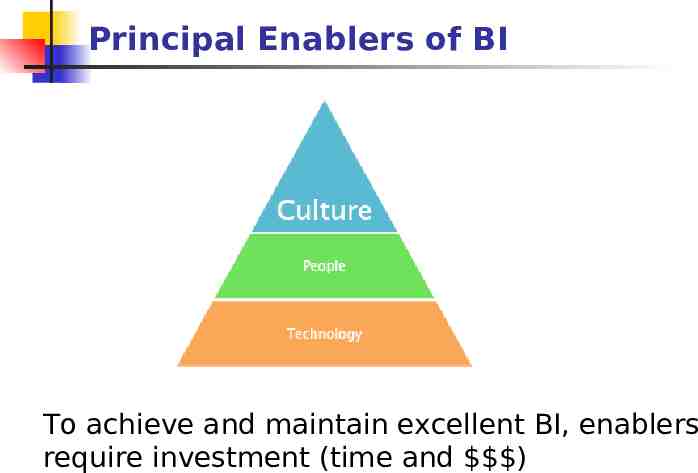
Principal Enablers of BI To achieve and maintain excellent BI, enablers require investment (time and )
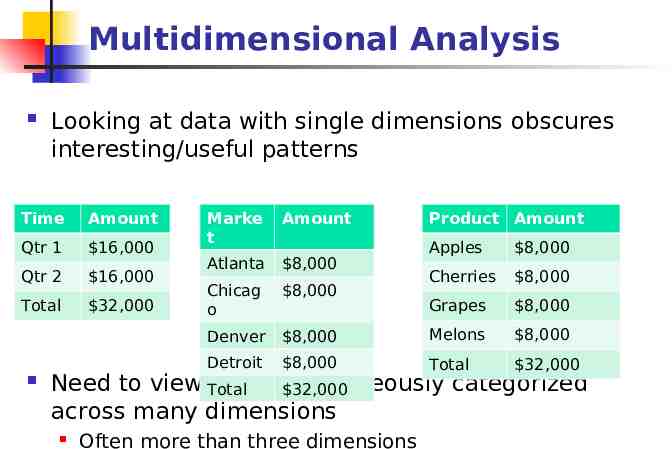
Multidimensional Analysis Looking at data with single dimensions obscures interesting/useful patterns Time Amount Qtr 1 16,000 Qtr 2 16,000 Total 32,000 Marke t Amount Atlanta 8,000 Chicag o 8,000 Denver Detroit Product Amount Apples 8,000 Cherries 8,000 Grapes 8,000 8,000 Melons 8,000 8,000 Total 32,000 Need to view Total data simultaneously categorized 32,000 across many dimensions Often more than three dimensions
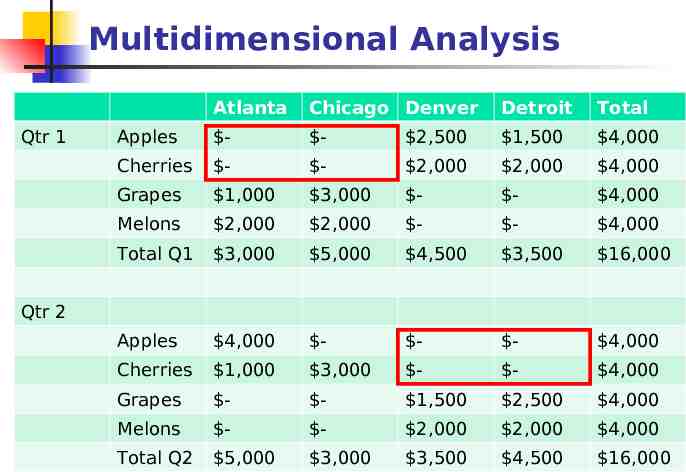
Multidimensional Analysis Qtr 1 Atlanta Chicago Denver Detroit Total Apples - - 2,500 1,500 4,000 Cherries - - 2,000 2,000 4,000 Grapes 1,000 3,000 - - 4,000 Melons 2,000 2,000 - - 4,000 Total Q1 3,000 5,000 4,500 3,500 16,000 Apples 4,000 - - - 4,000 Cherries 1,000 3,000 - - 4,000 Grapes - - 1,500 2,500 4,000 Melons - - 2,000 2,000 4,000 Total Q2 5,000 3,000 3,500 4,500 16,000 Qtr 2
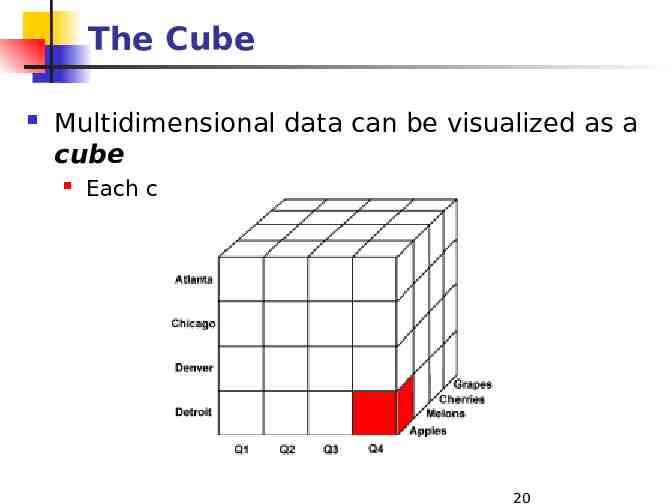
The Cube Multidimensional data can be visualized as a cube Each cell contains a specific value 20
Ad-Hoc Analysis Slicing, dicing, rolling up, drilling down enables ad-hoc analysis Unlike reporting, has no constraints Any question can be answered quickly What is our profitability by product and by customer? What are our sales in January in the Northeast region by sales person?
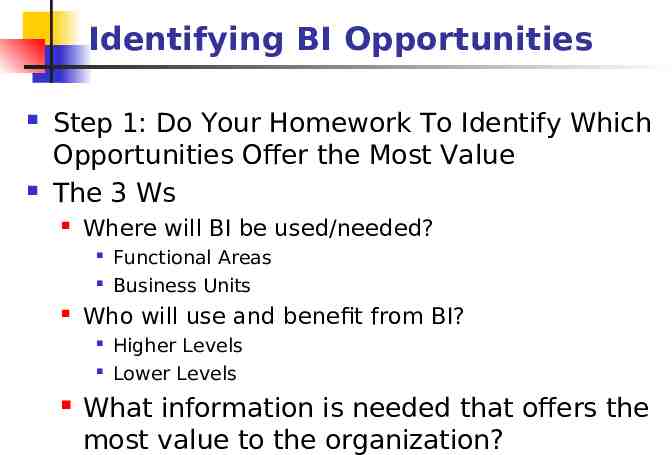
Identifying BI Opportunities Step 1: Do Your Homework To Identify Which Opportunities Offer the Most Value The 3 Ws Where will BI be used/needed? Who will use and benefit from BI? Functional Areas Business Units Higher Levels Lower Levels What information is needed that offers the most value to the organization?
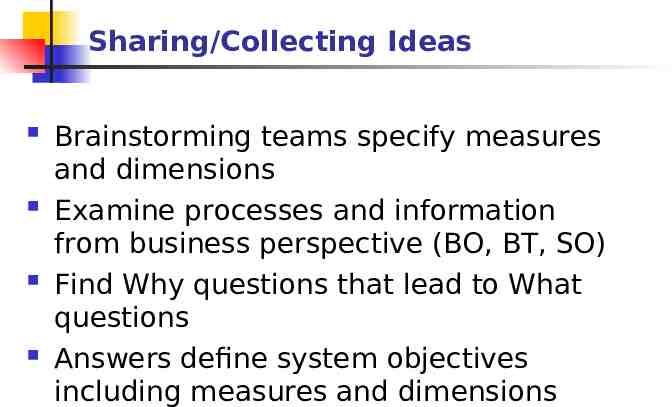
Sharing/Collecting Ideas Brainstorming teams specify measures and dimensions Examine processes and information from business perspective (BO, BT, SO) Find Why questions that lead to What questions Answers define system objectives including measures and dimensions
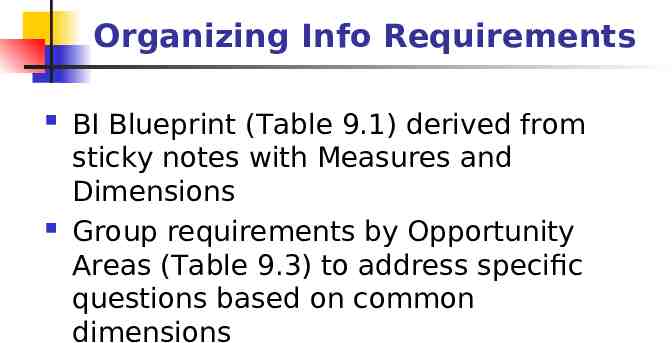
Organizing Info Requirements BI Blueprint (Table 9.1) derived from sticky notes with Measures and Dimensions Group requirements by Opportunity Areas (Table 9.3) to address specific questions based on common dimensions
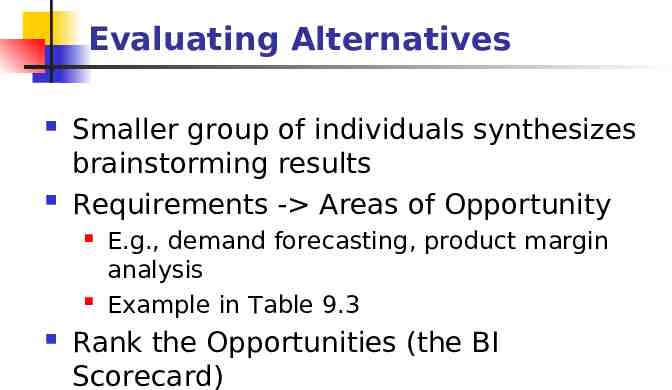
Evaluating Alternatives Smaller group of individuals synthesizes brainstorming results Requirements - Areas of Opportunity E.g., demand forecasting, product margin analysis Example in Table 9.3 Rank the Opportunities (the BI Scorecard)
Grade Opportunities by Importance Actionability? Business Tactics Possible? Materiality? Value or Business Objectives Impacted? Tactical vs. Strategic? Short or long term? Risk? Management Commitment? Higher level and more cross-functional are strategic, but more risky Applying the importance criteria Table 9.4
Grade Opportunities / Difficulty Cross functional? Data exist and accessible for each measure and dimension? New measures? More detail? Calculation complexity? Multiple sources? Applying the difficulty criteria Table 9.5
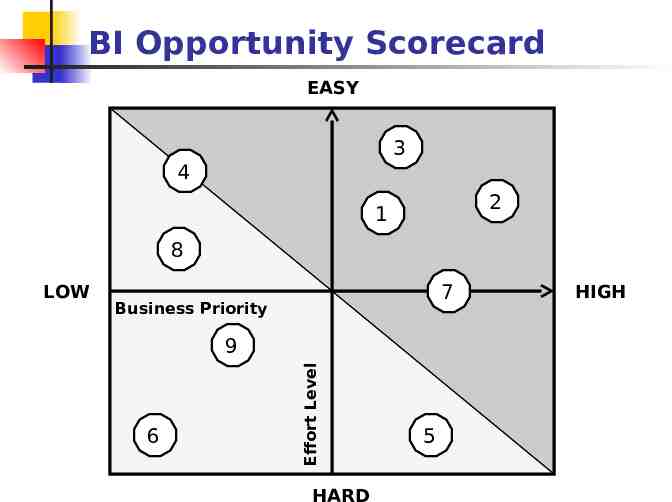
Develop BI Opportunity Scorecard Business Priority and Level of Effort on two scales High Priority / Easy – Go for it! Low & Medium Priority / Easy – Confidence! High Priority / Hard – Pilot! Others – Case by Case
BI Opportunity Scorecard EASY 3 4 2 1 8 7 Business Priority 9 6 Effort Level LOW HARD 5 HIGH
Process Mapping Why Process Map? To create a visual diagram of a process To establish a common language Assists in discussing improvement The end result is to provide a blueprint for implementing the process Other reasons?
First, map the “AS IS” processes Relationship maps Cross-functional process maps More detailed flowcharts
Process Mapping Identify Value Added Steps An activity that increases the value – from the customer’s perspective – of the product or service. Identify Non-Value Added Steps An activity that does not add value – from the customer’s perspective – of the product or service.
Identify Waste/Inefficiencies Processing: Redundant and unnecessary process steps, excess processing, excess checking and inspection. Excess use of energy of all types. Correction: Re-do’s, fix-ups, returns, mark-downs, managing complaints. Inventory: Idle in-progress or finished materials, ingredients, supplies, or information. Wait Time: Delays and queues of all types. Search Time: Time spent looking for information, people, supplies, and equipment. Transportation: Multiple handling steps and needless movement of material and information. Space: Storage of unneeded items, excess inventory or the general “mess” that builds up over time. Excess space required due to inefficient process flow. Complexity: Complex process flows. Confusing product and service choices. Organization boundaries which introduce inefficiencies and frustrate any sense of accomplishment.
After identifying waste/inefficiencies and non-value added steps, map the “TO BE” Processes
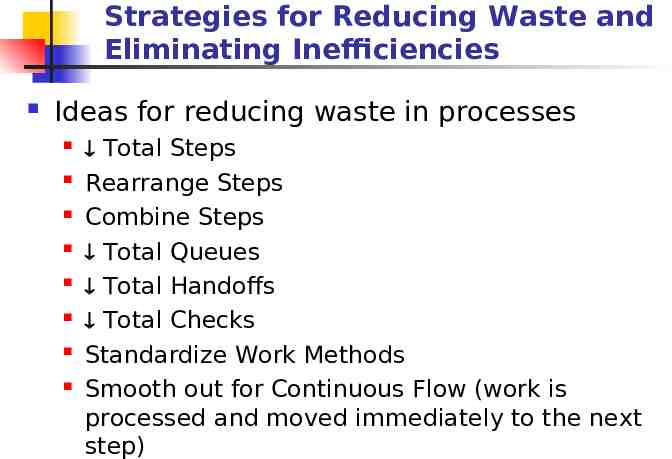
Strategies for Reducing Waste and Eliminating Inefficiencies Ideas for reducing waste in processes Total Steps Rearrange Steps Combine Steps Total Queues Total Handoffs Total Checks Standardize Work Methods Smooth out for Continuous Flow (work is processed and moved immediately to the next step)
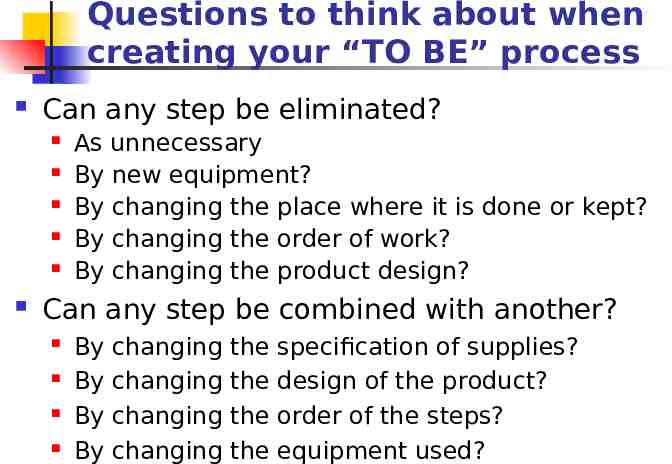
Questions to think about when creating your “TO BE” process Can any step be eliminated? As unnecessary By new equipment? By changing the place where it is done or kept? By changing the order of work? By changing the product design? Can any step be combined with another? By By By By changing changing changing changing the the the the specification of supplies? design of the product? order of the steps? equipment used?
Process Reengineering Reengineering strives “to break away from the old rules about how we organize and conduct business” Constructive defiance (break old rules) Creative destruction Out of the box thinking
Process Reengineering Not small changes Total reinvention Focus on processes Not tasks, jobs and/or people
Process Reengineering Which processes to reengineer? Use a BI Blueprint Identify Opportunity Areas Apply Importance Criteria Apply Difficulty Criteria Develop Opportunity Scorecard Go for the high impact opportunities May be the hardest
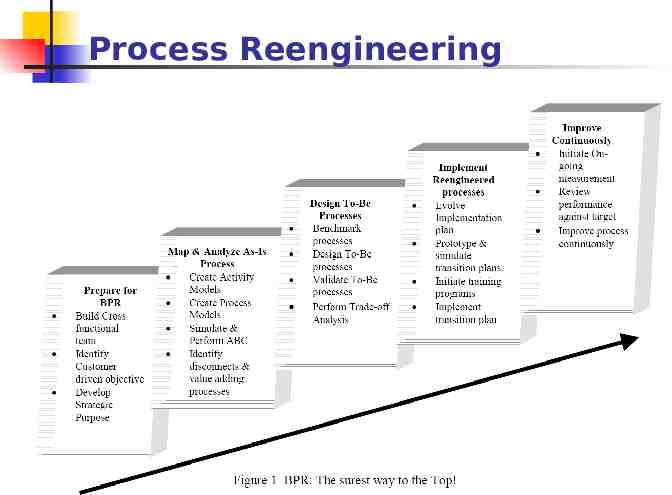
Process Reengineering
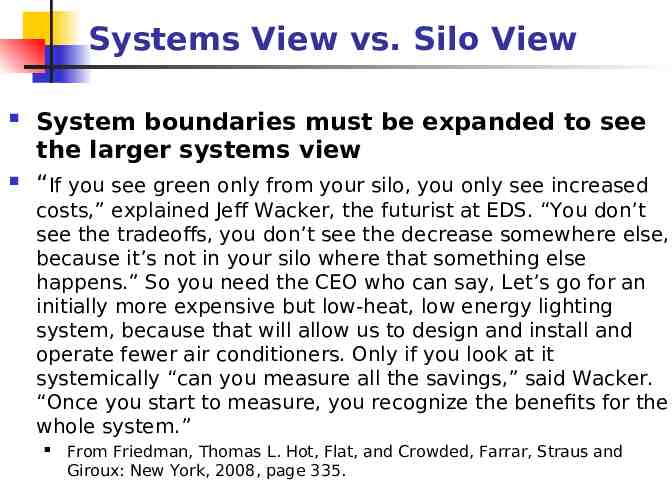
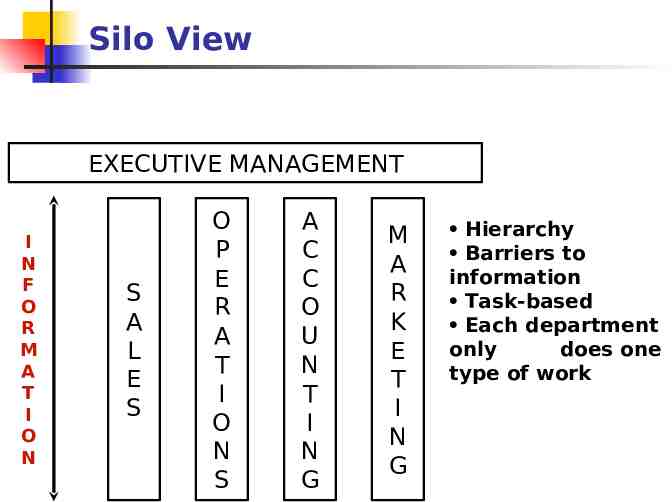
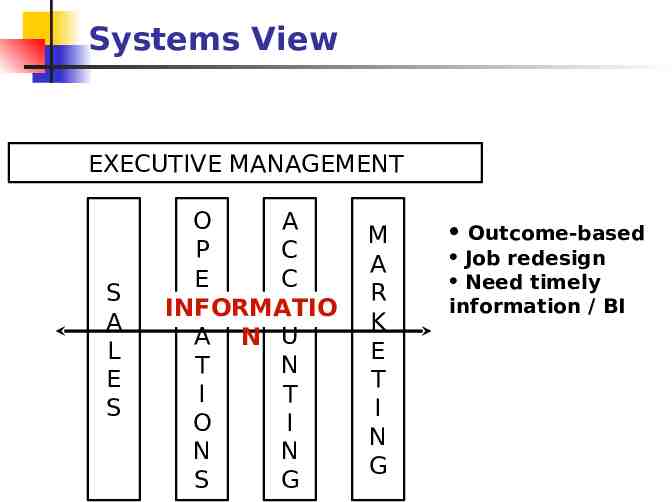
Systems View vs. Silo View System boundaries must be expanded to see the larger systems view “If you see green only from your silo, you only see increased costs,” explained Jeff Wacker, the futurist at EDS. “You don’t see the tradeoffs, you don’t see the decrease somewhere else, because it’s not in your silo where that something else happens.” So you need the CEO who can say, Let’s go for an initially more expensive but low-heat, low energy lighting system, because that will allow us to design and install and operate fewer air conditioners. Only if you look at it systemically “can you measure all the savings,” said Wacker. “Once you start to measure, you recognize the benefits for the whole system.” From Friedman, Thomas L. Hot, Flat, and Crowded, Farrar, Straus and Giroux: New York, 2008, page 335.
Silo View EXECUTIVE MANAGEMENT I N F O R M A T I O N S A L E S O P E R A T I O N S A C C O U N T I N G M A R K E T I N G Hierarchy Barriers to information Task-based Each department only does one type of work
Systems View EXECUTIVE MANAGEMENT S A L E S O A P C E C R O INFORMATIO A N U T N I T O I N N S G M A R K E T I N G Outcome-based Job redesign Need timely information / BI